. 2019 May;569(7755):236-240.
doi: 10.1038/s41586-019-1167-6. Epub 2019 May 1.

Externalized histone H4 orchestrates chronic inflammation by inducing lytic cell death

Affiliations

Externalized histone H4 orchestrates chronic inflammation by inducing lytic cell death

Carlos Silvestre-Roig et al. Nature. 2019 May.

Abstract

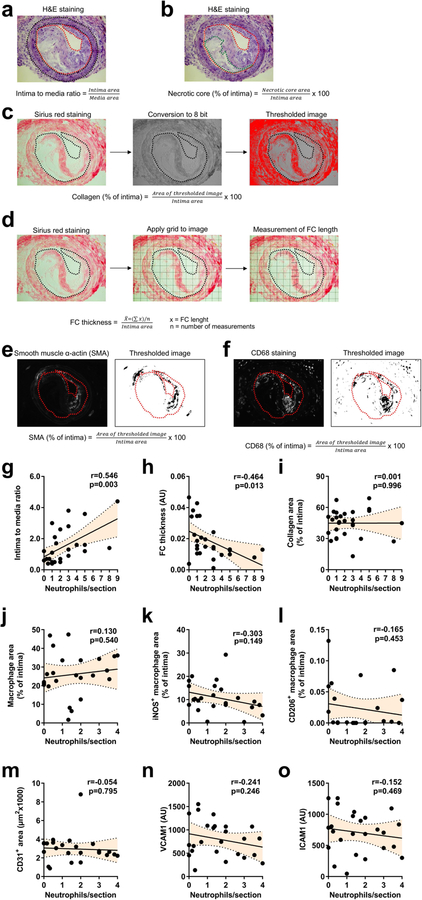
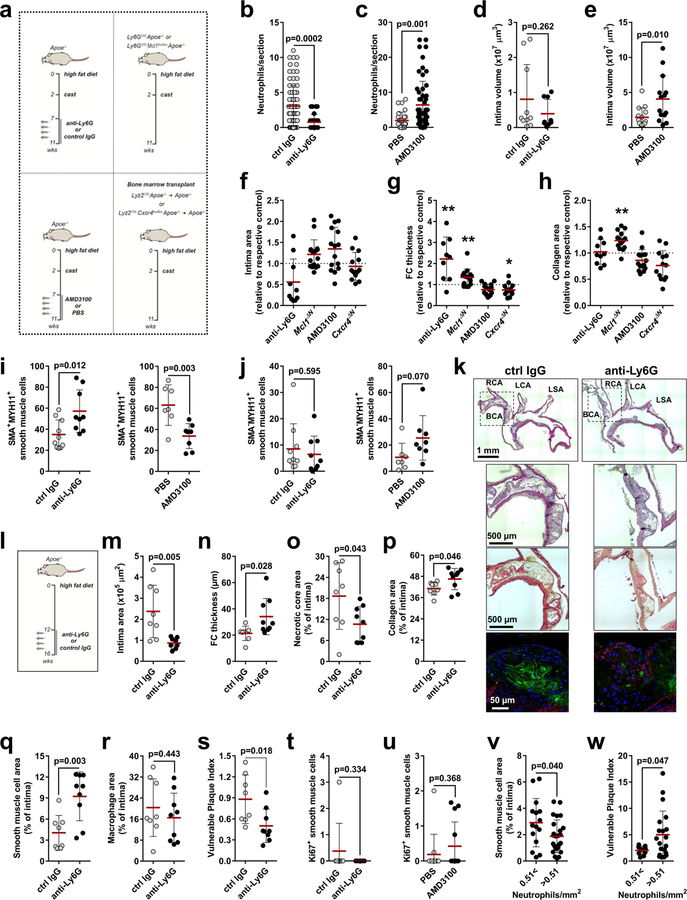
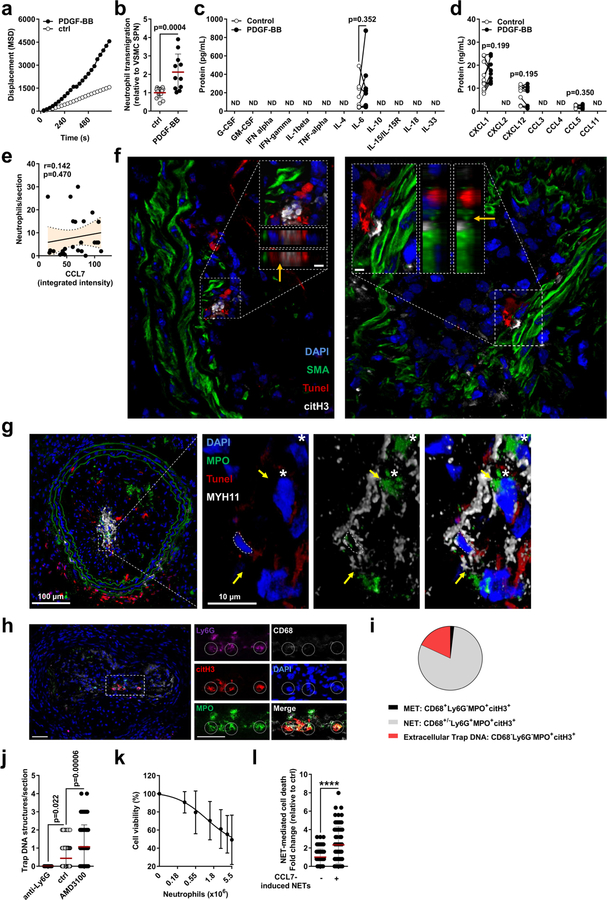
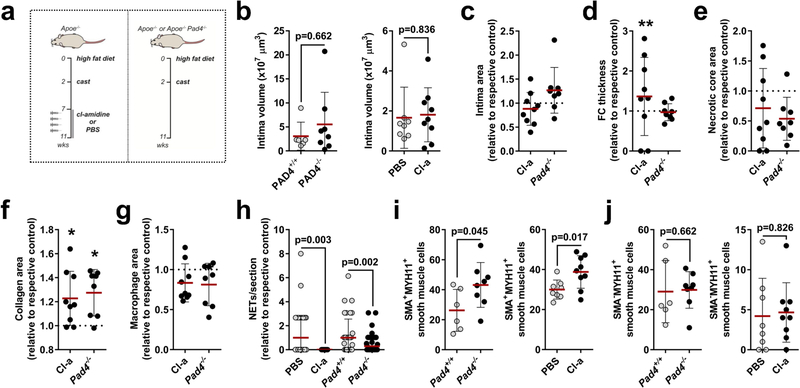
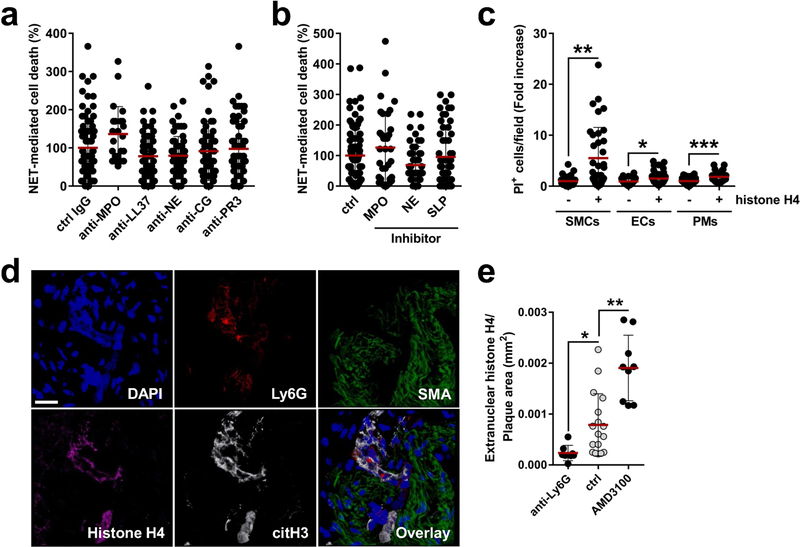
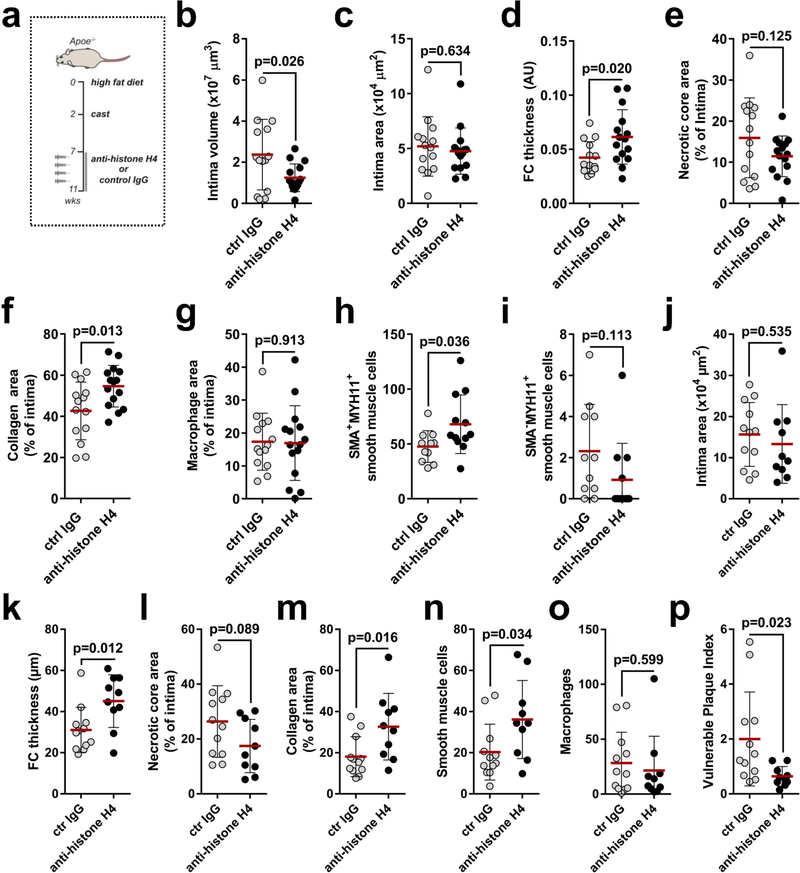
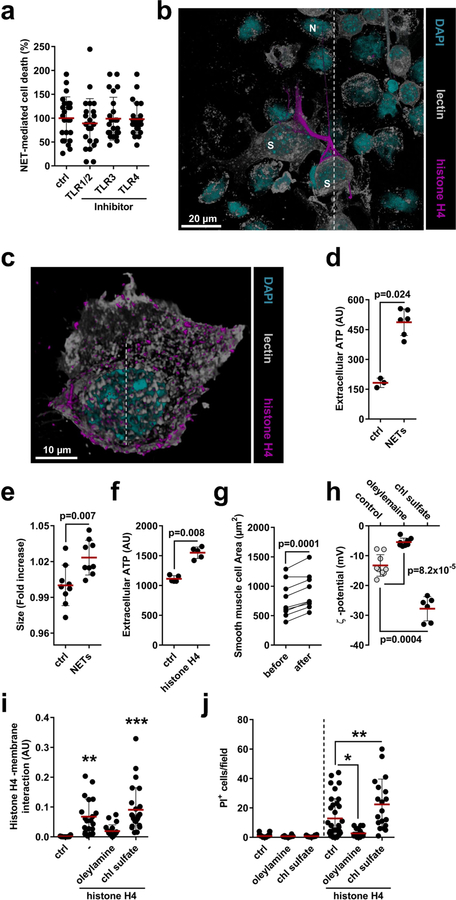
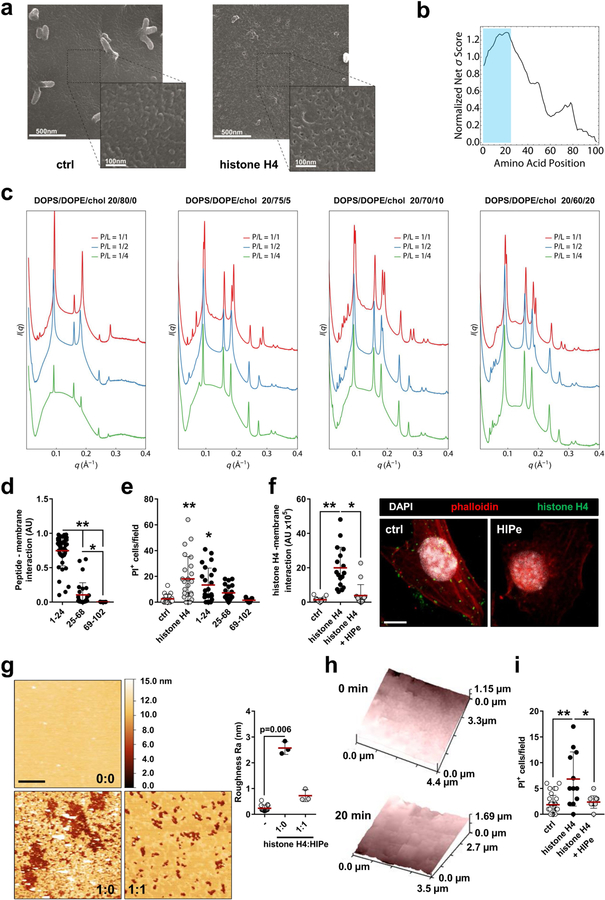
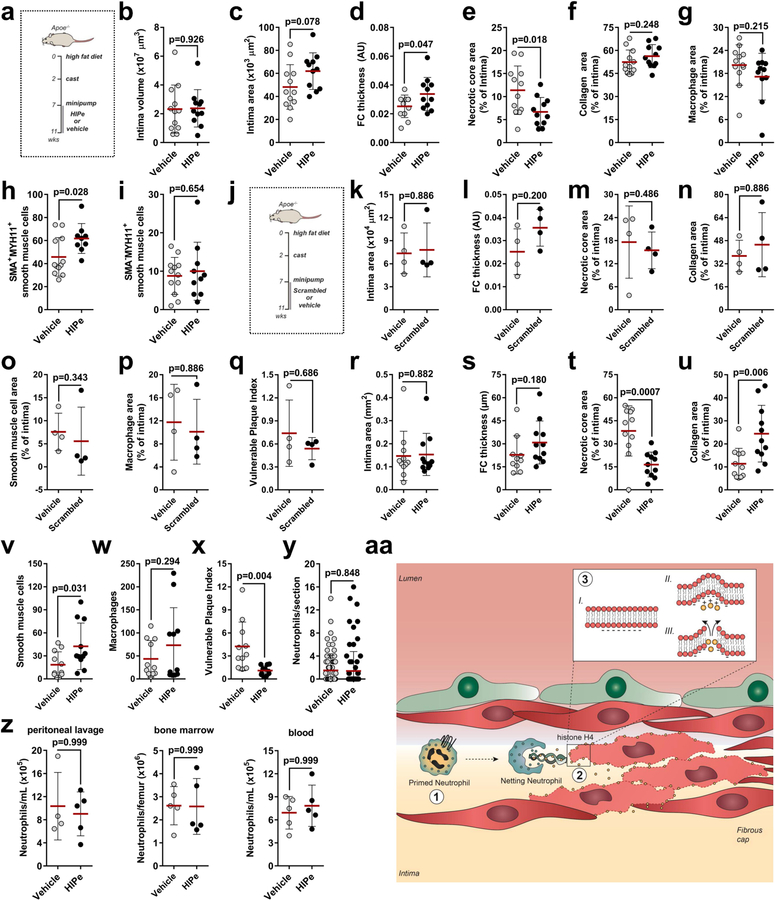
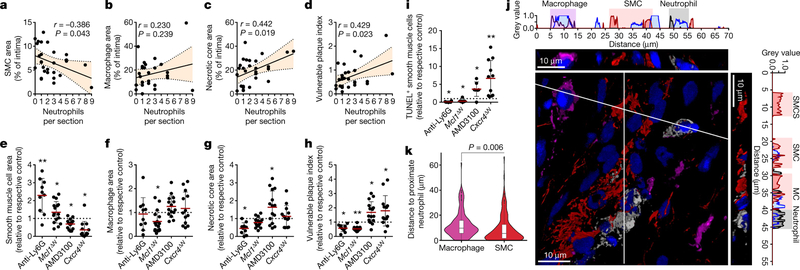
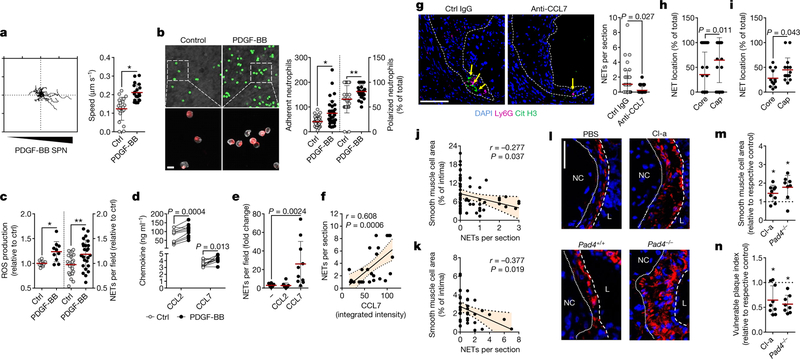
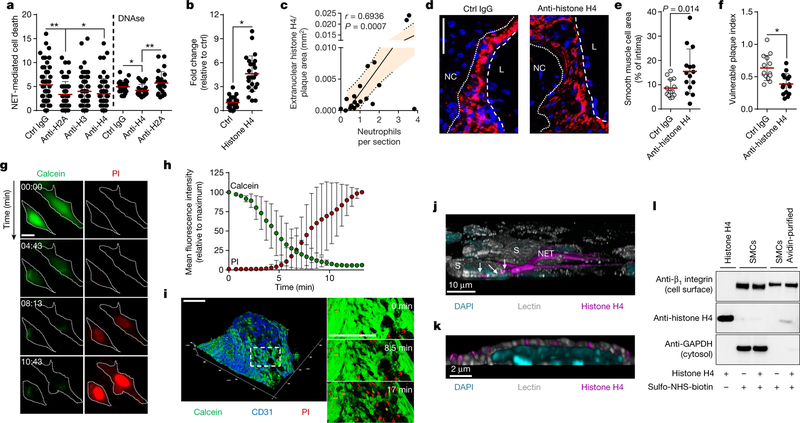
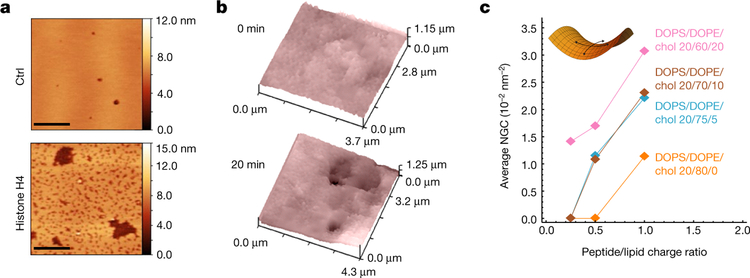
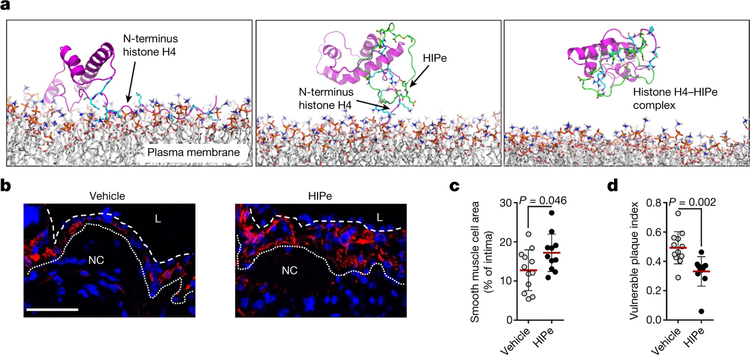
The perpetuation of inflammation is an important pathophysiological contributor to the global medical burden. Chronic inflammation is promoted by non-programmed cell death1,2; however, how inflammation is instigated, its cellular and molecular mediators, and its therapeutic value are poorly defined. Here we use mouse models of atherosclerosis-a major underlying cause of mortality worldwide-to demonstrate that extracellular histone H4-mediated membrane lysis of smooth muscle cells (SMCs) triggers arterial tissue damage and inflammation. We show that activated lesional SMCs attract neutrophils, triggering the ejection of neutrophil extracellular traps that contain nuclear proteins. Among them, histone H4 binds to and lyses SMCs, leading to the destabilization of plaques; conversely, the neutralization of histone H4 prevents cell death of SMCs and stabilizes atherosclerotic lesions. Our data identify a form of cell death found at the core of chronic vascular disease that is instigated by leukocytes and can be targeted therapeutically.


Conflict of interest statement

Competing interests The authors declare no competing interests.

Figures

Extended Data Fig. 1 |
Extended Data Fig. 1 |. Lesional neutrophils do not correlate with macrophage or endothelial phenotype.
af, Methodology used to analyse advanced atherosclerotic lesions. a, b, Representative pictures of H&E staining. a, Intima to media ratio was calculated as the quotient of intima area and media area. Red and black dotted lines delineate intima and media, respectively. b, Necrotic core area was quantified as the percentage of necrotic core area over the intima area. Red and green dotted lines delineate intima and necrotic core, respectively. c, d, Representative pictures of Sirius red staining. c, Sirius red pictures were converted into 8-bit images and segmented by thresholding hence generating binary images. Collagen area was quantified as the percentage of collagen area over the intima area. The black dotted line delineates the intima. d, Fibrous cap thickness was analysed as the average of lengths measurements in the positions overlapping with the lines of a square-shaped grid. Averaged fibrous cap thickness was corrected by the intima area. e, f, Representative pictures of smooth muscle cell actin (SMA, e) and CD68 (f) staining. Immunofluorescence images were segmented by thresholding to convert fluorescence signal into a binary image. SMA/CD68 area was quantified as the percentage of SMA/CD68 area over the intima area. The red dotted line delineates the intima. go, Advanced atherosclerotic lesions were generated in the carotid artery of Apoe−/− mice. Pearson correlation between lesional neutrophils and lesion size (n = 28 mice, g), fibrous cap thickness (n = 28 mice, h), collagen area (n = 28 mice, i), macrophage area (CD68+, n = 24 mice, j), pro-inflammatory macrophages (CD68+iNOS+, n = 24 mice, k), anti-inflammatory macrophages (CD68+CD206+, n = 23 mice, l), endothelial cell area (CD31+, n = 25 mice, m), VCAM1 expression on endothelial cells (n = 25 mice, n) and ICAM1 expression on endothelial cells (n = 25 mice, o). Dotted line represents 95% confidence interval. Note that data in gi and jo were generated in a different set of lesions due to a shortage of sections from mice displayed in gi.
Extended Data Fig. 2 |
Extended Data Fig. 2 |. Modulation of lesional neutrophil counts alters lesion stability.
a, Models of neutropenia and neutrophilia. b, c, Quantification of lesional neutrophils in indicated treatments. n = 79 sections (ctrl IgG), n = 25 sections (anti-Ly6G), n = 27 sections (PBS), n = 58 sections (AMD3100). Two-sided unpaired t-test. d, e, Lesion volumes of mice with induced neutropenia (d) or induced neutrophilia (e). n = 10 mice (ctrl IgG), n = 9 mice (anti-Ly6G), n = 15 mice (PBS), n = 14 mice (AMD3100). Two-sided unpaired t-test. fh, Lesion characteristics of mice with antibody-induced neutropenia (anti-Ly6G, n = 10 mice, except in (g) n = 9 mice), genetic neutropenia (Ly6gcreMcl1flox/flox, Mcl1ΔN, n = 16 mice), induced neutrophilia (AMD3100, n = 15 mice) and genetic neutrophilia (Lyz2creCxcr4flox/flox, Cxcr4ΔN, n = 13 mice) compared with respective controls (isotype IgG (n = 10 mice), Ly6gcre (n = 18 mice), vehicle (n = 15 mice) or Lyz2cre (n = 11 mice)), (dashed line). Two-sided unpaired t-test; *P < 0.05; **P < 0.01. Displayed is the quantification of lesion size (f), fibrous cap (FC) thickness (g) and collagen area (h). i, j, Analysis of SMA+MYH11+ (i) and SMAMYH11+ (j) SMCs in indicated treatments. n = 10 mice (ctrl IgG), n = 9 mice (anti-Ly6G), n = 7 mice (PBS), n = 8 mice (AMD3100). Two-sided unpaired t-test. ks, Antibody-induced neutropenia generates atherosclerotic lesions with reduced signs of vulnerability in the brachiocephalic artery in Apoe−/−mice fed a HFD for 16 weeks. k, Representative micrographs showing the aortic arch of isotype IgG (ctrl-IgG) and anti-Ly6G-treated mice stained with H&E (top), Sirius red (middle) and antibodies (bottom) to SMA (red), CD68 (green). l, Experimental scheme. ms, Analyses of lesion characteristics. Displayed are quantification of intima area (m), fibrous cap (FC) thickness (n), necrotic core area (o), collagen area (p), SMC area (SMA+, q), macrophage area (CD68+, r), and plaque vulnerability (s). n = 8 mice (ctrl IgG), n = 9 mice (anti-Ly6G) except for panel (m) n = 8 mice. Two-sided unpaired t-test. t, u, Proliferating SMCs (Ki67+SMA+) in lesions of indicated treatments. n = 8 mice (ctrl IgG), n = 8 mice (anti-Ly6G), n = 12 mice (PBS), n = 13 mice (AMD3100). Two-sided unpaired t-test. v, w, Percentage of SMC area (SMA+, n = 15 sections for 0.51<, n = 25 sections for >0.51, v) and overall vulnerability (n = 10 sections for 0.51<, n = 20 sections >0.51, w) of human atherosclerotic specimens grouped by the number of lesional neutrophils per mm2. Two-sided unpaired t-test. Data are mean ± s.d. BCA, brachiocephalic artery; ctrl, control; SMA, smooth muscle actin; LCA, left carotid artery; LSA, left subclavian artery; MYH11, Myosin heavy chain 11; RCA, right carotid artery.
Extended Data Fig. 3 |
Extended Data Fig. 3 |. Activated SMCs induce neutrophil chemotaxis and induce NET-mediated SMC death.
a, Neutrophil displacement in gradient of supernatant obtained from PDGF-BB-activated or resting SMCs (ctrl). n = 20 neutrophils (ctrl), n = 18 neutrophils (PDGF-BB). Two-way ANOVA. P = 1 × 10⁻¹⁵ (ctrl vs PDGF-BB). MSD, mean square displacement. b, Neutrophils transmigrated towards supernatants obtained from PDGF-BB-activated or resting SMCs (ctrl). n = 14 replicates (ctrl), n = 11 replicates (PDGF-BB). Two-sided unpaired t-test. c, d, Multiplex ELISA of indicated growth factors and cytokines (c) and chemokines (d) in cell-free supernatants from SMCs treated with PDGF-BB or vehicle. n = 9 replicates (IL-6, CXCL12), n = 10 replicates (CXCL1, CCL5). Two-sided paired t-test. e, Pearson correlation between neutrophils and intimal CCL7 in mouse advanced atherosclerotic lesions, n = 28 sections. Dotted line represents 95% confidence interval. f, Representative micrographs of mouse atherosclerotic lesions showing SMCs (SMA, green), nuclei (blue), dead cells (TUNEL, red), and NETs (citrullinated histone H3, white). Dashed lines indicate cross-section views. Scale bar, 20 μm. Close-ups represent xz (left) and yz (right) cross-sections. Scale bar, 4 μm. Orange arrows indicate points of interactions between dead SMCs and NETs. g, Micrographs of mouse atherosclerotic lesions showing SMCs (MYH11, white), nuclei (blue), dead cells (TUNEL, red), and MPO (green). Yellow arrows indicate points of interactions between dead SMCs and NETs. Asterisks indicate intact MPO+ cells. hj, Advanced atherosclerotic lesions in the carotid artery were stained with antibodies to Ly6G, CD68, myeloperoxidase (MPO), and citrullinated H3 (citH3) and counterstained with DAPI. h, Representative images. Scale bar, 50 μm. i, Pie chart showing distribution of macrophage extracellular traps (METs, 1.86%), NETs (80.05%), and extracellular trap DNA (18.09%) based on marker analysis defined underneath, n = 35 sections from 8 mice. j, Extracellular trap DNA structures in carotid artery sections from neutropenic mice (anti-Ly6G, n = 13 sections), mice with intact white blood cell count (vehicle treated, n = 96 sections), or neutrophilic mice (AMD3100, n = 57 sections). Two-sided unpaired t-test. k, Percentage of viable SMCs after exposure to PMA-induced NETs isolated from indicated number of neutrophils. n = 16 biological samples (0, 2.75 × 10⁶ neutrophils), n = 13 biological samples (0.275106, 0.55 × 10⁶, 1.375 × 10⁶, 4.125 × 10⁶ neutrophils), n = 11 biological samples (5.5 × 10⁶ neutrophils). l, Cell death of SMCs incubated with NETs isolated from neutrophils treated with recombinant CCL7. n = 67 fields (−), n = 72 fields (+). Two-sided unpaired t-test, ****P = 0.000002. Data are mean ± s.d. MPO, myeloperoxidase; ND, not detected.
Extended Data Fig. 4 |
Extended Data Fig. 4 |. Pharmacological and genetic inhibition of NET release reduces traits of atherosclerotic plaque vulnerability.
a, Experimental scheme. bg, Quantification of lesion characteristics. Displayed are lesion volumes (b), lesion size (c), fibrous cap (FC) thickness (d), necrotic core area (e), collagen area (f) and macrophage area (CD68+, g). Cl-amidine-treated (Cl-a, n = 9 mice) and Apoe−/−Pad4−/− (Pad4−/−, n = 8 mice) are compared to respective controls (PBS, n = 8 mice), Apoe−/− (Pad4+/+, n = 6 mice). Two-sided unpaired t-tests (PBS vs Cl-a) or two-sided Mann-Whitney tests (Pad4+/+ vs Pad4−/−) were used. h, Quantification of NETs per section of indicated mice. n = 40 sections (PBS), n = 31 sections (Cl-a), n = 35 sections (Apoe−/−), n = 68 sections (Apoe−/−Pad4−/−). Two-sided unpaired t-test. i, j, Analysis of SMA+MYH11+ (i) and SMAMYH11+(j) SMCs in indicated mice. Two-sided unpaired t-test (PBS vs Cl-a) or two-sided Mann-Whitney test (Pad4+/+ vs Pad4−/−) were used. PBS (n = 8 mice), Cl-amidine (Cl-a, n = 9 mice), Apoe−/− (Pad4+/+, n = 6 mice), Apoe−/−Pad4−/− (Pad4−/−, n = 8 mice). *P < 0.05; **P < 0.01. Data are mean ± s.d.
Extended Data Fig. 5 |
Extended Data Fig. 5 |. NET-derived histone H4 induces cell toxicity.
ac, Analysis of cell death (propidium iodide uptake). a, NETs were pre-incubated with indicated antibodies for 1 h before addition to SMCs. MPO, myeloperoxidase; NE, neutrophil elastase; CG, cathepsin G; PR3, proteinase 3. n = 79 IgG, n = 23 MPO, n = 60 LL37, n = 60 NE, n = 58 CG and n = 60 PR3 fields. One-way ANOVA with Dunnet’s correction. P = 0.105 (MPO), P = 0.219 (LL37), P = 0.270 (NE), P = 0.925 (CG), P = 0.999 (PR3). All conditions were compared against control (ctrl). b, NETs were pre-incubated with inhibitors to myeloperoxidase (MPO), neutrophil elastase (NE), or secretory leukocyte protease (SLP) for 1 h before their addition to SMCs. n = 96 ctrl, n = 35 MPO, n = 58 NE, n = 58 SLP fields. One-way ANOVA with Dunnet’s correction. P = 0.299 (MPO), P = 0.085 (NE), P = 0.978 (SLP). All conditions were compared against control (ctrl). c, SMCs, endothelial cells (ECs) and peritoneal macrophages (PMs) were incubated with recombinant histone H4. Cell death was assessed by PI uptake. n = 36 and n = 36 for SMCs, n = 35 and n = 36 for ECs, n = 47 and n = 39 for PMs. Two-sided unpaired t-test, *P = 0.029; **P = 3.847 × 10⁻⁵; ***P = 8.775 × 10⁻⁶. d, Representative confocal immunofluorescence of advanced atherosclerotic lesions to visualize DNA (DAPI, blue), neutrophils (Ly6G, red), SMCs (SMA, green), histone H4 (magenta), and citrullinated histone H3 (white). Scale bar, 20 μm. e, Quantification of extranuclear histone H4 per section of indicated treatments. n = 17 ctrl, n = 8 anti-Ly6G, n = 9 AMD3100. One-way ANOVA with Dunnet’s correction, *P = 0.02; **P = 0.0002. Data are mean ± s.d. ctrl, control; SMA, smooth muscle actin.
Extended Data Fig. 6 |
Extended Data Fig. 6 |. Neutralization of histone H4 stabilizes atherosclerotic lesions.
a, Experimental scheme. bi, Quantification of lesion characteristics of the carotid artery. Displayed are lesion volume (b), lesion size (c), fibrous cap (FC) thickness (d), necrotic core area (e), collagen area (f), macrophage area (CD68+, g), SMA+MYH11+ cells (h) and SMAMYH11+ cells (i). n = 14 mice (ctrl IgG) except for (h, i) n = 11 mice; n = 15 mice (anti-histone H4) except for (h, i) n = 12 mice. Two-sided unpaired t-test. jp, Quantification of lesion characteristics on the brachiocephalic artery. Displayed are lesion size (j), fibrous cap (FC) thickness (k), necrotic core area (l), collagen area (m), SMCs (SMA+, n), macrophages (CD68+, o) and overall vulnerability (p). Two-sided unpaired t-test, n = 12 mice (ctrl IgG) or 10 mice (anti-histone H4). Data are mean ± s.d.
Extended Data Fig. 7 |
Extended Data Fig. 7 |. NET-derived histone H4 interaction with cell membranes is surface charge dependent and induces a lytic cell death.
a, SMCs were pre-incubated with indicated inhibitors before NET treatment. Cell death was assessed by PI uptake. n = 24 fields, except TLR4, n = 23 fields. One-way ANOVA with Dunnet’s correction, P = 0.729 (TLR1/2), P = 0.999 (TLR3), P = 0.995 (TLR4). All conditions were compared against control (ctrl). b, Representative high-resolution confocal microscopy images were used to visualize cell membrane (lectin, white), histone H4 (magenta) and DNA (DAPI, cyan) in a SMC (S) and neutrophil (N) co-culture. Dashed lines indicate cross-section views represented in Fig. 3j. c, Confocal immunofluorescence micrograph to visualize cell membrane (lectin, white), histone H4 (magenta) and DNA (DAPI, cyan). The dashed line indicates the cross-section view represented in Fig. 3k. d, e, SMCs were incubated with NETs. d, Extracellular ATP. n = 3 biological replicates (crtl), n = 6 biological replicates (NETs). Twosided Mann-Whitney test. e, Flow cytometry analysis of cell size. n = 9 biological replicates. Two-sided unpaired t-test. f, g, SMCs were incubated with histone H4. f, Extracellular ATP. n = 5 biological replicates. Two-sided Mann-Whitney test. g, Time-lapse microscopy images were used to measure SMC area before and after incubation with histone H4. n = 9 cells. Two-sided paired t-test. h, Analysis of the ζ potential of SMCs incubated with oleylamine or cholesterol sulfate (chl sulfate). n = 9 biological replicates (ctrl), n = 8 biological replicates (oleylamine), n = 6 biological replicates (chl sulfate). Two-sided Mann-Whitney test. i, j, SMCs were incubated with recombinant histone H4 after preincubation with oleylamine or cholesterol sulfate (chl sulfate). i, Confocal microscopy was used to detect histone H4 and plasma cell membrane (phalloidin). Peptide-membrane interaction quantified as the ratio of histone H4-fragment signal and plasma membrane area. n = 10 cells (ctrl), n = 20 cells (histone H4, –), n = 20 cells (oleylamine), n = 25 cells (chl sulfate). One-way ANOVA with Dunnet’s correction. **P = 0.007; ***P = 0.0001 vs ctrl. j, Quantification of PI incorporation. n = 54 fields, n = 8 fields, n = 10 fields, n = 34 fields, n = 21 fields and n = 19 fields for each condition represented. One-way ANOVA with Tukey’s correction, *P = 0.001; **P = 0.004. Data are mean ± s.d.
Extended Data Fig. 8 |
Extended Data Fig. 8 |. Membrane pore-forming activity of histone H4.
a, Scanning electron micrographs of SMCs incubated with recombinant histone H4 or vehicle. b, Machine learning screen of full-length sequence histone H4 predicts potent membrane activity at the N terminus (residues 1–24 highlighted in blue). c, SAXS data demonstrates that N-terminal domain of histone H4 induces negative Gaussian curvature (NGC) in cell membranes at the indicated peptide:lipid (P/L) ratios. The histone H4 N terminus was incubated with indicated membrane compositions and the resulting structures were measured with SAXS. The peptide induced Pn3m cubic phases, which are rich in NGC, and are indicative of membrane permeation. d, SMCs were incubated with biotinylated histone H4 fragments (1–24: N terminus; 25–68: α-helix; 69–102: C terminus). Confocal microscopy was used to detect histone H4 fragments and plasma cell membrane. Peptide-membrane interaction was quantified as the ratio of histone H4 fragment signal and plasma membrane area. n = 44 cells (1–24), n = 28 cells (25–68), n = 33 cells (69–102). One-way ANOVA with Tukey’s correction; *P = 0.049; **P = 4 × 10⁻¹⁴. e, PI incorporation in SMCs treated with histone H4 fragments or the full-length protein. n = 19 fields (ctrl), n = 24 fields (histone H4), n = 24 fields (1–24), n = 21 fields (25–68), n = 19 fields (69–102). One-way ANOVA with Dunnet’s correction; *P = 0.005; **P = 0.0001 vs control. f, Histone H4 was preincubated with HIPe or vehicle and added to SMCs. Confocal microscopy was used to visualize interaction of histone H4 (green) with plasma cell membrane (phalloidin, red). n = 20 cells (ctrl), n = 17 cells (histone H4), n = 15 cells (histone H4+HIPe). One-way ANOVA with Tukey’s correction; *P = 9.243 × 10⁻⁷; **P = 6.239 × 10⁻⁹. Scale bar, 20 μm. g, Atomic force microscopy studies of lipid membranes treated with the indicated histone H4:HIPe ratio. Scale bar, 1 μm. Membrane disruption was quantified as membrane roughness. n = 13 membranes (ctrl), n = 3 membranes (1:0), n = 3 (1:1). Kruskal-Wallis test with Dunn’s correction. h, Live scanning ion conductance microscopy of SMCs. Images represent the plasma membrane before and after incubation with histone H4 and HIPe. i, PI incorporation in SMCs treated with recombinant histone H4 in the presence or absence of HIPe. n = 33 fields (ctrl), n = 12 fields (histone H4), n = 11 fields (histone H4 + HIPe). One-way ANOVA with Tukey’s correction; *P = 0.001; **P = 8.844 × 10⁻⁶. Data are mean ± s.d.
Extended Data Fig. 9 |
Extended Data Fig. 9 |. Disruption of histone H4-cell membrane interaction prevents pore formation and stabilizes atherosclerotic lesions.
a, Experimental scheme. bi, Lesion characteristics in the carotid artery. Displayed are lesion volume (b), lesion size (c), fibrous cap (FC) thickness (d), necrotic core area (e), collagen area (f), macrophage area (CD68+, g), SMA+MYH11+ (h) and SMAMYH11+ (i) SMCs. n = 12 mice (vehicle), n = 11 mice (HIPe) except for (h) n = 9 mice and (i) n = 10 mice. Two-sided unpaired t-test. j, Experimental scheme. kq, Assessment of lesion characteristics. Displayed is quantification lesion size (k), fibrous cap (FC) thickness (l), necrotic core area (m), collagen area (n), SMC area (SMA+, o), macrophage area (p) and overall vulnerability (q). n = 4 mice (vehicle), n = 4 mice (sHIPe). Two-sided Mann-Whitney test. rx, Assessment of lesion characteristics in the brachiocephalic artery of mice treated as described in a. Displayed is quantification lesion size (r), fibrous cap (FC) thickness (s), necrotic core area (t), collagen area (u), SMCs (SMA+, v), macrophages (CD68+, w) and overall vulnerability (x). n = 11 mice (vehicle), n = 11 mice (HIPe), except for (s) Vehicle n = 10. Two-sided unpaired t-test, y, Number of lesional neutrophils per section of vehicle- (n = 82 cells) or HIPe- (n = 83 cells) treated mice. Two-sided unpaired t-test. z, Mice were treated with TNF and received either vehicle control or HIPe. Neutrophils were quantified in the peritoneum (left, n = 4 (vehicle), n = 5 (HIPe)), the bone marrow (middle, n = 5 (vehicle), n = 5 (HIPe)), and the blood (right, n = 5 (vehicle), n = 5 (HIPe)). aa, Scheme summarizing the cytotoxic activity of neutrophils during atherosclerotic plaque vulnerability. The interaction of lesional SMCs with neutrophils induces NETosis (1) which acts as a carrier of cytotoxic histone H4 (2). The cationicity of the N-terminal domain of histone H4 induces plasma membrane bending and pore formation leading to SMC lysis (3). SMC death contributes to fibrous cap thinning and increased plaque instability. Data are mean ± s.d.
Fig. 1 |
Fig. 1 |. Neutrophils dictate plaque stability.
ad, Advanced lesions were generated by insertion of a shear stress modifier around the carotid artery. Pearson correlation between lesional neutrophils and SMC area (SMA+, a), macrophage area (CD68+, b), necrotic core area (c), and overall vulnerability (d). n = 28 mice. Dotted line represents 95% confidence interval. ei, Neutropenia (anti-Ly6G) or neutrophilia (AMD3100) were induced during the last 4 weeks of the experiment. Genetically neutropenic Apoe−/− mice (Ly6greMcl1flox/flox, Mcl1ΔN) were fed a high-fat diet for a total of 11 weeks and advanced atherosclerotic lesions were analysed in aortic roots. Genetic neutrophilia was established in Apoe−/− mice that were lethally irradiated and reconstituted with bone marrow from Lyz2cre mice or from Lyz2creCxcr4flox/flox (Cxcr4ΔN) mice. Antibody-induced neutropenic (anti-Ly6G, n = 10 mice (ei), genetic neutropenic (Mcl1ΔN), n = 16 mice (eh), n = 10 mice (i)), pharmacological neutrophilic (AMD3100, n = 15 mice (eh), n = 7 mice (i)) and genetic neutrophilic (Cxcr4ΔN, n = 13 mice (eh), n = 11 mice (i)) are compared with respective controls (isotype IgG, n = 10 mice (ei), Ly6gcre, n = 18 mice (eh), n = 10 mice (i), vehicle (n = 15 mice (eh), n = 7 mice (i)), or Lyz2cre (n = 11 mice (eh), n = 9 mice (i))), respectively, dashed line. Displayed is the quantification of the SMC (SMA+) area (e), macrophage area (CD68+, f), necrotic core area (g), and overall vulnerability (h). i, Dead SMCs were quantified as TUNEL+SMA+ cells. For the aMd3100 condition, a twosided Mann-Whitney test was used. j, Representative immunofluorescence micrograph showing lesional neutrophils (Ly6G+, grey), SMCs (SMA+, red), macrophages (CD68+, magenta) and nuclei (DAPI, blue). Dotted lines indicate cross-section views. The diagonal cross-section is shown at the top (xyz) and the vertical cross-section is shown on the right (yz). Intensity profiles of the indicated emission wavelengths are shown. k, Violin plot showing the distance of intimal neutrophils to macrophages (CD68+) (n = 148 cells) and SMCs (SMA+) (n = 171 cells). The median is represented by the horizontal line within the white box, and the boundaries of the box indicate the interquartile range. Two-sided unpaired t-tests were used unless otherwise stated; *P < 0.05; **P < 0.01; ***P < 0.001. Data are mean ± s.d.
Fig. 2 |
Fig. 2 |. Activated smooth muscle cells trigger NETosis promoting atherosclerotic plaque vulnerability.
a, Tracks (left) and speed (right) of neutrophil migration towards the supernatant of PDGF-BB-activated SMCs. n = 20 ctrl; n = 19 PDGF-BB neutrophils. *P = 0.00001. b, Number of adherent neutrophils to SMCs (Ly6G, green; n = 39 ctrl, n = 35 PDGF-BB) and their CD62L polarization frequency (red; n = 26 ctrl, n = 28 PDGF-BB). Scale bar, 50 μm. *P = 0.0002; **P = 0.009. c, Reactive oxygen species (ROS) production (left, n = 9 ctrl; n = 10 PDGF-BB) and NET release (right, n = 22 ctrl; n = 25 PDGF-BB) of neutrophils exposed to supernatants of resting (ctrl) or PDGF-BB-activated SMCs. *P = 0.004; **P = 0.008. d, CCL2 and CCL7 levels in supernatants from PDGF-BB-activated SMCs. n = 10. Two-sided paired t-test. e, NET release by VCAM-1-bound neutrophils treated with vehicle, CCL2 or CCL7, compared to non-coated control. n = 10 fields. One-way ANOVA with Holm-Sidak correction. f, Pearson correlation between NETs and intimal CCL7 in advanced atherosclerotic lesions in mice. n = 28 sections. g, Apoe−/− mice with advanced atherosclerotic lesions were treated with anti-CCL7 or isotype IgG and lesional NETs were quantified. Representative micrographs are shown. Ly6G, magenta; citrullinated histone H3, green; DNA (DAPI), blue. Dashed line delineates intima. Scale bar, 100 μm. n = 44 sections IgG; n = 27 sections anti-CCL7. h, i, Percentage of NETing neutrophils present in the indicated compartments of mouse (h) or human (i) atherosclerotic lesions. n = 33 sections in h and n = 13 core and n = 16 cap in i. j, k, Pearson correlation between NETs and SMC (SMA+) area in mouse (j, n = 57 mice) and human (k, n = 38 sections) atherosclerotic lesions. l–n, Advanced lesions were generated by insertion of a shear stress modifier around the carotid artery. Pharmacologic (Cl-amidine, Cl-a, during last 4 weeks, n = 9 mice) or genetic (Apoe−/−Pad4−/−, n = 8 mice) inhibition of NET release and respective controls (PBS treatment, n = 8 mice, or Apoe−/− Pad4+/+, n = 6 mice). Representative immunostaining images (l) show SMC (SMA, red) and nuclei (DAPI, blue). The dotted line delineates SMCs from the necrotic core, the dashed line outlines the lumen. Scale bar, 50 μm. Quantification of SMC area (SMA+, m) and vulnerable plaque index (n). Tested against respective control. *P < 0.05. All data are presented as mean (red line) ± s.d. L, lumen; NC, necrotic core; SPN, supernatant. Dotted lines in f, j and k represent 95% confidence interval. Two-sided unpaired t-test; n indicates biological samples unless otherwise stated.
Fig. 3 |
Fig. 3 |. NET-derived histone H4 induces SMC lysis and exacerbates plaque instability.
a, SMCs were treated with NETs pre-incubated with antibodies to histone isoforms and cell death was measured as propidium iodide positive (PI+) cells. n = 57 IgG; n = 58 anti-H2A; n = 59 anti-H3; n = 58 anti-H4 fields. One-way ANOVA with Tukey’s correction; *P = 0.014; **P = 0.007. Where indicated, NETs were treated with DNase before incubation with indicated antibodies. n = 24 fields. Two-sided unpaired t-test; *P = 0.044; **P = 0.007. b, Histone H4-induced SMC death quantified by PI uptake. n = 24 fields. Two-sided unpaired t-test, *P = 1.27 × 10⁻⁹. c, Pearson correlation between extranuclear histone H4 and neutrophils in intimas. n = 20 mice. Dotted line represents 95% confidence interval. df, Apoe−/− mice with advanced lesions were treated with isotype IgG (n = 14 mice) or anti-histone H4 (n = 15 mice) during the last 4 weeks of the experiment. d, Representative immunostaining for SMCs (SMA, red) and nuclei (DAPI, blue). The dotted line delineates SMCs from the necrotic core, the dashed line outlines the lumen. Scale bar, 50 μm. e, f, Quantification of SMC area (SMA+, e) and plaque vulnerability (f). Two-sided unpaired t-test. *P = 0.0009. g, h, Time-lapse microscopy of SMCs treated with histone H4 showing PI entry and calcein dispersion. g, Representative micrographs. Scale bar, 10 μm. h, Quantification over time. n = 15 cells. i, Time-lapse two-photon microscopy of whole-mount lesions stained with calcein (green) and anti-CD31 (blue) recorded in the presence of PI and histone H4. Scale bar, 100 μm. j, k, Visualization of cell membrane (lectin, white), histone H4 (magenta) and DNA (DAPI, cyan) in a SMC (S) and neutrophil co-culture (j) or in SMCs treated with recombinant histone H4 (k). White arrows indicate NET-derived histone H4 SMC plasma membrane interactions. l, SMCs treated with recombinant histone H4 were labelled with sulfo-NHS-SS-biotin. Western blot of non-purified lysates (SMCs) and plasma membrane fractions (SMCs avidin-purified) with indicated antibodies (for gel source data, see Supplementary Fig. 1). Data are mean ± s.d.
Fig. 4 |
Fig. 4 |. Membrane-pore-forming activity of histone H4.
a, Atomic force microscopy images of reconstituted membrane lipid bilayers incubated with recombinant histone H4. Scale bar, 1 μm. b, Live scanning ion conductance microscopy of SMCs. Images represent the plasma membrane before (top) and after (bottom) incubation with histone H4. c, Small angle X-ray scattering data demonstrate that the N-terminal domain of histone H4 induces negative Gaussian curvature (NGC) in small unilamellar vesicles, with membrane compositions as indicated at increasing peptide:lipid ratios. The peptide induced Pn3m cubic phases, which are rich in NGC, and are indicative of membrane permeation. The plot shows the absolute value of NGC induced by histone H4 N terminus as a function of the protein:lipid charge ratio. Chol, cholesterol; DOPE, 1,2-dioleoyl-sn-glycero-3-phosphoethanolamine; DOPS, 1,2-dioleoyl-sn-glycero-3-phospho-l-serine.
Fig. 5 |
Fig. 5 |. Therapeutic disruption of the histone H4-plasma membrane interaction stabilizes atherosclerotic lesions.
a, Molecular dynamics simulations of the interaction between histone H4 (magenta) and the plasma membrane. The N-terminal domain of histone H4 (cyan) exhibits membrane activity (left). Histone inhibitory peptide (HIPe, green) binds to the N terminus of histone H4 (middle) and disrupts the interaction with the cell membrane (right). bd, Hypercholesterolemic mice with established atherosclerotic lesions were implanted with osmotic minipumps delivering vehicle or HIPe for the last four weeks of the experiment. b, Representative immunostaining images for SMC (SMA, red) and nuclei (DAPI, blue) of atherosclerotic lesions. The dotted line delineates SMCs from the necrotic core, the dashed line outlines the lumen. Scale bar, 50 μm. c, d, Quantification of SMC area (SMA+, c) and overall lesion vulnerability (d). Two-sided unpaired t-test, n = 12 mice (vehicle) or n = 11 mice (HIPe).

Comment in

References

    1. Kolb JP, Oguin TH III, Oberst A & Martinez J Programmed cell death and inflammation: winter is coming. Trends Immunol. 38, 705–718 (2017). - PMC - PubMed
    1. Tabas I Macrophage death and defective inflammation resolution in atherosclerosis. Nat. Rev. Immunol 10, 36–46 (2010). - PMC - PubMed
    1. Clarke MCH et al. Apoptosis of vascular smooth muscle cells induces features of plaque vulnerability in atherosclerosis. Nat. Med 12, 1075–1080 (2006). - PubMed
    1. Hartwig H et al. Atherosclerotic plaque destabilization in mice: a comparative study. PLoS ONE 10, e0141019 (2015). - PMC - PubMed
    1. Silvestre-Roig C et al. Atherosclerotic plaque destabilization: mechanisms, models, and therapeutic strategies. Circ. Res 114, 214–226 (2014). - PubMed

Publication types

LinkOut - more resources