. 2019 May;569(7757):581-585.
doi: 10.1038/s41586-019-1160-0. Epub 2019 May 1.

A vitamin-C-derived DNA modification catalysed by an algal TET homologue

Affiliations

A vitamin-C-derived DNA modification catalysed by an algal TET homologue

Jian-Huang Xue et al. Nature. 2019 May.

Abstract

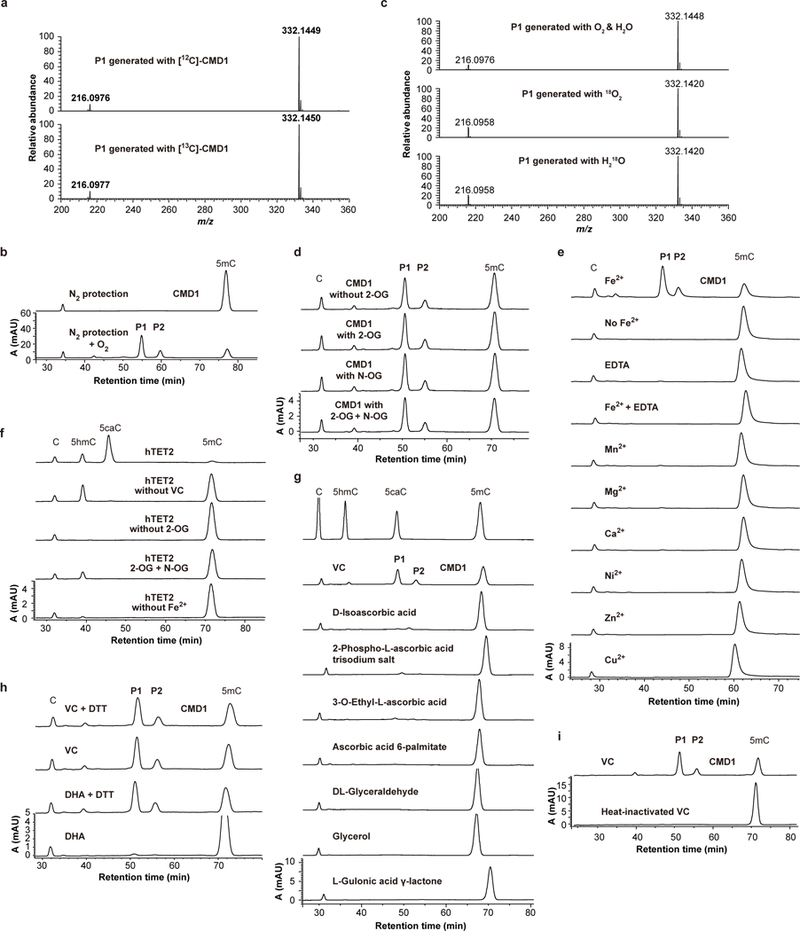
Methylation of cytosine to 5-methylcytosine (5mC) is a prevalent DNA modification found in many organisms. Sequential oxidation of 5mC by ten-eleven translocation (TET) dioxygenases results in a cascade of additional epigenetic marks and promotes demethylation of DNA in mammals1,2. However, the enzymatic activity and function of TET homologues in other eukaryotes remains largely unexplored. Here we show that the green alga Chlamydomonas reinhardtii contains a 5mC-modifying enzyme (CMD1) that is a TET homologue and catalyses the conjugation of a glyceryl moiety to the methyl group of 5mC through a carbon-carbon bond, resulting in two stereoisomeric nucleobase products. The catalytic activity of CMD1 requires Fe(II) and the integrity of its binding motif His-X-Asp, which is conserved in Fe-dependent dioxygenases3. However, unlike previously described TET enzymes, which use 2-oxoglutarate as a co-substrate4, CMD1 uses L-ascorbic acid (vitamin C) as an essential co-substrate. Vitamin C donates the glyceryl moiety to 5mC with concurrent formation of glyoxylic acid and CO2. The vitamin-C-derived DNA modification is present in the genome of wild-type C. reinhardtii but at a substantially lower level in a CMD1 mutant strain. The fitness of CMD1 mutant cells during exposure to high light levels is reduced. LHCSR3, a gene that is critical for the protection of C. reinhardtii from photo-oxidative damage under high light conditions, is hypermethylated and downregulated in CMD1 mutant cells compared to wild-type cells, causing a reduced capacity for photoprotective non-photochemical quenching. Our study thus identifies a eukaryotic DNA base modification that is catalysed by a divergent TET homologue and unexpectedly derived from vitamin C, and describes its role as a potential epigenetic mark that may counteract DNA methylation in the regulation of photosynthesis.


Figures

Extended Data Figure 1.
Extended Data Figure 1.. Alignment of TET homologs in C. reinhardtii with Naegleria Tet1.
Eight TET-like proteins were found using the TET-JBP domain as query for BLAST search in the Phytozome database of C. reinhardtii. These proteins have a conserved HxD motif as observed in the TET proteins from mammals and Naegleria. The symbols above the sequence denote the functional residues in Naegleria’s NgTet1 determined by structural and biochemical analyses. ‘m’ stands for metal (iron) binding site; ‘C’ for 5mC interaction; ‘a’ for the active center; ‘α’ stands for the 2-OG binding site, which is not conserved in CrTET1 (CMD1). The gene names for the CrTET in the Phytozome database are as follows: CrTET1: Cre12.g553400, CrTET2: Cre16.g654100, CrTET3: Cre02.g081150, CrTET4: Cre02.g141466, CrTET5: Cre17.g734757, CrTET6: Cre15.g643388, CrTET7: Cre02.g142867, CrTET8: Cre15.g642800.
Extended Data Figure 2.
Extended Data Figure 2.. Purification of recombinant CMD1 and determination of DNA substrate specificity.
a, Coomassie blue staining of the untagged full-length CMD1 protein purified from E. coli. An image for fractions collected from gel filtration chromatography column (eluted between 14–17 min, 1 ml/min) is shown. Representative image is shown from at least three independent experiments. b, Coomassie blue staining of the purified wild-type or mutant CMD1 proteins. H345 and D347 correspond to the conserved residues of the iron-binding sites based on the sequence alignment of TET homologs; A330 is predicted to be in the active site required for CMD1 enzymatic activity; D350 might be involved in 5mC interaction. Representative image is shown from two independent experiments. For source data in panels a-b, see supplementary Figure 1. c, CMD1 mutants had no or significantly reduced activity to convert 5mC into P1 and P2. Data shown are representative of two independent experiments. d, P1 and P2 nucleosides accumulate over a period of 2 h upon incubation of the 5mC-DNA substrate with CMD1 shown by HPLC analysis of nucleosides in DNA samples collected at the indicated time points. Data shown are representative of two independent experiments. e, Time-course of the relative amounts of 5mC, P1 and P2 during incubation of 5mC-DNA with CMD1. The amount was determined based on the peak area of each nucleoside in HPLC analysis in panel d. Data shown are representative of two independent experiments. f, 5mC-, but not C- or 5hmC-containing DNA, serves as a substrate for CMD1. DNA substrates containing C, 5hmC or 5mC were prepared by PCR, incubated with CMD1, and then subjected to nucleoside composition analysis using HPLC. Note that P1 and P2 nucleosides only appear in 5mC-DNA upon incubation with WT CMD1. Mut CMD1 is an inactive mutant carrying point mutations (H345Y/D347A). Data shown are representative of two independent experiments.
Extended Data Figure 3.
Extended Data Figure 3.. Deuterium tracing of the methyl group in 5mC-DNA.
a-b, Tandem mass spectrometry analysis of the HPLC fractions corresponding to the minor side products generated in the CMD1 reaction and comparison with authentic 5hmC (a) and 5caC (b) standards (refer to Fig. 1a. Also see the reaction mechanism we proposed in Extended Data Fig. 7c for further discussion on the origin of 5hmC and 5caC). Data shown are representative of two independent experiments. c, MS detection of 5mC nucleoside in a DNA substrate methylated in vitro with M.SssI using D3-labeled S-adenosyl-L-methionine ([methyl-D3]-SAM). The mass of 5mC increases by 3 units when [methyl-D3]-SAM was used. Data shown are representative of two independent experiments. d, Identification of P1/P2 bases based on the masses of molecules and fragmentation products from tandem mass spectrometry. P1 and P2 produce identical collision-induced-dissociation (CID) fragments, suggesting that they are stereoisomers. Shown are the most abundant fragments generated by CID of P1/P2. Molecular formulae were deduced from the molecular masses. Since all the fragment ions of P1/P2 generating from the D3-labeled 5mC are 2 Daltons larger than those from unlabeled 5mC, the new modification most likely occurs at the methyl group; the bridging methylene linked to the pyrimidine ring seems unaltered in CID. P1/P2 appeared to lose three H2O (MW 18.0100) in CID consecutively, indicating the presence of three hydroxyl groups in the P1 and P2 structures. Data shown are representative of two independent experiments.
Extended Data Figure 4.
Extended Data Figure 4.. NMR signal assignments support P1 identity as 5-(1-[2,3,4-trihydroxybutyl])-2’-deoxycytidine.
a, 1H NMR spectrum of P1 with signal assignments. The spectrum shows all the non-exchangeable proton signals with their chemical shifts J-coupling constants for P1 (Extended Data Table 1). b, 1H-1H 2D COSY spectrum for P1 with assignments. The sequential positions of protons showed in two spin-coupling systems as δH 6.299–2.320/3.437–4.455–4.062–3.773/3.860 in a deoxyribosyl moiety and δH 3.813/3.664–3.615–3.811–2.793/2.505. c, 1H-1H 2D TOCSY spectrum for P1 with assignments. Three coupling systems were observed in this TOCSY spectrum. The first coupling system showed a typical signal pattern for a deoxyriboside moiety here with seven protons at δH 6.299 (1H, t, H1’), 4.455 (1H, m, H3’), 4.062 (1H, m, H4’), 3.860 (1H, dd, H5’b), 3.773 (1H, dd, H5’a), 2.437 (1H, ddd, H2’b) and 2.320 (1H, dt, H2’a). The second one was observed for six protons at δH 3.813 (1H, H10b), 3.811 (1H, ddd, H8), 3.664 (1H, dd, H10a), 3.615 (1H, ddd, H9), 2.793 (1H, ddd, H7b) and 2.505 (1H, ddd, H7a) and 2.320 (1H, dt, H2’a). A third coupling system was observed as a weak correlation between δH 7.759 (1H, t, H6) and a CH2 moiety (H7a and H7b, δH 2.793, 2.505). d, 1H-1H JRES spectrum for P1. It shows J-coupling patterns from all protons (Extended Data Table 1). The F1 dimension gives coupling constants (Hz) while the F2 dimension gives chemical shift information. e, 1H-13C 2D HSQC spectrum for P1 with assignments. The direct H-C linkages were detected by the one-bond 1H-13C correlations in this HSQC spectrum. f, 1H-13C 2D HMBC spectrum for P1 with assignments. The long-rang 1H-13C correlations were detected in the HMBC spectrum. The proton at δH 7.759 showed long-range correlations with C2, C4, C5 (δC 159.98, 168.53, 107.64, respectively) of a cytosine residue, with C7 of the trihydroxybutyl moiety (THB) (δC 33.64), and with the deoxyribosyl C1’ (δC 88.95). This indicated that C7 (CH2) of the THB moiety was attached to C6 of a cytosine ring. Such is further confirmed with long-range correlations between H7 (δH 2.793, 2.505) and C4, C5, C6, C8, C9 (δC 168.53, 107.64, 143.83, 72.56, 76.94). The long correlations between H1’ (δH 6.299) and C2, C6 (δC 168.53, 143.83) in HMBC spectrum further confirmed the N1-C1’ linkage between the deoxyribosyl and cytosine moieties. Taking all above into consideration, P1 was finally determined as 5-(1-[2,3,4-trihydroxybutyl])-2’-deoxycytidine shown in Fig. 2c with its 1H and 13C signals unambiguously assigned and tabulated in Extended Data Table 1. In panels a-f, representative results are shown from two independent experiments.
Extended Data Figure 5.
Extended Data Figure 5.. P2 is determined as a stereoisomer of P1.
a, 1H NMR spectrum for P2 with signal assignments. b, 1H-1H COSY spectrum for P2 with assignments. c, 1H-1H TOCSY spectrum for P2 with assignments. d, 1H-1H JRES spectrum for P2. e, 1H-13C HSQC spectrum for P2 with assignments. f, 1H-13C HMBC spectrum for P2 with assignments. In the same manner, the structure of P2 (Fig. 2c) was determined as 5-(1-[2, 3, 4-trihydroxybutyl])-2’-deoxycytidine using 1H NMR spectrum and a series of 2D NMR spectra indicating P2 as a stereoisomer of P1. Unlike P1, there were stronger coupling relationships among H8, H9, H10a and H10b and this showed more complicated splitting of peaks in P2. Therefore, accurate chemical shifts and coupling constants were simulated with NMR-Sim5.4 in order to achieve the maximum similarity with experimental data (Extended Data Table 1). In panels a-f, representative results are shown from two independent experiments.
Extended Data Figure 6.
Extended Data Figure 6.. Comparison of co-factor requirements of CMD1 and hTET2.
a, The 90-Dalton modification on 5mC does not originate from CMD1 or co-purified small compounds. The CMD1 protein was purified from E. coli grown in M9 medium with 12C or 13C-labeled glucose as the only carbon source. The lack of mass increase in P1 generated with the 13C-CMD1 preparation suggests that the P1 modification is derived from a reaction component rather than a compound co-purified with the CMD1 enzyme. Data shown are representative of two independent experiments. b, O2 is indispensable for CMD1 activity. P1 and P2 were not detectable unless O2 was bubbled into the reaction mixture that was incubated under an N2 atmosphere in a glove box. Data shown are representative of two independent experiments. c, Mass analysis of P1 nucleoside from reactions using 18O-labeled oxygen or water. The mass of P1 nucleoside remained unaltered compared to that of P1 obtained from the reaction using unlabeled oxygen or water. Data shown are representative of two independent experiments. d, 2-OG is not required for CMD1. Reactions were performed under indicated conditions and HPLC was used to analyze the nucleosides of DNA products. N-oxalylglycine (N-OG), an analog of 2-OG, does not inhibit the activity of CMD1. Data shown are representative of two independent experiments. e, Fe2+ is indispensable for CMD1 activity. Reactions were performed in the presence of indicated metal ions or EDTA. Data shown are representative of two independent experiments. f, 2-OG and Fe2+, but not VC, are required for the activity of hTET2. Reactions were performed under indicated conditions. N-OG inhibits the activity of hTET2. Data shown are representative of two independent experiments. g, Analogs of VC do not support CMD1 activity. Data shown are representative of at least three independent experiments. h, Dehydroascorbic acid (DHA), an oxidized form of VC, supports the CMD1 activity only upon its reduction into VC by DTT. The conversion of DHA into VC by DTT treatment was confirmed by MS analysis (not shown). Data shown are representative of at least three independent experiments. i, Heat-inactivated VC (100ºC overnight) does not support the CMD1 activity. Data shown are representative of two independent experiments.
Extended Data Figure 7.
Extended Data Figure 7.. Characterization of reaction mechanism of CMD1.
a, Mass analysis of P1 nucleoside from reactions using various 13C-labeled VC co-substrates. The use of [13C6]-VC led to a 3-Dalton increase of P1 mass, while no mass change was detected when [1-13C]-VC or [3-13C]-VC was used. This indicated that the glyceryl moiety was from C4-C6 of VC. Data shown are representative of two independent experiments. b, Mass determination of the most abundant fragment ions generated by CID of P1. Arch arrows denote the relationship of ions featuring the loss of 13C carbons (upper three panels) and loss of 12C carbons (bottom panel). The mass corresponding to the fragments containing 13C atoms are indicated in red. These data indicate that [6-13C] of VC ends up in the distal carbon of the side chain of P1 (C10 in Fig. 2c), and 13C from [5-13C]-VC ends up in C9. Data shown are representative of two independent experiments. c, Proposed mechanism of CMD1 catalysis. The catalysis starts with the coordination of Fe(II) to the conserved 2-His-1-carboxylate triad of the enzyme, leaving three sites on the metal that are occupied by water molecules (A). Deprotonated VC displaces two bound water molecules and coordinates to Fe(II) with its C-1 carbonyl group and C-2 alkoxide (B). Hydrolysis of the bound VC yields the ring opened intermediate (C), which then tautomerizes to the α-keto form (D). The remaining bound water molecule leaves when 5mC binds to the active site (E). The binding of O2 to the iron center generates an Fe(III)-superoxo intermediate (F). The nucleophilic attack of the distal oxygen onto C-2 of 2-keto-L-gulonate yields a Fe(IV)-peroxo species (G). This species initiates an oxidative decarboxylation of VC to produce a Fe(IV)-oxo species, which is coordinated with the C-1 carboxylate of the resulting L-xylonic acid (H). The Fe(IV)-oxo species abstracts a hydrogen atom from 5mC to generate Fe(III)-hydroxide species and a 5mC radical (I). The C-2 hydroxyl group of the coordinated L-xylonic acid binds to the Fe(III) center with a loss of a bound water molecule (J). Homolysis of the C2-C3 bond of the coordinated L-xylonic acid and non-stereoselective attack of the 5mC radical lead to the formation of the product nucleobases P1 and P2 and Fe(II) bound glyoxylic acid (K). Eventually, glyoxylate dissociates from the iron center to complete the catalytic cycle. The side reaction generating 5hmC can be explained based on this reaction mechanism. Namely, the 5mC radical combines with a hydroxide group linked to Fe(III) (intermediate I), in a manner similar to reactions catalyzed by TET dioxygenases. Notably, however, the generation of trace amount of 5hmC is not dependent on 2-OG (see Fig 3a, and Extended Data Fig 6d), confirming that a different mechanism is at play. d, GC-MS analysis of the co-product CO2 from CMD1-catalyzed reactions using 13C-labeled VC. The reactions were carried out in airtight vials and directly subjected to GC-MS analysis. The carbon atom of CO2 is shown to come from the C1 of VC. Data shown are representative of two independent experiments. e, Mass spectrometry analysis of the co-product glyoxylic acid upon DNP derivatization. As the C4-C6 and C-1 of VC were transferred into base P and CO2 respectively, the remaining two carbons of VC were converted into glyoxylic acid. This is in close agreement with the mass increases of the glyoxylic acid derivatives when using uniformly-labeled (13C6) and singly (3-13C) labeled VC. The arrow indicates the peak of the DNP conjugate in the LC profiles. Data shown are representative of two independent experiments.
Extended Data Figure 8.
Extended Data Figure 8.. Generation of a cmd1 strain using a CRISPR/Cas9-based co-selection strategy and co-segregation of the high light-sensitive phenotype with the CMD1 mutation.
a, The conversion of indole to tryptophan is catalyzed by the tryptophan (Trp) synthase β subunit encoded by the endogenous MAA7 gene in C. reinhardtii. When 5-fluoroindole (5-FI) is used in place of indole, it will be converted into 5-fluorotryptophan, which is lethally toxic to cells. b, The CRISPR/Cas9-mediated co-selection strategy to introduce mutation in C. reinhardtii. Recombinant Cas9 protein purified from E. coli was assembled with single guide RNA (sgRNA) for both the MAA7 gene and a target gene of interest to form RNP complexes. Upon electroporation of the mixture of the two RNP complexes into cells, 5-FI resistant colonies were selected and genotyped to identify clones with a desired mutation in the targeted gene. The mutant strains were then backcrossed with the wild-type strain to segregate the target gene mutation from the MAA7 mutation or other off-target mutations if any. c, The genomic loci of CMD1 (also known as CrTET1) and its close paralog CrTET2. At the CMD1 locus of cmd1 cells, there is an insertion of 245 bp in the exon 3, thus generating a frame-shift mutation. Chromosome locations of the two paralogs are indicated on the top. DNA sequences from the targeted loci in wild-type and cmd1 strains are shown on the bottom. The 3-nt PAM and 20-nt sgRNA-binding sequences are distinctively colored. d, Genomic PCR genotyping of the cmd1 strain using two primer pairs as shown in panel c. Sizes expected for the PCR products are indicated. Note that the forward primer of primer pair 1 (panel c) can binds to both the CMD1 and CrTET2 genomic loci. The forward primer of primer pair 2 is specific for a site upstream of CMD1. Representative image is shown from at least three independent experiments. e, Southern blot analysis of the CMD1 genomic locus. The locations of the probe (dark blue bar) and the SalI and NheI restriction sites used for the digestion of the genomic DNA are indicated in panel c. Two bands detected in the lane of the cmd1 DNA sample arose from the mutant CMD1 locus with a 245-bp insert and the unaltered CrTET2 paralogous locus of almost identical sequence, respectively. Expected lengths of the detected restriction fragments are given in the brackets. Representative image is shown from two independent experiments. f, RT-PCR analysis of the region spanning the targeted site of exon 3. The expected lengths of PCR products from the wild-type and cmd1 cells are given in the brackets. Representative image is shown from two independent experiments. g, Co-segregation analysis of the CMD1 mutation in the progeny of a cross between wild-type CC124 with the cmd1 strain. Equal amounts of the cells were dripped on agar plates and exposed to low light (20 μmol photons·m−2·s−1) or high light (1000 μmol photons·m−2·s−1) for 66 h. A1 and A2 are the cmd1 and wild-type CC124 cells respectively. Red circles mark the clones of the parental cmd1 strain and the progeny lines, of which the growth was inhibited under high light. 48 progeny clones were tested and 14 of them were shown here representatively. Shown at the right is the result of algal colony PCR for genotyping of the progeny clones. Primer pair 2 shown in panel c was used. For source data in panels d-g, see Supplementary Figure 1.
Extended Data Figure 9.
Extended Data Figure 9.. Role of vitamin C in the regulation of LHCSR3 expression and NPQ.
a, Generation of vtc2 mutant strains. Shown are the genomic structure of the VTC2 gene and the sequences flanking the Cas9 cleavage site (downward arrows) in wild-type (WT) and mutant strains. An 83-nt donor oligonucleotide carrying a frame-shift mutation (insertion of an A) was co-electroporated into algal cells for homology directed repair (HDR) with VTC2 in CRISPR/Cas9-based co-selection procedure (Extended Data Fig. 8b). Out of 48 5-FI resistant MAA7 mutant clones obtained, 7 clones were identified to be vtc2 mutants by sequencing. Among them, 2 clones (#1–2) carried the desired insertion of an A, apparently derived from HDR-mediated editing and the other 5 clones (#3–7) carried indels, arising from non-homologous end joining. In the wild-type gene sequence, the 20-nt sgRNA-binding and 3-nt PAM sequences are distinctively colored. b, Cellular VC content in WT, vtc2 and cmd1 mutant strains determined by LC-MS. The cells were cultured in TAP medium under continuous illumination of 50 μmol photons·m−2·s−1. Data presented are mean ± S.E. of two independent biological replicates with individual data shown as dots. c, Methylation analysis of the genomic locus 5’ of the LHCSR3.1 gene in wild-type and vtc2 strains after exposure to high light (300 μmol photons·m−2·s−1). The open and black circles represent unmethylated and methylated CpG sites respectively. Representative results are shown from two independent experiments. d, Determination of the mRNA expression of LHCSR3.1 and LHCSR3.2 in WT and vtc2 strains after exposure to high light (300 μmol photons·m−2·s−1). The expression levels of LHCSR3.1 and LHCSR3.2 were first normalized to the expression of a house keeping gene GBLP, and the resulted values were then compared to those of WT samples, which were set to 1.0. Data presented are mean ± S.E. of two independent biological replicates with individual data shown as dots. e, NPQ induction kinetics of WT and mutant strains. Cells were grown under the light intensity of 180 μmol photons·m−2·s−1 for 24 h. NPQ was then recorded upon illumination with 600 μmol photons·m−2·s−1 for 5 min (white bar) followed by 2.5 min in darkness (black bar). Data are represented as mean ± S.E. by five independent biological replicates. f, VTC2 mRNA expression in WT and cmd1 strains after exposure to high light (300 μmol photons·m−2·s−1). Real-time RT-PCR analysis was used for quantification. The expression levels of VTC2 were first normalized to the expression of a house keeping gene GBLP, and then the resulted values were compared to that of WT sample, which was set to 1.0. Data presented are mean ± S.E. of four independent biological replicates with individual data shown as dots.
Extended Data Figure 10.
Extended Data Figure 10.. Functional analyses of the VC-derived modification in C. reinhardtii.
a, Quantification of 5gmC and 5mC nucleosides in genomic DNA from wild-type CC125 strain treated with 400 μM 5-aza-2′-deoxycytidine (5-aza). Data are represented as mean ± S.E. from three independent biological replicates which are shown as dots. Two-tailed Student’s t-test was used without adjustment for multiple comparisons. b, Determination of ETR of WT and cmd1 cells with Dual-PAM-100. Cells were prepared as in the experiment of NPQ induction presented in Fig. 4c. Data are represented as mean ± S.E. from three independent biological replicates. c, Expression levels of photosynthesis-related genes in cmd1 cells determined by RNA-seq analysis. Cells were grown under high light (300 μmol photons·m−2·s−1). Expression levels are relative to wild-type (WT) which is set as 1.0. d, Volcano plot showing the differentially expressed genes (DEGs) of cmd1 cells versus WT cells. n=3. The analysis was based on edgeR’s quasi-likelihood F-test which is a two-sided test without adjustment for multiple comparisons. e, Gene ontology analysis of DEGs in cmd1 cells. n=3. Functional enrichment was based on one-sided Fisher’s exact test and the top significant GO terms were selected without adjustment for multiple comparisons. f, Nucleotide contexts enriched in differential methylated cytosines in cmd1 cells compared to the WT. g, Genomic feature distribution of differentially methylated regions (DMRs) in cmd1 mutant cells compared to the wild-type. DMRs were filtered by the length (at least 400 bp) and the methylation ratio difference between WT and cmd1 cells (at least 20% methylation changes). The DMRs were annotated and analyzed for feature distribution. h, DNA methylation frequency distribution in wild-type and cmd1 mutant cells. The cytosines were categorized in ten intervals based on their methylation levels and their numbers in each interval were counted. i, 5mC abundance at genes of low and high expression in wild-type cells. 5mC exhibits a slightly higher abundance in the lower expressed genes. All genes were divided into the low 50% and high 50% expression categories. Methylation at −2 to 0 kb upstream of TSS was analyzed. n=2. The two-sided Wilcoxon signed-rank test was used without adjustment for multiple comparisons. j, Comparison of the expression of hypermethylated and hypomethylated genes in cmd1 cells comparing to WT cells. Hypermethylated genes show a reduced expression level. Methylation at −2 to 0 kb upstream of TSS was analyzed. n=2. Two group of genes were chosen by controlling false discovery rate to be 0.001 after adjustment for multiple comparisons. The two-sided Wilcoxon signed-rank test was used. In box plots in panel i and j, the outer edges of the box represents the first and third quartiles, and the midline indicates the median. The top or bottom line indicates the maximum or minimum value within the 1.5-fold of the interquartile range. k, Gene ontology of differentially methylated genes at the promoter region in cmd1 cells. n=2. Two-sided Fisher’s exact test was used without adjustments for multiple comparisons. l, Methylation pattern at the genomic locus of LHCSR3.1 in WT and cmd1 mutant cells. Vertical bars indicate the methylation level at individual CpG dyads. The grey-shaded area indicates the region analyzed in Fig. 4f. Representative image is shown from two independent experiments.
Extended Data Figure 11.
Extended Data Figure 11.. CMD1 regulates LHCSR3 expression by promoting DNA demethylation through 5gmC generation.
a, Schematics of the CMD1 and LHCSR3 transgene expression constructs used in complementation of the cmd1 strain. The paromomycin resistance marker (AphVIII) was used for selection of transgenic clones. The HSP70A/RBCS2 fusion promoter (HSRB) drives transgene expression. HA epitope added to the C-terminus of CMD1 allows for detection of the fusion protein. b, Western blot analysis for the CMD1-HA protein expressed in WT, cmd1 and cmd1 strains complemented with wild-type CMD1-HA (WT-1 and −2) or mutant CMD1-HA (HD-1 and −2) as indicated on the top. Anti-HA antibody was used for the detection. Detection with anti-α-tubulin provided a sample processing control. WT and cmd1 lines without the CMD1-HA transgene served as negative controls. Representative results are shown from two independent experiments. c, Western analysis of the LHCSR3 protein in WT, cmd1 and cmd1 lines complemented with CMD1-HA or with LHCSR3 as indicated on the top. Detection with anti-α-tubulin provided a sample processing control. Representative results are shown from two independent experiments. For source data in panels b-c, see Supplementary Figure 1. d, Erlenmeyer flasks containing different cells as indicated growing photoautotrophically after 16 h of exposure to high light (750 μmol photons·m−2·s−1). Shown are representative photographs from three independent experiments. e. Determination of the effect of 5mC and 5gmC on transcription in C. reinhardtii using a luciferase reporter assay. The luciferase reporter driven by the promoter (either HSRB or LHCSR3) containing unmodified cytosine, 5mC or 5gmC respectively which were prepared by M.SssI treatment or further treated by CMD1 were transformed into C. reinhardtii. The cells were harvested at different time points for measuring the luciferase activity. The mock sample was transformed with an empty vector. The luciferase activity was normalized to the corresponding chlorophyll fluorescence and then compared to the value of the mock control which is set to 1. Data are represented as mean ± S.E. by two independent biological replicates which are shown as dots. f. Schematic diagram of TET-bisulfite (BS) sequencing analysis. In the conventional bisulfite sequencing, C, 5fC and 5caC but not 5mC or 5hmC are converted into U by bisulfite treatment, which is read as T in PCR and sequencing. However, 5gmC is read as C, which is thus indistinguishable from 5mC or 5hmC. By TET treatment, both 5mC and 5hmC are oxidized into 5caC, which is then read as T in subsequent bisulfite sequencing. Therefore, only 5gmC (orange lollipop) in the starting DNA sample is read as C (blank lollipop lower right) in TET-BS sequencing. g, Establishment of TET-BS assay to distinguish 5gmC from all other forms. A lambda DNA fragment was used to test the feasibility of the assay. After methylation with M.SssI enzyme, all CpG sites are resistant to deamination and thus read as C in BS-seq. 5gmCs that only exist in the CMD1-treated 5mC-λDNA are detected as C because they are non-convertible in TET-BS treatment. Each circle represents a CpG site. Representative results are shown from two independent experiments. h, BS-seq and TET-BS-seq analysis of the HSRB promoter used in the luciferase assay. Upon nuclear transformation of the cytosine-modified DNA, a significant portion of 5gmC underwent a conversion to C (reduced from 84.2% to 70.8%) while the high 5mC level remained. Notably, individual 5gmCs at neighboring Cs on a same DNA template appear to behave differently. While the mechanism of conversion is not clear, 5gmC might be lost slowly over time through DNA repair or an alternative demethylation process. Representative results are shown from two independent experiments. i, ChIP analysis of the interaction of CMD1-HA with the 5’ genomic region of LHCSR3.1. The different regions of DNA fragments precipitated with anti-HA antibodies were amplified by qPCR. The region amplified by primer pair 3 (chromosome_8: 1947066–1947226) exhibits strongest interaction with CMD1-HA. The enrichment relative to IgG were normalized to that of cmd1 cells which was set as 1. Data are represented as mean ± S.E. by two independent biological replicates which are shown as dots.
Figure 1.
Figure 1.. CMD1 catalyzes novel DNA modifications of 5-methylcytosine.
a, HPLC analysis of nucleosides from 5mC-containing DNA treated with wild-type (WT) CMD1 or a mutant proposed to lack activity (Mut; H345Y/D347A). P1 and P2 denote unknown modified nucleosides. AU, absorption units. Data shown are representative of at least three independent experiments. b, TLC detection of the modified nucleotides. 5mC-DNA with a 14C-labeled methyl group was incubated with WT CMD1 and various mutants as indicated and hydrolyzed to nucleotides. P1/P2 indicate the new nucleotides detected on the autoradiogram. Markers were 32P-labeled nucleotides. Data shown are representative of two independent experiments. For source data, see Supplementary Figure 1.
Figure 2.
Figure 2.. Structural determination of the modified nucleosides P1 and P2.
a, Mass spectrometry analysis of the HPLC fractions P1 and P2. Fragment ion at m/z 216 indicates a base product formed after neutral loss of a deoxyribose residue (molecular weight 116) from the precursor 2’-deoxynucleoside (m/z 332). The chemical formulas of P1 and P2 nucleosides were deduced from their high-resolution mass spectra. Data shown are representative of at least three independent experiments. b, MS detection of P1 and P2 nucleoside generated from D3-labeled 5mC upon incubation with CMD1. The mass of resultant P1 and P2 increases by 2 units when the DNA substrate contains completely deuterated methyl groups in 5mC. Data shown are representative of two independent experiments. c, Structures of P1 and P2 determined by two-dimensional nuclear magnetic resonance spectroscopic analyses and DFT calculations. P1 and P2 are stereoisomers having different configurations at C8.
Figure 3.
Figure 3.. Vitamin C is required as a glyceryl donor in CMD1-catalyzed 5mC modification.
a, Dependence of CMD1 activity on VC to modify 5mC. Reactions were performed under indicated conditions for HPLC detection of P1 and P2 nucleosides. Data shown are representative of at least three independent experiments. b, Isotope tracing of P1 nucleoside using 13C-labeled VC. Reactions were performed using 12C- or 13C-VC and molecular weights of P1 nucleosides were measured with mass spectrometry. Data shown are representative of two independent experiments. c, The CMD1-catalyzed modification of 5mC in the presence of VC and O2. As a co-substrate in the reaction, VC provides a glyceryl moiety (highlighted in red), which is transferred onto the methyl group of 5mC to produce the P1 and P2 forms of 5gmC nucleotides in DNA. The wavy line linking a hydroxyl group to C8 in the base product denotes the presence of the two configurations identified for the stereoisomers P1 and P2 (Fig. 2c).
Figure 4.
Figure 4.. Identification of the VC-derived modification and its function in the regulation of photosynthesis in C. reinhardtii.
a, Quantification of 5gmC and 5mC in WT, cmd1 or vtc2 cells using triple-quadrupole tandem mass spectrometry. Data are represented as mean ± S.E. from three independent biological replicates. Individual replicates are shown as circles. b, Erlenmeyer flasks containing different cells growing photoautotrophically after 16 h of exposure to low or high light. Shown are representative photographs from three independent experiments. The npq4 strain is the double mutant of LHCSR3.1 and LHCSR3.2. c, NPQ induction of WT, cmd1, cmd1 expressing WT CMD1, the catalytically inactive mutant of CMD1 (CMD1-HD) or LHCSR3, and npq4 cells. Cells were grown photoautotrophically at 180 μmol photons·m−2·s−1 for 24 h and NPQ was recorded upon illumination with 600 μmol photons·m−2·s−1 for 5 min (white bar) followed by 2.5 min of darkness (black bar). Data shown are means ± S.E. of five independent biological replicates. d, Western blot analysis of the LHCSR3 accumulation after exposure to low (LL) or high light (HL). α-Tubulin was used as a sample processing control. Representative results are shown from three independent experiments. For source data, see Supplementary Figure 1. e, Quantitative analysis of LHCSR3.1 and LHCSR3.2 mRNA in WT and cmd1 cells after exposure to low or high light. The expression levels were first normalized to GBLP, then compared to those of WT under high light, which were set to 1.0. Data presented are mean ± S.E. of three independent biological replicates. Individual replicates are shown. f, Methylation analysis of the 5’ region of LHCSR3.1 in WT, cmd1 as well as the complemented strains. Cells were grown under high light. The open and black circles represent unmethylated and methylated CpG sites respectively. Representative results are shown from three independent experiments.

Comment in

References

    1. Pastor WA, Aravind L & Rao A TETonic shift: biological roles of TET proteins in DNA demethylation and transcription. Nat Rev Mol Cell Biol 14, 341–356, (2013). - PMC - PubMed
    1. Bochtler M, Kolano A & Xu GL DNA demethylation pathways: Additional players and regulators. Bioessays 39, 1–13, (2017). - PubMed
    1. Martinez S & Hausinger RP Catalytic Mechanisms of Fe(II)- and 2-Oxoglutarate-dependent Oxygenases. J Biol Chem 290, 20702–20711, (2015). - PMC - PubMed
    1. Walport LJ, Hopkinson RJ & Schofield CJ Mechanisms of human histone and nucleic acid demethylases. Curr Opin Chem Biol 16, 525–534, (2012). - PubMed
    1. Morales-Ruiz T et al. DEMETER and REPRESSOR OF SILENCING 1 encode 5-methylcytosine DNA glycosylases. Proceedings of the National Academy of Sciences of the United States of America 103, 6853–6858, (2006). - PMC - PubMed

Publication types