. 2019 Jul;23(7):4653-4665.
doi: 10.1111/jcmm.14216. Epub 2019 May 1.

Deletion of pancreatic β-cell adenosine kinase improves glucose homeostasis in young mice and ameliorates streptozotocin-induced hyperglycaemia

Affiliations

Deletion of pancreatic β-cell adenosine kinase improves glucose homeostasis in young mice and ameliorates streptozotocin-induced hyperglycaemia

Makawi Ahmed Abdalhamid Osman et al. J Cell Mol Med. 2019 Jul.

Abstract

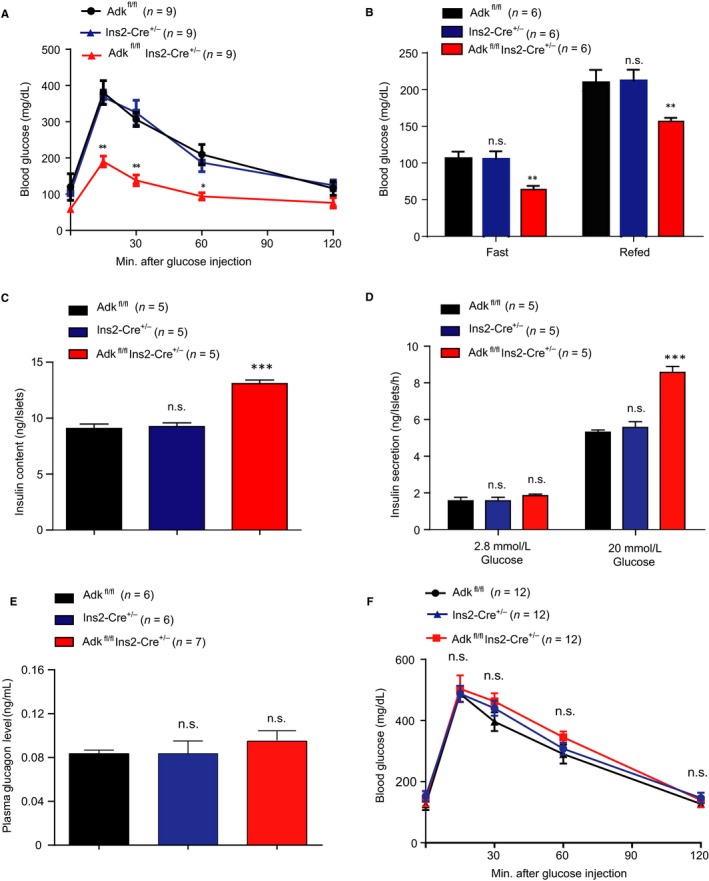
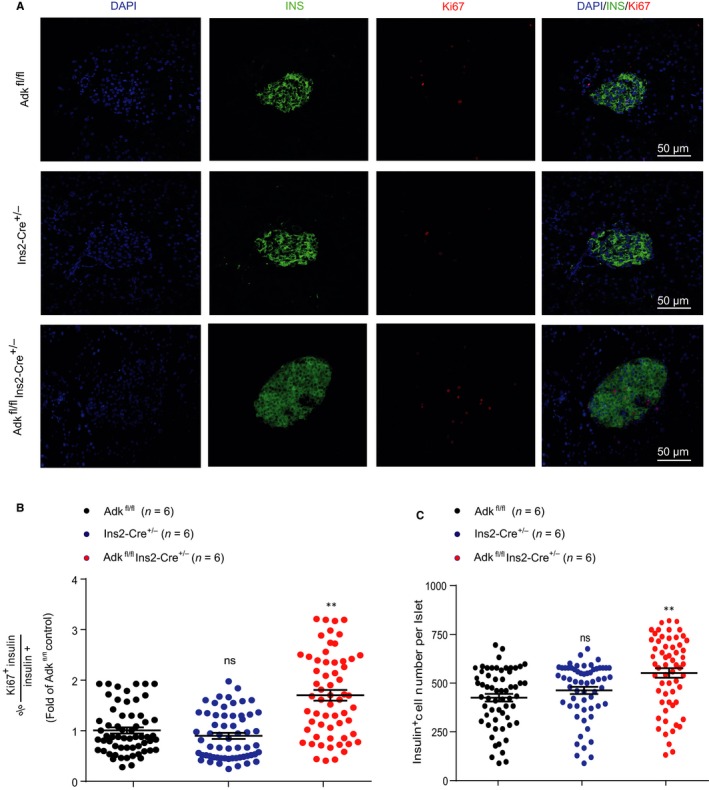
Severe reduction in the β-cell number (collectively known as the β-cell mass) contributes to the development of both type 1 and type 2 diabetes. Recent pharmacological studies have suggested that increased pancreatic β-cell proliferation could be due to specific inhibition of adenosine kinase (ADK). However, genetic evidence for the function of pancreatic β-cell ADK under physiological conditions or in a pathological context is still lacking. In this study, we crossed mice carrying LoxP-flanked Adk gene with Ins2-Cre mice to acquire pancreatic β -cell ADK deficiency (Ins2-Cre± Adkfl/fl ) mice. Our results revealed that Ins2-Cre+/- Adkfl/fl mice showed improved glucose metabolism and β-cell mass in younger mice, but showed normal activity in adult mice. Moreover, Ins2-Cre± Adkfl/fl mice were more resistant to streptozotocin (STZ) induced hyperglycaemia and pancreatic β-cell damage in adult mice. In conclusion, we found that ADK negatively regulates β-cell replication in young mice as well as under pathological conditions, such as STZ induced pancreatic β-cell damage. Our study provided genetic evidence that specific inhibition of pancreatic β-cell ADK has potential for anti-diabetic therapy.

Keywords: adenosine kinase; diabetes; insulin; replication; β cell.


Conflict of interest statement

No potential conflicts of interest regarding this work were reported.

Figures

Figure 1
Figure 1
Temporal expression of adenosine kinase (ADK) in pancreatic islets and ablation of ADK in pancreatic β cells. A, Schematic representation of insulin‐producing, cell–type‐specific Adk knockout male mice (Ins2‐Cre±; Adkfl/fl mice). The LoxP sequences were recognized by the Cre enzyme, the expression of which was driven by the insulin promoter (Ins2‐cre), thus cleaving exons 3‐7 of the Adk gene in Ins2‐cre; Adkfl/fl mice and generating an Adk knockout in insulin‐expressing cells. B, The mRNA levels of ADK, as determined by quantitative reverse transcription‐PCR (qRT‐PCR), were higher in 4‐wk‐old mice than in mice of different ages (1, 2, 8 and 12‐wk‐old; P‐value = 0.001) n = 4. (C,D) Western blotting results and quantitative data of ADK expression showed declined expression in 1, 2, 3‐wk‐old mice but higher expression in 4‐wk‐old mice and gradually declining expression from 8 wks of age (P‐value = 0.003; n = 4 mice per group). Representative Western blots from at least three independent experiments are shown. (E,F) Western blots and quantitative data for ADK protein levels in islets from 4‐wk‐old mice shown from three study groups (Adkfl/fl, Ins2‐Cre± and Ins2‐Cre±Adkfl/fl), n = 3 per group, representative Western blots from at least three independent experiments showed a significant reduction in the ADK protein expression level in Ins2‐Cre±Adkfl/fl mice compared with control group (P value ≤ 0.001). Note: *, #<0.05; **, ## P < 0.01; ***, ### P < 0.001 were considered significant; *comparison of either Ins2‐Cre± or Adkfl/fl to Ins2‐Cre±Adkfl/fl; #comparison between Ins2‐Cre± and Adkfl/fl
Figure 2
Figure 2
Ablation of adenosine kinase (ADK) in pancreatic β cells improves glucose metabolism. A, Glucose tolerance test results of 4‐wk‐old Adkfl/fl, Ins2‐Cre+/- and Ins2‐Cre±Adkfl/fl mice. Ins2‐Cre±Adkfl/fl showed a significant reduction in the blood glucose level compared with Adkfl/fl and Ins2‐Cre+/- mice (P value ≤ 0.001); n = 9 per group. B, The fasted and fed results of 4‐wk‐old Adkfl/fl, Ins2‐Cre+/- and Ins2‐Cre±Adkfl/fl mice. Under the fasting condition (16 h), significant differences were shown (P‐value ≤ 0.001). Additionally, under the fed condition, Ins2‐Cre±Adkfl/fl mice showed statistically lower glucose levels than Adkfl/fl and Ins2‐Cre+/- mice (P‐value ≤ 0.001); n = 6 per group). C, The insulin content of islets from 4‐wk‐old mice showed a statistically significant increase in Ins2‐Cre±Adkfl/fl mice compared with their Adkfl/fl and Ins2‐Cre+/- littermates (P‐value ≤ 0.001); n = 5 per group. D, Insulin release from 4‐wk‐old mouse islets treated with a low‐glucose or high‐glucose dose for 1 h. Ins2‐Cre± Adkfl/fl showed a statistically significant increase (P‐value ≤ 0.001) in insulin secretion compared with the littermate control group, n = 5 per group. E, Quantification data of plasma glucagon concentration showed no significant differences among the study group; n = 6‐7 mice per group. F, Glucose tolerance test for 9‐ to 12‐wk‐old Adkfl/fl, Ins2‐Cre+/- and Ins2‐Cre±Adkfl/fl mice (n = 12 per group). Ins2‐Cre±Adkfl/fl showed no significant differences compared with the control group. Note: *, #<0.05; **, ## P < 0.01; ***, ### P < 0.001 were considered significant; *comparison of either Ins2‐Cre± or Adkfl/fl to Ins2‐Cre±Adkfl/fl; #, comparison between Ins2‐Cre± and Adkfl/fl
Figure 3
Figure 3
Ablation of Adk in pancreatic β cells promotes β‐cell proliferation and increased β‐cell number. Immunostaining for insulin (green) and Ki67 (red) in pancreatic sections from Adkfl/fl, Ins2‐Cre+/- and Ins2‐Cre±Adkfl/fl mice. Scale bar: 50 μm. n = 3 mice per group and the experiment was repeated twice; all sections were used from each mouse. B, Quantitative data showed the co‐localization of Ki67 (red) and insulin (green) in β cells. The ki67+ β‐cell was more abundant in Ins2‐Cre±Adkfl/fl mice than in their littermate control groups (P value ≤ 0.01). C, Quantitative data of immunostaining for Ins2‐Cre±Adkfl/fl displayed a significant increase in the β‐cell number compared with the Adkfl/fl and Ins2‐Cre+/- groups (P value ≤ 0.01). Note: *, #<0.05; **, ## P < 0.01; ***, ### P < 0.001 were considered significant; *comparison of either Ins2‐Cre± or Adkfl/fl to Ins2‐Cre±Adkfl/fl; #comparison between Ins2‐Cre± and Adkfl/fl
Figure 4
Figure 4
The relative β‐cell volume and β‐cell mass are increased in young Adk knockout mice. A, Immunostaining of insulin (green) and DAPI staining (blue); in pancreatic sections from Adkfl/fl, Ins2‐Cre+/- and Ins2‐Cre±Adkfl/fl mice (4 wks old, the upper part; 9‐12 wks old, lower part). Scale bar used: 0.5 mm and 50 μm, (n = 6 mice); all sections were used from each mouse. B, Quantitative data of the percentage of the insulin area to the total tissue area among Adkfl/fl, Ins2‐Cre+/- and Ins2‐Cre±Adkfl/fl young mice. C, Quantitative data for the β‐cell mass among the young study groups. (D,E) Quantitative data of the percentage of the insulin area to the total tissue area and quantitative data for the β‐cell mass among Adkfl/fl, Ins2‐Cre+/- and Ins2‐Cre±Adkfl/fl adult mice. No obvious differences were observed among the study groups (P value ≥ 0.05). Note: *, #<0.05; **, ## P < 0.01; ***, ### P < 0.001 were considered significant; *comparison of either Ins2‐Cre± or Adkfl/fl to Ins2‐Cre±Adkfl/fl; #comparison between Ins2‐Cre± and Adkfl/fl
Figure 5
Figure 5
α and δ cells were comparable among the study groups. A, A representative immunostaining result for insulin (INS‐green), glucagon (GLUG‐red) and somatostatin (SST‐red) in pancreatic sections from 4‐wk‐old Adkfl/fl, Ins2‐Cre+/- and Ins2‐Cre±Adkfl/fl mice. Scale bar: 50 μm. (B,C) Quantification data of the islet α and δ cell number by immunostaining (n = 6 mice per group). Ins2‐Cre±Adkfl/fl mice were comparable to their Adkfl/fl and Ins2‐Cre+/- littermates (P value ≥ 0.05)
Figure 6
Figure 6
Ablation of adenosine kinase (ADK) in pancreatic β cells resists streptozotocin (STZ)‐induced hyperglycaemia through increased β‐cell proliferation. A, Immunostaining for insulin (green) and Ki67 (red) in pancreatic sections from Adkfl/fl, Ins2‐Cre+/- and Ins2‐Cre±Adkfl/fl mice after STZ treatment. Scale bar: 50 μm, all sections were selected from each mouse. The Ins2‐Cre±Adkfl/fl mouse group revealed a significant increase in the number of Ki67+ β cells compared with the control groups. B, Representative immunostaining for insulin (INS, green) and TUNEL (red) showing the morphology of apoptotic β cells in the islets from Adkfl/fl, Ins2‐Cre+/- and Ins2‐Cre±Adkfl/fl mice. C, Blood glucose levels of 9‐ to 12‐wk‐old Adkfl/fl, Ins2‐Cre+/- and Ins2‐Cre±Adkfl/fl mice (n = 8 per group). The blood glucose level was checked before and after STZ injection for 14 d. Ins‐Cre± Adkfl/fl mice showed significantly lower blood glucose levels than their Adkfl/fl and Ins‐Cre± littermates (P value ≤ 0.01). D, Quantitative data for the relative β‐cell area/islets, in the Ins2‐Cre± and Adkfl/fl groups sowed a highly significant decrease in the percentage of the β‐cell area/islets (P value ≤ 0.01) compared with that in the Ins2‐Cre+/-Adkfl/fl group. E, Quantitative data for Ki67+ β‐cells/islets. The Ins2‐Cre±Adkfl/fl group showed a highly significant increase in the number of Ki67+ β cells/islets compared with that in the control group, Adkfl/fl and Ins‐Cre±, (P value ≤ 0.01). F, Quantitative analysis of the ratio of the TUNEL‐positive β‐cell to the islet β cells. The apoptotic β‐cell was counted as TUNEL and insulin positive cells (three mice per group). Ins2‐Cre+/-Adkfl/fl mice displayed a significantly lower number of islet apoptotic cell than the Ins2‐Cre± and Adkfl/fl groups (P value ≤ 0.05). Asterisks indicate the level of statistical significance.*P ≤ 0.05; **P ≤ 0.01; ***P ≤ 0.001. Error bars are represented by Mean ± SD. All the data were analysed using one‐way ANOVA, or Student's t test. Note: *, # P < 0.05; **, ## P < 0.01; ***, ### P < 0.001 were considered significant; *, comparison of either Ins2‐Cre± or Adkfl/fl to Ins2‐Cre±Adkfl/fl; #comparison between Ins2‐Cre± and Adkfl/fl.

Similar articles

Cited by

References

    1. Bonner‐Weir S. Islet growth and development in the adult. J Mol Endocrinol. 2000;24(3):297‐302. - PubMed
    1. Weir GC, Laybutt DR, Kaneto H, Bonner‐Weir S, Sharma A. Beta‐cell adaptation and decompensation during the progression of diabetes. Diabetes. 2001;50(Suppl 1):S154‐S159. - PubMed
    1. Mukherjee A, Morales‐Scheihing D, Butler PC, Soto C. Type 2 diabetes as a protein misfolding disease. Trends Mol Med. 2015;21(7):439‐449. - PMC - PubMed
    1. Shen W, Taylor B, Jin Q, et al. Inhibition of DYRK1A and GSK3B induces human beta‐cell proliferation. Nat Commun. 2015;6:8372. - PMC - PubMed
    1. Wang P, Alvarez‐Perez JC, Felsenfeld DP, et al. A high‐throughput chemical screen reveals that harmine‐mediated inhibition of DYRK1A increases human pancreatic beta cell replication. Nat Med. 2015;21(4):383‐388. - PMC - PubMed

Publication types