

Automated Fundus Image Quality Assessment in Retinopathy of Prematurity Using Deep Convolutional Neural Networks
- PMID: 31044738
- PMCID: PMC6501831
- DOI: 10.1016/j.oret.2019.01.015
Automated Fundus Image Quality Assessment in Retinopathy of Prematurity Using Deep Convolutional Neural Networks
Abstract
Purpose: Accurate image-based ophthalmic diagnosis relies on fundus image clarity. This has important implications for the quality of ophthalmic diagnoses and for emerging methods such as telemedicine and computer-based image analysis. The purpose of this study was to implement a deep convolutional neural network (CNN) for automated assessment of fundus image quality in retinopathy of prematurity (ROP).
Design: Experimental study.
Participants: Retinal fundus images were collected from preterm infants during routine ROP screenings.
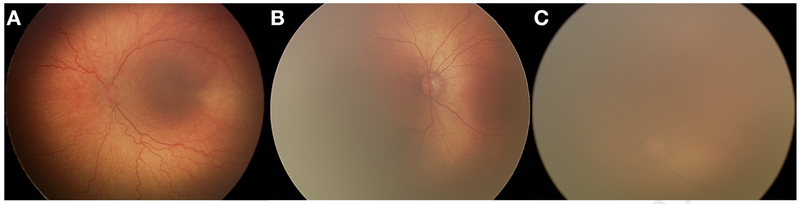
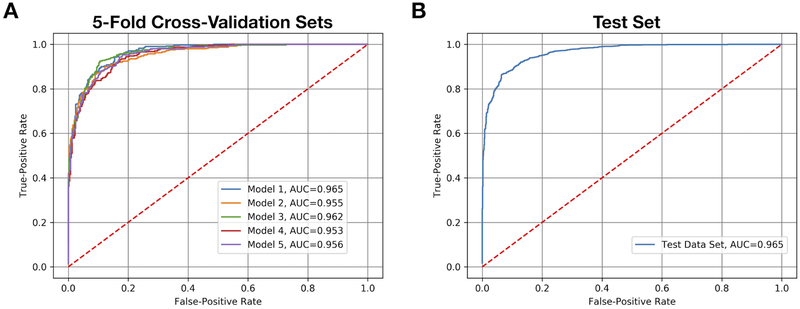
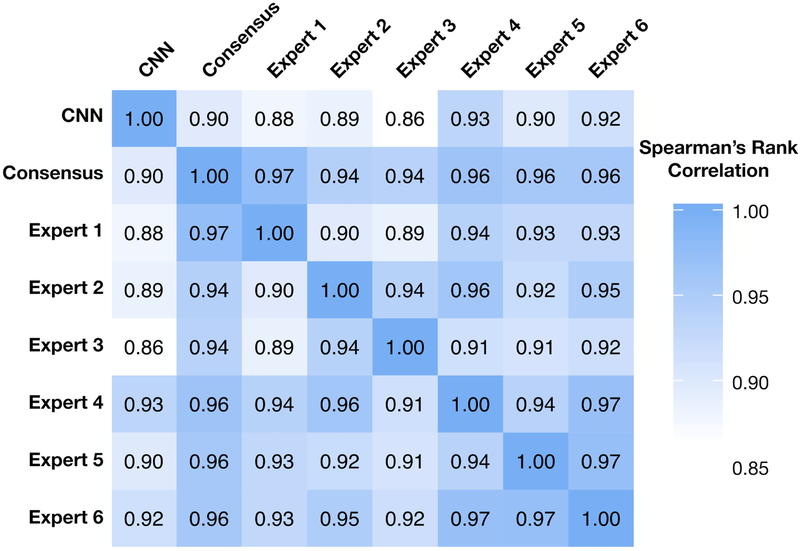
Methods: Six thousand one hundred thirty-nine retinal fundus images were collected from 9 academic institutions. Each image was graded for quality (acceptable quality [AQ], possibly acceptable quality [PAQ], or not acceptable quality [NAQ]) by 3 independent experts. Quality was defined as the ability to assess an image confidently for the presence of ROP. Of the 6139 images, NAQ, PAQ, and AQ images represented 5.6%, 43.6%, and 50.8% of the image set, respectively. Because of low representation of NAQ images in the data set, images labeled NAQ were grouped into the PAQ category, and a binary CNN classifier was trained using 5-fold cross-validation on 4000 images. A test set of 2109 images was held out for final model evaluation. Additionally, 30 images were ranked from worst to best quality by 6 experts via pairwise comparisons, and the CNN's ability to rank quality, regardless of quality classification, was assessed.
Main outcome measures: The CNN performance was evaluated using area under the receiver operating characteristic curve (AUC). A Spearman's rank correlation was calculated to evaluate the overall ability of the CNN to rank images from worst to best quality as compared with experts.
Results: The mean AUC for 5-fold cross-validation was 0.958 (standard deviation, 0.005) for the diagnosis of AQ versus PAQ images. The AUC was 0.965 for the test set. The Spearman's rank correlation coefficient on the set of 30 images was 0.90 as compared with the overall expert consensus ranking.
Conclusions: This model accurately assessed retinal fundus image quality in a comparable manner with that of experts. This fully automated model has potential for application in clinical settings, telemedicine, and computer-based image analysis in ROP and for generalizability to other ophthalmic diseases.
Copyright © 2019 American Academy of Ophthalmology. Published by Elsevier Inc. All rights reserved.
Figures
References
-
- Castellanos FX, Giedd JN, Marsh WL, et al. Quantitative brain magnetic resonance imaging in attention-deficit hyperactivity disorder. Arch Gen Psychiatry. 1996;53(7):607–616. - PubMed
Publication types
MeSH terms
Grants and funding
LinkOut - more resources
Full Text Sources
