. 2019 May 2:8:e44791.
doi: 10.7554/eLife.44791.

5α-cyprinol sulfate, a bile salt from fish, induces diel vertical migration in Daphnia

Affiliations

5α-cyprinol sulfate, a bile salt from fish, induces diel vertical migration in Daphnia

Meike Anika Hahn et al. Elife. .

Abstract

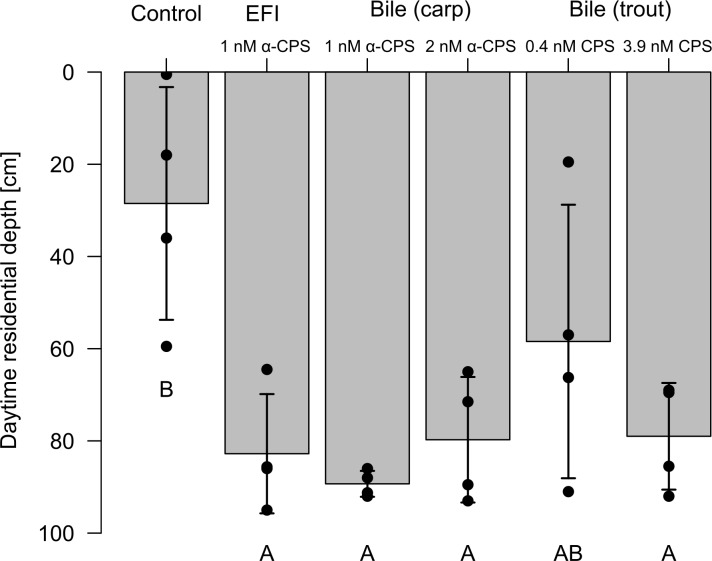
Prey are under selection to minimize predation losses. In aquatic environments, many prey use chemical cues released by predators, which initiate predator avoidance. A prominent example of behavioral predator-avoidance constitutes diel vertical migration (DVM) in the freshwater microcrustacean Daphnia spp., which is induced by chemical cues (kairomones) released by planktivorous fish. In a bioassay-guided approach using liquid chromatography and mass spectrometry, we identified the kairomone from fish incubation water as 5α-cyprinol sulfate inducing DVM in Daphnia at picomolar concentrations. The role of 5α-cyprinol sulfate in lipid digestion in fish explains why from an evolutionary perspective fish has not stopped releasing 5α-cyprinol sulfate despite the disadvantages for the releaser. The identification of the DVM-inducing kairomone enables investigating its spatial and temporal distribution and the underlying molecular mechanism of its perception. Furthermore, it allows to test if fish-mediated inducible defenses in other aquatic invertebrates are triggered by the same compound.

Keywords: Cyprinus carpio; Daphnia magna; Rutilus rutilus; daphnia; diel vertical migration; ecology; kairomone; zooplankton.


Conflict of interest statement

MH, CE, LB, Ev No competing interests declared

Figures

Figure 1.
Figure 1.. Chromatogram and biological activity of extracted fish incubation water (EFI).
(A) Chromatogram of EFI after separation on a 250 mm x 4 mm reversed phase column (Nucleosil 100–5 C18, Macherey-Nagel, Düren, Germany) using the ammonium acetate buffered mobile phases A H2O and B acetonitrile/MeOH (13:6, (v/v) with the portion of B increasing over time. Vertical lines and numbering indicate collection of fractions 1–6. (B) Behavioral response of Daphnia magna to extract of fish incubation water (EFI) and fractions thereof. The control contains the same volume of pure organic solvent as tested from EFI and its fractions. Mean Daphnia daytime residence depth (± SD, n = 4). Different capital letters indicate significant differences among treatments after one-way ANOVA followed by Tukey’s HSD test. Statistical results are summarized in Figure 1—source data 1.
Figure 1—figure supplement 1.
Figure 1—figure supplement 1.. Temperature profile of the experimental tubes.
Figure 2.
Figure 2.. MS data of the biologically active HPLC fraction.
(A) ESI-MS spectrum extracted from the time window corresponding to the active fraction three in Figure 1 (11 - 14 min) measured in the negative ionization mode. m/z 531.29986 [M–H] indicates the presence of 5α-cyprinol sulfate (α-CPS), and m/z 498.28981 [M–H] (see insert) indicates the presence of the conjugated bile acid taurochenodeoxycholic acid (TCDCA). (B) Negative ionization MS-MS of m/z 531.29986 [M–H]: 96.95996 (HSO4calc=m/z 96.96010, ∆ = –1.44 ppm), which indicated the presence of a sulfate group in m/z 531.29986 [M–H].
Figure 3.
Figure 3.. Retention times of selected bile salts in extracted fish incubation water and fish bile.
Extracted ion chromatograms of cyprinol sulfate ([M]calc=m/z 532.3070; black line) and the conjugated bile acid taurochenodeoxycholic acid (TCDCA) ([M]calc=m/z 498.2889; dashed line) after ESI-MS in the negative ionization mode, which were present in the active fraction of extracted fish incubation water (Figure 2A&B). (A) pure TCDCA and (B) reference substances for 5α-cyprinol sulfate from Hahn et al. (2018) (5α-CPS). Based on identical retention time with B, α-CPS purified from carp bile and due to MS/MS (Figure 3—figure supplement 1) 5α-CPS is present in extracted fish incubation water (EFI) from Rutilus rutilus (C) and in extracted bile from Oncorhynchus mykiss (D) and from Cyprinus carpio (E). Relative intensities, with the highest set to 100%, are depicted.
Figure 3—figure supplement 1.
Figure 3—figure supplement 1.. MS-MS (negative ionization mode) of 531.2997 [M-H]-: 96.95980–96.95992 at 50 eV for (A) 5α-CPS purified from carp bile, (B) extracted fish incubation water (EFI) of R.rutilus and (C) extracted bile of rainbow trout Oncorhynchus mykiss for the time windows, when α-CPS (Mcalc = m/z 531.29986) was detected during LC-MS of Figure 3.
Figure 3—figure supplement 2.
Figure 3—figure supplement 2.. Behavioral response of Daphnia magna to extract of fish incubation water (EFI) and to extract of carp and trout bile.
Controls contain equivalent volumes of pure organic solvent. Mean daytime residence depth (± SD, n = 4). The day:night cycle was 16:8 hr. Different capital letters indicate significant differences among treatments. Statistical results are summarized in Figure 3—figure supplement 2—source data 1.
Figure 4.
Figure 4.. Effects of extracted fish incubation water (EFI) and of increasing concentrations of selected bile salts.
(A) 5α-cyprinol sulfate (5α-CPS), (B) taurochenodeoxycholic acid (TCDCA), and. (C) chenodeoxycholic acid (CDCA) on behavioral responses of Daphnia. Controls contain equivalent volumes of pure organic solvent. Mean Daphnia daytime residence depth (± SD, n = 3–4) is depicted. The day:night cycle was 16:8 hr. Different capital letters indicate significant differences among treatments (one-way ANOVA followed by Tuke’s HSD test). Statistical results are summarized in Figure 4—source data 2–4.
Figure 4—figure supplement 1.
Figure 4—figure supplement 1.. Total ion chromatogram of 5α-cyprinol sulfate (α-CPS) purified from fish bile (Cyprinus carpio).
Stacked total ion chromatograms of purified α-CPS in MeOH/MilliQ (blue line) and a blank run (1:1 MeOH/MilliQ, red line) after ESI-MS in different ionization modes. Total ion counts are depicted. (A) negative ionization, (B) positive ionization. Retention times (RT) are depicted in the plots. The same chromatographic conditions as used for the chromatograms depicted in Figure 3 were applied. A reversed-phase column (100 × 2 mm Nucleosil C18, 100–3, Macherey Nagel, Düren, Germany) was used as stationary phase. After stacking of total ion chromatograms of α-CPS purified from carp bile and blank measurements of the same solvents used for α-CPS solvation, detected signals for both samples were almost identical throuoghut the chromatograms (indicating no contaminants) except for the time window between 1 and 3 min (SI Figure 4a). The extracted mass spectra corresponding to this time window indicated that the most prominent ion detected within these peaks derived from α-CPS (SI Figure 4a). Finally, the only differences between the purified α-CPS and the solvents in which it is diluted detected by LC-MS analyses, are signals derived from α-CPS, which indicates that the α-CPS enriched from carp bile is of great purity.
Figure 4—figure supplement 2.
Figure 4—figure supplement 2.. MS data of the subfraction from 1 to 3 min of LC-MS runs of purified 5α-cyprinol sulfate (α-CPS) and a blank sample (SI Figure 4).
ESI-MS spectra extracted from the time window of 1–3 min in SI Figure 4. Obtained spectra for α-CPS (A, B) and blank measurements (MeOH/MilliQ, 1:1, v:/; C,D) measured either after negative or positive ionization.
Figure 4—figure supplement 3.
Figure 4—figure supplement 3.. Calibration curves after ESI-MS of (A) taurochenodeoxycholate (TCDCA) and (B) cholesteryl sulfate used for the quantification of 5α-cyprinol sulfate.
The detected peak areas (PA) of cholesteryl sulfate and TCDCA normalized to the detected peak areas of glycocholic acid (internal standard) are plotted against the respective concentrations.
Author response image 1.
Author response image 1.. Chromatogram and biological activity of extracted fish incubation water (EFI).
(a) Chromatogram of EFI after separation on a 250 mm x 4 mm reversed phase column (Nucleosil 100-5-C18, Macherey-Nagel, Düren, Germany) using the mobile phases A H2O and B MeOH with the portion of B increasing over time. The total ion current of ESI-MS measurements in the negative ionization mode are depicted. (b) Behavioral response of Daphnia magna to extract of fish incubation water (EFI) and fractions thereof. Fraction numbering corresponds to the time of the chromatogram [min], while fraction “Pre” contains the collected eluate from 0-8 min and fraction “Post” that from 13-25 min. The control contains the same volume of pure organic solvent as tested from EFI and its fractions. Mean Daphnia daytime residence depth (+/- SD, n=4). Different capital letters indicate significant differences among treatments one-way ANOVA followed by Tukey post-hoc). Statistical results are summarized in Supplementary file 1.
Author response image 2.
Author response image 2.. ESI-MS data of the HPLC fractions leading to daytime depths of Daphnia magna which do neither statistically differ from the negative nor from the postive control and the corresponding spectra of a blank run.
ESI-MS spectrum extracted from the time window corresponding to fraction: Author response image 2“Pre”, Author response image 4“8”, Author response image 6“9” in Author response image 1 and Author response image 3, 5, 7 the corresponding mass spectra from a previous blank run measured in the negative ionization mode. MS/MS of m/z=531.3 lead to the appearance of a product ion of m/z=96.9598 which indicated the presence of a sulfate in the precursor ion (Author response image 8).
Author response image 3.
Author response image 4.
Author response image 5.
Author response image 6.
Author response image 7.
Author response image 8.
Author response image 8.. MS/MS of m/z =531.3 in fraction “8”.
Negative ionization MS/MS of m/z 531 [M– H]–:96.95979 (HSO4calc=m/z 96.96010, ∆ = –3.2ppm), which indicated the presence of a sulfate group in m/z 531.30048 [M– H].

Comment in

  • Finding the fish factor.
    Pohnert G. Pohnert G. Elife. 2019 Jun 11;8:e48459. doi: 10.7554/eLife.48459. Elife. 2019. PMID: 31184305 Free PMC article.

References

    1. Abrams PA. Foraging time optimization and interactions in food webs. The American Naturalist. 1984;124:80–96. doi: 10.1086/284253. - DOI
    1. Berendonk TU. Influence of fish kairomones on the ovipositing behavior of Chaoborus imagines. Limnology and Oceanography. 1999;44:454–458. doi: 10.4319/lo.1999.44.2.0454. - DOI
    1. Bjærke O, Andersen T, Titelman J. Predator chemical cues increase growth and alter development in nauplii of a marine copepod. Marine Ecology Progress Series. 2014;510:15–24. doi: 10.3354/meps10918. - DOI
    1. Bollens SM, Frost BW. Diel vertical migration in zooplankton: rapid individual response to predators. Journal of Plankton Research. 1991;13:1359–1365. doi: 10.1093/plankt/13.6.1359. - DOI
    1. Brönmark C, Hansson L-A. Chemical Ecology in Aquatic Systems. Oxford University Press; 2012.