. 2019 May 2;4(9):e126732.
doi: 10.1172/jci.insight.126732.

Differential transcriptome and development of human peripheral plasma cell subsets

Affiliations

Differential transcriptome and development of human peripheral plasma cell subsets

Swetha Garimalla et al. JCI Insight. .

Abstract

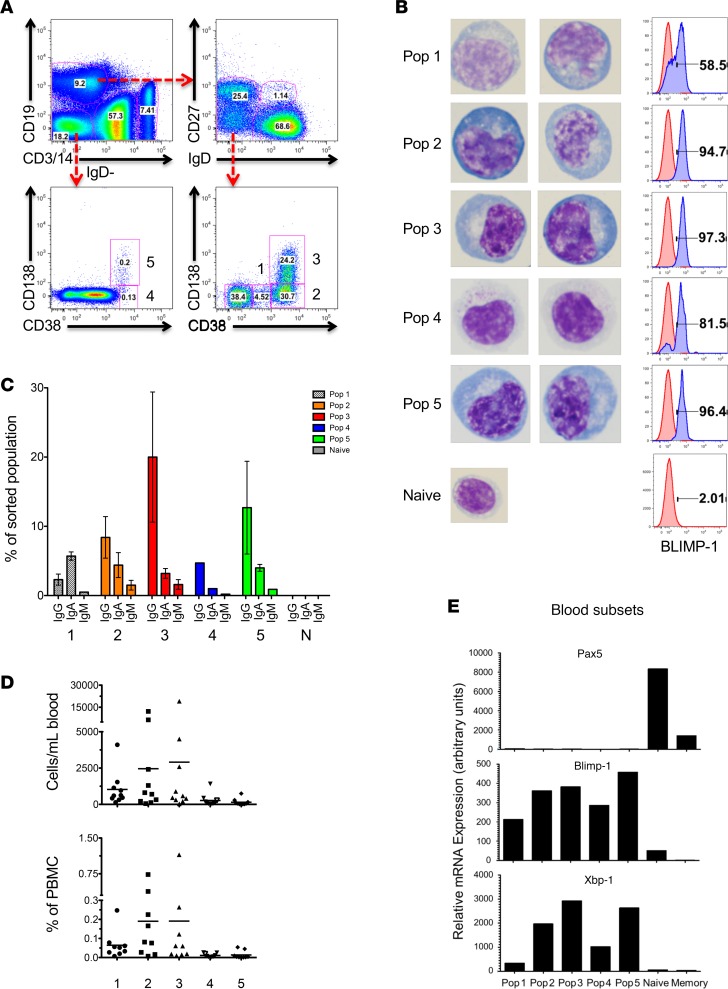
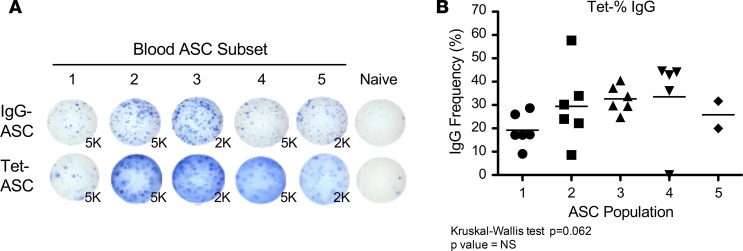
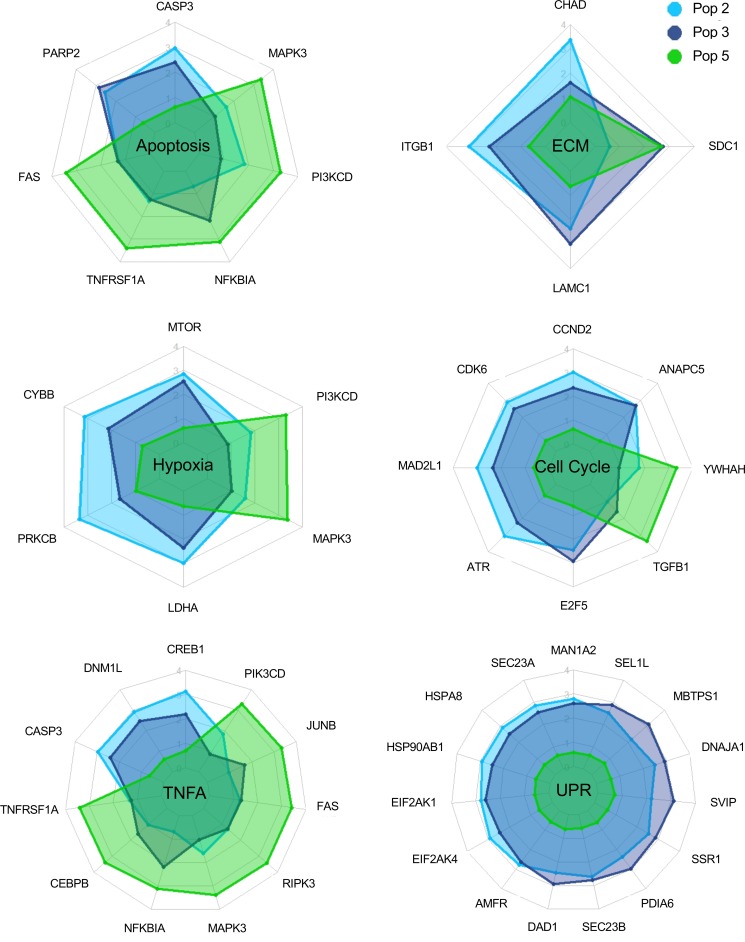
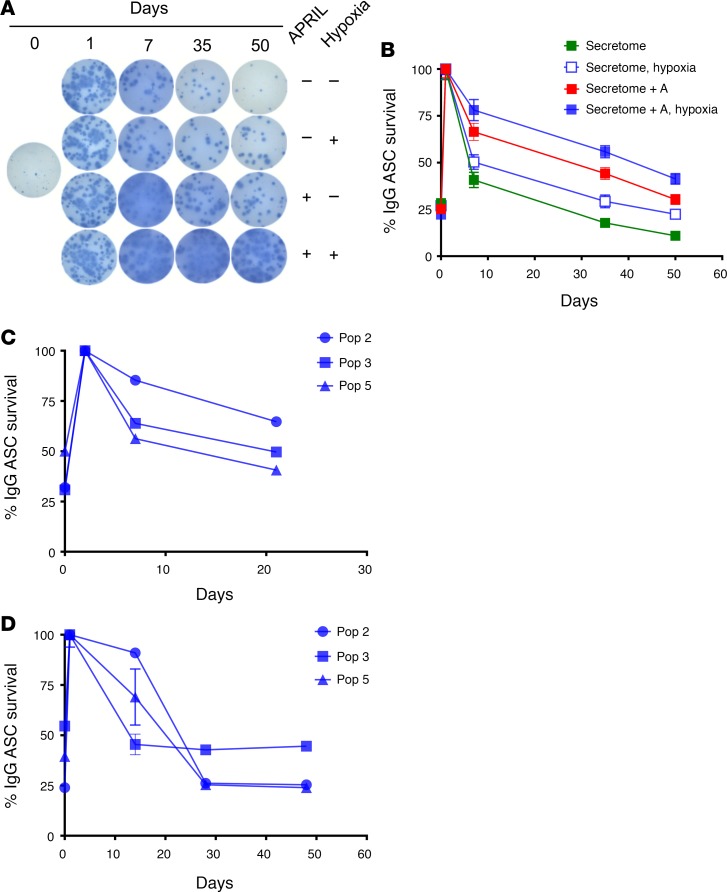
Human antibody-secreting cells (ASCs) triggered by immunization are globally recognized as CD19loCD38hiCD27hi. Yet, different vaccines give rise to antibody responses of different longevity, suggesting ASC populations are heterogeneous. We define circulating-ASC heterogeneity in vaccine responses using multicolor flow cytometry, morphology, VH repertoire, and RNA transcriptome analysis. We also tested differential survival using a human cell-free system that mimics the bone marrow (BM) microniche. In peripheral blood, we identified 3 CD19+ and 2 CD19- ASC subsets. All subsets contributed to the vaccine-specific responses and were characterized by in vivo proliferation and activation. The VH repertoire demonstrated strong oligoclonality with extensive interconnectivity among the 5 subsets and switched memory B cells. Transcriptome analysis showed separation of CD19+ and CD19- subsets that included pathways such as cell cycle, hypoxia, TNF-α, and unfolded protein response. They also demonstrated similar long-term in vitro survival after 48 days. In summary, vaccine-induced ASCs with different surface markers (CD19 and CD138) are derived from shared proliferative precursors yet express distinctive transcriptomes. Equal survival indicates that all ASC compartments are endowed with long-lived potential. Accordingly, in vivo survival of peripheral long-lived plasma cells may be determined in part by their homing and residence in the BM microniche.

Keywords: Adaptive immunity; Immunoglobulins; Immunology.


Conflict of interest statement

Conflict of interest: FEHL is the founder of MicroBplex, Inc.

Figures

Figure 1
Figure 1. ASC subsets in human blood 7 days after tetanus vaccination.
(A) Top panels divide the CD19+ and CD19 fractions. Lower panels represent subsets of CD19IgD (left) and CD19+IgD (right) fractions. (B) Morphology of blood ASC subsets (×100 magnification) by Wright-Giemsa stain. Left column: Sorted blood ASC subsets on day 7 after tetanus vaccination. ASC populations (pops) 1 to 5 and naive B cells are shown. Right column: Percentage of intracellular BLIMP-1 staining per subset is shown in blue histograms (naive controls in red). (C) Percentage of each ASC subset and naive B cells (N) expressing IgG, IgA, or IgM isotypes after peak vaccination. (D) Quantification of each blood ASC subset (pops 1 to 5) in cells/ml (top) and percentage of PBMCs (bottom). (E) Quantitative RNA expression of 5,000 sorted ASC subsets and naive and memory B cells for Pax5 (top), BLIMP-1 (middle), and Xbp-1 (lower), normalized to GAPDH in blood. Relative mRNA expression is expressed in arbitrary units.
Figure 2
Figure 2. Phenotype of blood ASC subsets on day 7 after vaccination.
(A) CD20, surface Ig (kappa and lamda), and CD27 staining for blood ASC subsets and naive B cells (CD19+IgD+CD27) illustrated in blue relative to controls in gray (also shown in right-hand panel). (B) HLA-DR and Ki-67 staining for blood ASC subsets. Far right: CD14+ peripheral blood monocytes served as controls for HLA-DR staining and naive B cells for Ki-67. (C and D) Frequency of CXCR4, CD28, IL-6R, FCGR2B, and BCMA in blood ASC subsets (pops 2 to 5) and naive B cells. Respective numbers of subjects are listed in Table 1.
Figure 3
Figure 3. Ratios of ASC subsets in blood and BM.
(A) Pie charts representing proportions of pops 2, 3, 4, and 5 in the blood from 8 different adult subjects at steady state (top) and at peak (days 6–7) ASC response in blood after tetanus vaccination. The proportion of each ASC subset is represented by the corresponding sector size of the pie chart. Kinetics of the ratios of the ASC in the blood after tetanus vaccination is shown for subject 3 (inset). (B) From 8 additional subjects, ratios of pops A, B, C, and D in the BM and blood pops 2, 3, 4, and 5 were matched at the time of the BM aspirate. ASC subsets in blood and BM (pops 1 and Z) are not included. Pops 2 and A, pops 3 and B, pops 4 and C, and pops 5 and D (LLPC subset) are shown in tan, red, blue, and green, respectively.
Figure 4
Figure 4. Next-generation sequencing (NGS) repertoire sequencing of blood ASC subsets.
NGS was used to analyze the clonal repertoire of the ASC populations, naive B cells, and isotype-switched memory B cells. (A) Diversity of the repertoire is shown by plotting lineage (clone) size versus the cumulative percentage of sequences determined from size-ranked clones. Largest clones are found at the top of the plot and account for a greater area within the subdivided plots. More diverse repertoires, such as the naive population here, only contain small clones in a more even representation. (B) Hill diversity profiles for each population (with different levels of sampling) demonstrate the overall diversity of the repertoire in each of the ASC populations. (C) Relative quantities of IgM, IgG, and IgA sequences in each subset. Naive is predominantly IgM. Blood ASC subsets 1 to 5 and switched memory B cells show mostly IgG and IgA. (D) Circos plot shows interconnectedness of the ASC populations by plotting the sequences from each population in clonal size–ranked order, with the largest clones being in the most clockwise portion of each population segment. The outer-most track shows the isotype makeup of each clone by color. The next track in shows mutation frequency of each sequence, with more mutations represented as more distal from the center of the plot. The next track in shows the number of sequences, followed by the clonality displayed by a circular stacked bar plot. Here, only the largest 50% of the clones are colored to avoid blurring of small clones. The internal connections show clones found in multiple populations. (E) Stacked bar plots again demonstrate the diversity of the repertoire by showing size-ranked clones as segments taking up a percentage of the total repertoire. The largest 10 clones of all populations are colored and like-colors demonstrate the same clone in multiple populations. (F) The Morisita overlap index demonstrates the similarity of repertoires in various populations as a value from 0 (no similarity) to 1 (identical repertoires). The color strength is indicative of interconnectivity.
Figure 5
Figure 5. Vaccine-specific IgG ASC frequencies 7 days after tetanus vaccination.
(A) ELISpot of total IgG (top) and tetanus-specific IgG (lower) ASC frequencies from sorted ASC subsets (pops 1 to 5) in the blood. Naive B cells and total PBMCs are also shown. The total number of sorted cells per well is indicated adjacent to each well. (B) Percentage of tetanus-specific IgG/total IgG ASC frequencies from sorted ASC subsets (pops 1–5) in blood ASC populations from 8 adults. Note: some patients had limited frequencies of pops 4 and 5, which could not be sorted.
Figure 6
Figure 6. Transcriptomic analysis of ASC subsets.
(A) Heatmap of 672 transcripts differentially expressed among pop 2, pop 3, and pop 5 RNA-seq profiles from 6 subjects. Red color indicates relatively high expression, blue low expression. Two major blocks of genes upregulated or downregulated in pop 5 relative to pops 2 and 3 are indicated. Sample identities to the right show that pairs of samples from the same individual tend to cluster together. (B) Heatmap of PC1 of 29 gene sets found to be enriched in the differentially expressed genes also shows differentiation of pop 5 from pops 2 and 3, with only minor differences between the latter two. (C) Bubble plots show significantly biased gene sets in each pairwise comparison, with the size of the bubble proportional to the negative logarithm of the P value for the normalized enrichment score indicated along the x axis (see Supplemental Table 2 for full list of pathway names).
Figure 7
Figure 7. Significantly differentially expressed genes in selected pathways.
Spider plots of significantly differentially expressed genes in 6 selected pathways showing differences among the 3 ASC populations. Rays of each plot represent transcript abundance for the indicated gene, with low values in the center and high at the periphery. Polygons link observed transcript levels in each cell type, showing how pop 5 differs from pops 2 and 3.
Figure 8
Figure 8. In vitro human BM microniche systems to measure long-lived survival of the subsets.
(A) IgG ELISpots of pop 3 ASCs from a healthy adult after hepatitis A vaccine on days 0, 7, 35, and 50 in the BM MSC secretome (green) or BM MSC secretome with the addition of exogenous APRIL (red) in normoxia and hypoxia (blue open symbol or blue closed symbol). (B) Percentage of IgG ELISpots (relative to the maximal frequency) for pop 3 in MSC secretome in normoxia (green square), MSC secretome in hypoxia (open blue square), MSC secretome with the addition of exogenous APRIL in normoxia (red square), and MSC secretome with the addition of exogenous APRIL in hypoxia (blue square). (C) Percentage of IgG ELISpots from pops 2, 3, and 5 (relative to the maximal frequency for each population) from a healthy adult after tetanus vaccination on days 1, 7, and 21 in MSC secretome with the addition of exogenous APRIL in hypoxia. (D) Percentage of IgG ELISpots from pops 2, 3, and 5 (relative to the maximal frequency) from a healthy adult after influenza vaccination on days 1, 14, 28, and 48 in MSC secretome with the addition of exogenous APRIL in hypoxia.

References

    1. Halliley JL, et al. Long-lived plasma cells are contained within the CD19(-)CD38(hi)CD138(+) subset in human bone marrow. Immunity. 2015;43(1):132–145. doi: 10.1016/j.immuni.2015.06.016. - DOI - PMC - PubMed
    1. Mei HE, et al. A unique population of IgG-expressing plasma cells lacking CD19 is enriched in human bone marrow. Blood. 2015;125(11):1739–1748. doi: 10.1182/blood-2014-02-555169. - DOI - PubMed
    1. Landsverk OJ, et al. Antibody-secreting plasma cells persist for decades in human intestine. J Exp Med. 2017;214(2):309–317. doi: 10.1084/jem.20161590. - DOI - PMC - PubMed
    1. Qian Y, et al. Elucidation of seventeen human peripheral blood B-cell subsets and quantification of the tetanus response using a density-based method for the automated identification of cell populations in multidimensional flow cytometry data. Cytometry B Clin Cytom. 2010;78 Suppl 1:S69–S82. - PMC - PubMed
    1. Lee FE, et al. Circulating human antibody-secreting cells during vaccinations and respiratory viral infections are characterized by high specificity and lack of bystander effect. J Immunol. 2011;186(9):5514–5521. doi: 10.4049/jimmunol.1002932. - DOI - PMC - PubMed

Publication types