Review
. 2019 Oct 4;74(11):1689-1698.
doi: 10.1093/gerona/glz110.

An Emergent Integrated Aging Process Conserved Across Primates

Affiliations
Review

An Emergent Integrated Aging Process Conserved Across Primates

Tina W Wey et al. J Gerontol A Biol Sci Med Sci. .

Abstract

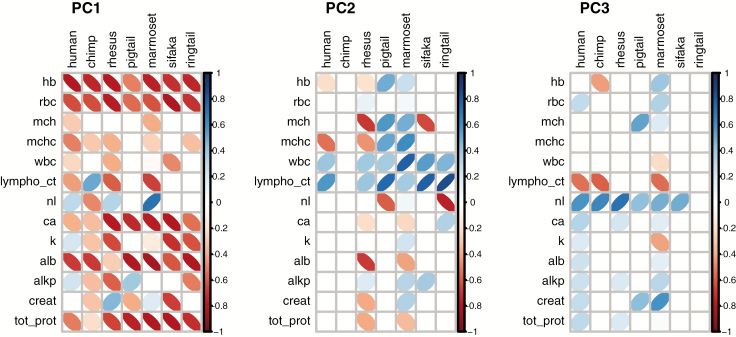
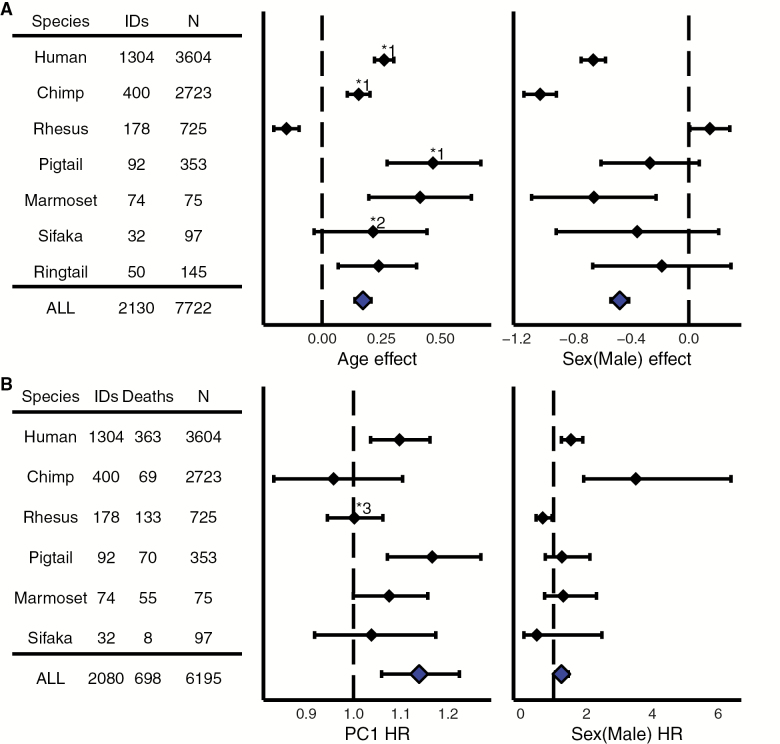
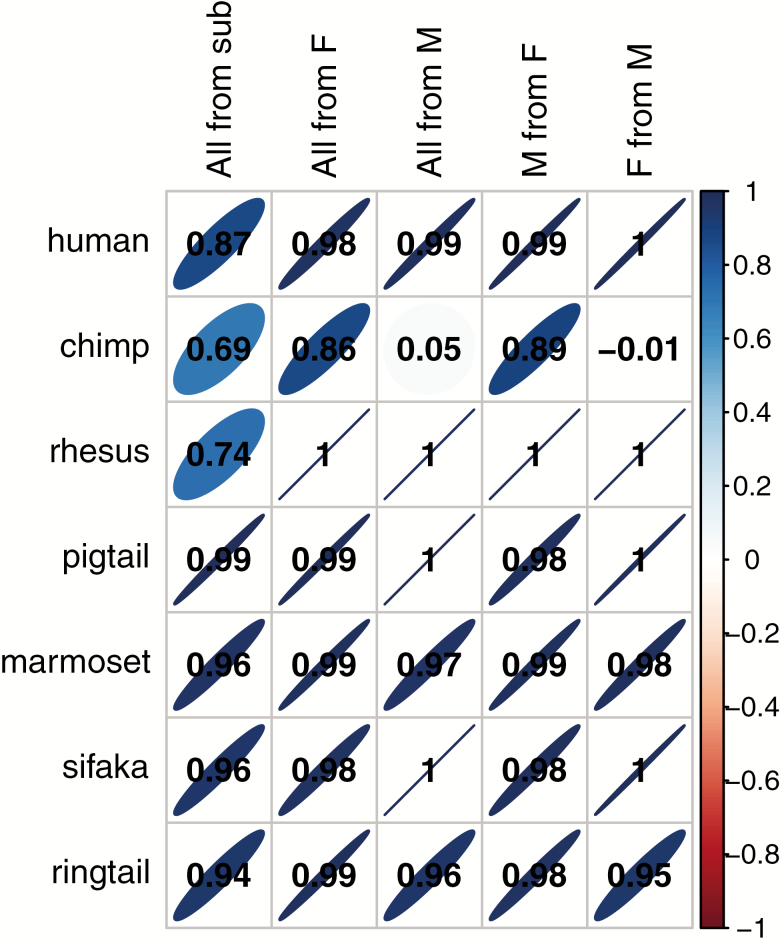
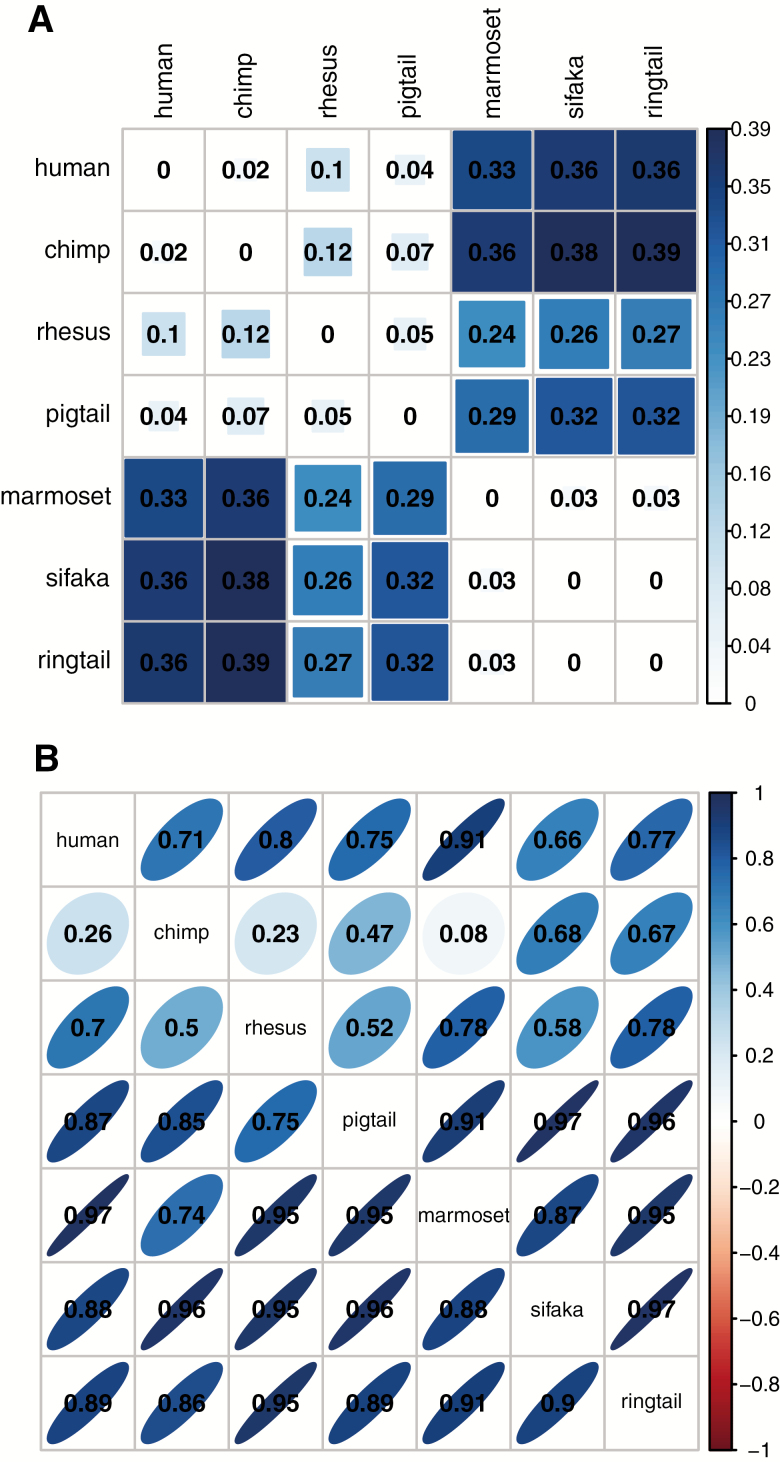
Aging is a complex process emerging from integrated physiological networks. Recent work using principal component analysis (PCA) of multisystem biomarkers proposed a novel fundamental physiological process, "integrated albunemia," which was consistent across human populations and more strongly associated with age and mortality risk than individual biomarkers. Here we tested for integrated albunemia and associations with age and mortality across six diverse nonhuman primate species and humans. PCA of 13 physiological biomarkers recovered in all species a primary axis of variation (PC1) resembling integrated albunemia, which increased with age in all but one species but was less predictive of mortality risk. Within species, PC1 scores were often reliably recovered with a minimal biomarker subset and usually stable between sexes. Even among species, correlations in PC1 structure were often strong, but the effect of phylogeny was inconclusive. Thus, integrated albunemia likely reflects an evolutionarily conserved process across primates and appears to be generally associated with aging but not necessarily with negative impacts on survival. Integrated albunemia is unlikely to be the only conserved emergent physiological process; our findings hence have implications both for the evolution of the aging process and of physiological networks more generally.

Keywords: Biomarkers; Mortality risk; Nonhuman models; Physiological networks; Principal component analysis.


Figures

Figure 1.
Figure 1.
Loadings of each biomarker on PC1, PC2, and PC3, from PCA of each species separately. Darker narrower ellipses indicate stronger correlations. Positive correlations tilt to the right and are in blue, while negative correlations tilt to the left and are in red. Loadings represent averaged values from 1,000 PCAs on 1,000 random samples of one observation per ID. For easier visualization of biomarker importance, only loadings that consistently differed from 0 were included—loadings that were not > 2 SD away from 0 were set to 0. Standard deviations were calculated from the distribution of loading values obtained from the 1000 PCA runs, for each biomarker for each species. Note that, in PC2 and PC3, blank columns indicate that variable loadings were unstable between subsamples. See Supplementary Table S1 for all loading values.
Figure 2.
Figure 2.
Estimated effects of (A) age and sex on PC1 from linear mixed models and (B) PC1 and sex on mortality risk from Cox proportional hazards models. IDs = number of unique individuals; N = number of total observations; Deaths = confirmed mortality events; HR = hazard ratio per unit PC1. Solid diamonds indicate the estimated coefficient, and error bars are 95% confidence intervals. The dotted line references (A) estimated effect = 0 or (B) hazard ratio = 1. Both age and PC1 were centered to 0 and standardized to standard deviation = 1, where appropriate, to facilitate comparisons among species. Note that the combined-species (ALL) model results (at bottom in blue) are mainly presented for illustrative purposes, as the appropriate standardization for age and PC1 across species is unknown. Average sex differences in PC1 values are not shown, but indicated with an asterisk (*) where significant and discussed in the main text. *1 = stronger positive effect in males; *2 = positive effect in females only; *3 = higher PC1 scores predict lower risk in males only.
Figure 3.
Figure 3.
Correlations between PC1 scores calculated from different possible loadings within species. Column names indicate the comparison groups. “All from sub” compares scores for all individuals from loadings from PCA of all biomarkers or the five-biomarker subsample. “All from F” compares scores for all individuals from loadings from PCA of all individuals or females only. “All from M” compares scores for all individuals from loadings from PCA of all individuals or males only. “M from F” compares scores for males from loadings from PCA of males or females only. “F from M” compares scores for females from loadings from PCA of females or males only. Darker narrower ellipses indicate stronger correlations, which indicate more consistent PC1 scores across different biomarker compositions and subpopulations. Positive correlations tilt to the right and are in blue, while negative correlations tilt to the left and are in red. Correlation coefficients are given in the cells and were calculated as standardized slope coefficients from linear mixed models accounting for repeated observations on individuals.
Figure 4.
Figure 4.
Matrices of: (A) the absolute difference in average species PC1 score from combined-species PCA; and (B) the correlations between PC1 scores calculated from average loadings of each species itself and from average loadings of other species, from separate-species PCA. In (A), darker larger squares indicate larger differences, and the largest difference in the data is set as the maximum. In (B), darker narrower ellipses indicate stronger correlations, which indicate more consistent PC1 scores between species. Positive correlations tilt to the right and are in blue, while negative correlations tilt to the left and are in red. Rows correspond to the species analyzed; columns correspond to the species used to calibrate the loadings. Correlations were calculated as standardized slope coefficients from linear mixed models accounting for repeated observations on individuals.

References

    1. Cohen AA, Martin LB, Wingfield JC, McWilliams SR, Dunne JA. Physiological regulatory networks: ecological roles and evolutionary constraints. Trends Ecol Evol. 2012;27:428–435. doi:10.1016/j.tree.2012.04.008 - DOI - PubMed
    1. Fried LP, Xue QL, Cappola AR, et al. . Nonlinear multisystem physiological dysregulation associated with frailty in older women: implications for etiology and treatment. J Gerontol A Biol Sci Med Sci. 2009;64:1049–1057. doi:10.1093/gerona/glp076 - DOI - PMC - PubMed
    1. Han J-DJ, Hou L, Sun N, Xu C, McDermott J, Wang D. The system capacity view of aging and longevity. Quant Biol. 2017;5(3):251–259. doi:10.1007/s40484-017-0115-4 - DOI
    1. Kriete A. Robustness and aging–a systems-level perspective. Biosystems. 2013;112:37–48. doi:10.1016/j.biosystems.2013.03.014 - DOI - PubMed
    1. West GB, Bergman A. Toward a systems biology framework for understanding aging and health span. J Gerontol A Biol Sci Med Sci. 2009;64:205–208. doi:10.1093/gerona/gln066 - DOI - PMC - PubMed

Publication types