. 2019 May 2;7(1):70.
doi: 10.1186/s40168-019-0686-6.

Longitudinal homogenization of the microbiome between both occupants and the built environment in a cohort of United States Air Force Cadets

Affiliations

Longitudinal homogenization of the microbiome between both occupants and the built environment in a cohort of United States Air Force Cadets

Anukriti Sharma et al. Microbiome. .

Abstract

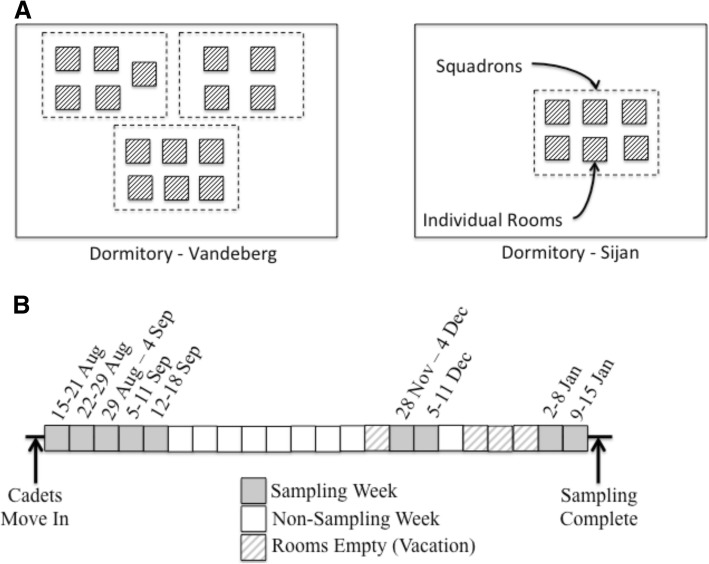
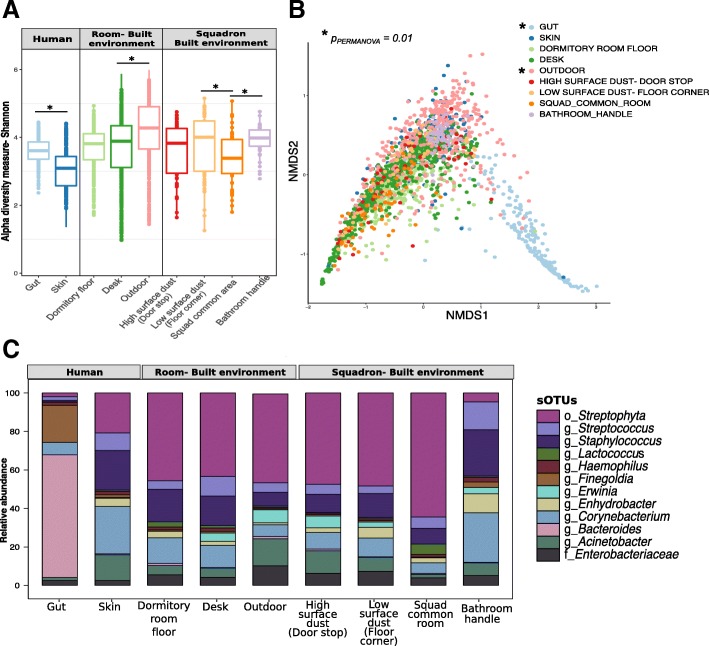
Background: The microbiome of the built environment has important implications for human health and wellbeing; however, bidirectional exchange of microbes between occupants and surfaces can be confounded by lifestyle, architecture, and external environmental exposures. Here, we present a longitudinal study of United States Air Force Academy cadets (n = 34), which have substantial homogeneity in lifestyle, diet, and age, all factors that influence the human microbiome. We characterized bacterial communities associated with (1) skin and gut samples from roommate pairs, (2) four built environment sample locations inside the pairs' dormitory rooms, (3) four built environment sample locations within shared spaces in the dormitory, and (4) room-matched outdoor samples from the window ledge of their rooms.

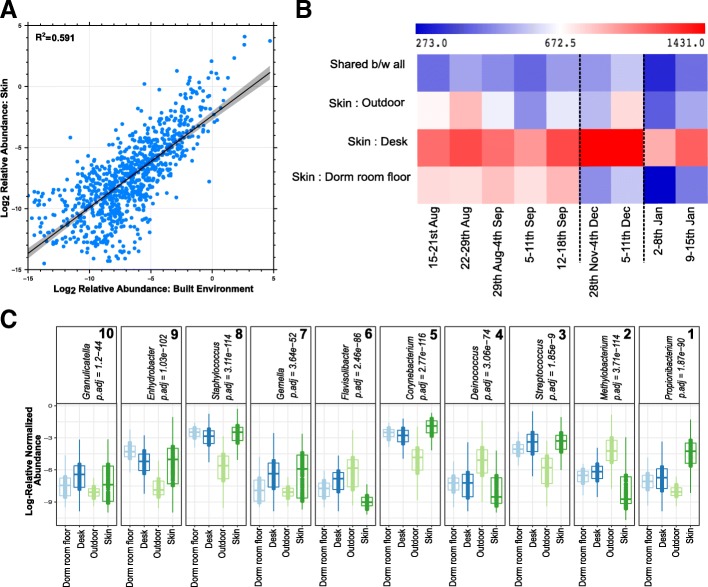
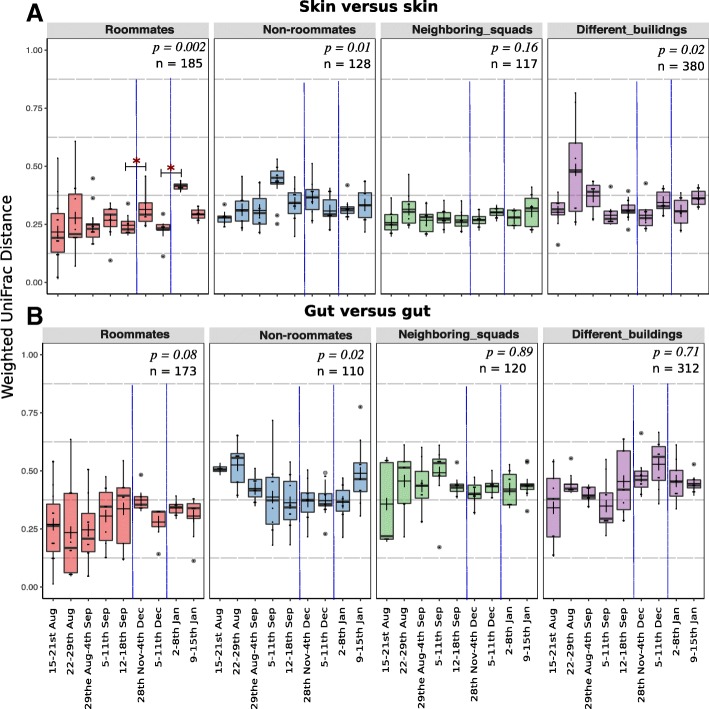
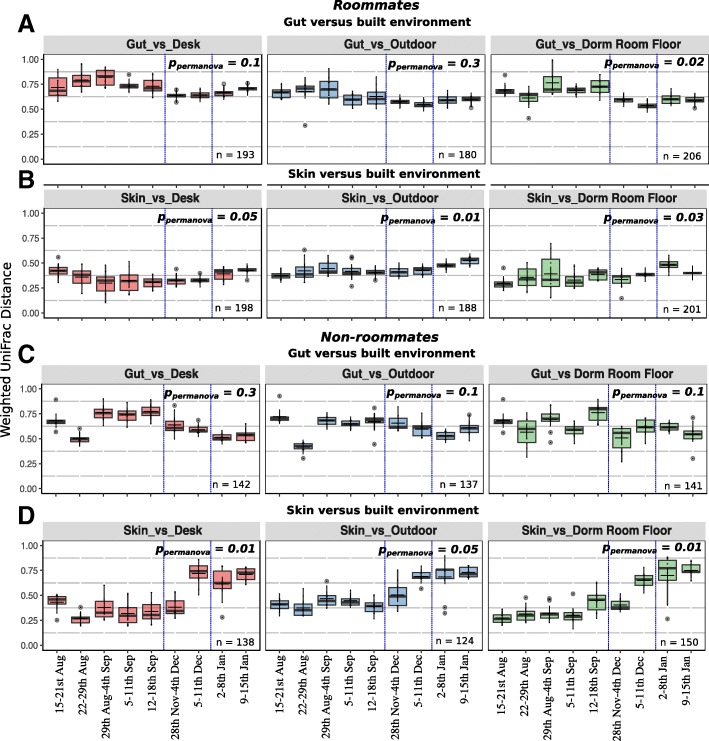
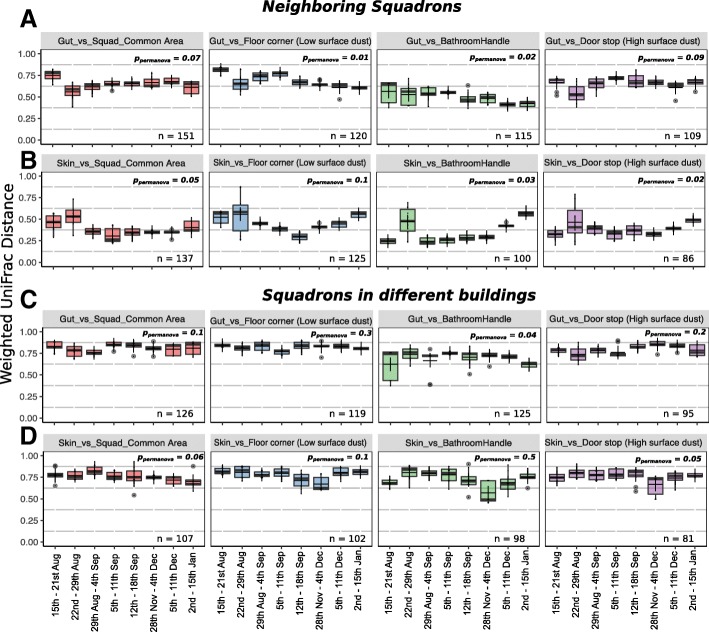
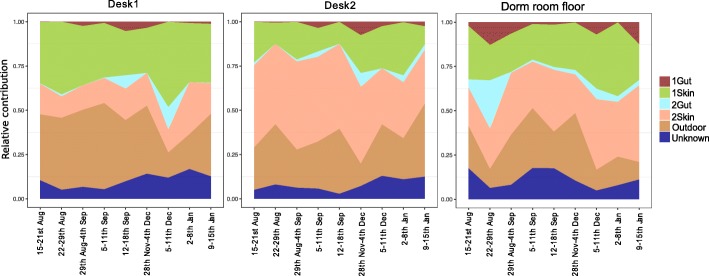
Results: We analyzed 2,170 samples, which generated 21,866 unique amplicon sequence variants. Linear convergence of microbial composition and structure was observed between an occupants' skin and the dormitory surfaces that were only used by that occupant (i.e., desk). Conversely, bacterial community beta diversity (weighted Unifrac) convergence between the skin of both roommates and the shared dormitory floor between the two cadet's beds was not seen across the entire study population. The sampling period included two semester breaks in which the occupants vacated their rooms; upon their return, the beta diversity similarity between their skin and the surfaces had significantly decreased compared to before the break (p < 0.05). There was no apparent convergence between the gut and building microbiota, with the exception of communal bathroom door-handles, which suggests that neither co-occupancy, diet, or lifestyle homogenization had a significant impact on gut microbiome similarity between these cadets over the observed time frame. As a result, predictive classifier models were able to identify an individual more accurately based on the gut microbiota (74%) compared to skin (51%).

Conclusions: To the best of our knowledge, this is the first study to show an increase in skin microbial similarity of two individuals who start living together for the first time and who are not genetically related or romantically involved. Cohabitation was significantly associated with increased skin microbiota similarity but did not significantly influence the gut microbiota. Following a departure from the occupied space of several weeks, the skin microbiota, but not the gut microbiota, showed a significant reduction in similarity relative to the building. Overall, longitudinal observation of these dynamics enables us to dissect the influence of occupation, diet, and lifestyle factors on occupant and built environment microbial ecology.

Keywords: Dormitories; Gut microbiome; Human microbiome; Longitudinal homogenization; Microbiome of the Built Environment; Roommates.


Conflict of interest statement

Ethics approval and consent to participate

All participants for this study were volunteers that signed consent forms. Participants were recruited by fellow cadets so they would not feel undue pressure to participate due to a military rank structure (PI is Lieutenant Colonel) or academic rank (PI and Co-PI were active professors at USAFA). The study was approved by the USAFA Institutional Review Board with a control number FAC20160046H and title “Longitudinal Assessment of the Influence of Lifestyle Homogenization on the Microbiome of the Built Environment in a Cohort of United States Air Force Cadets”. This study was also approved by the Vice Commandant of the USAFA who ensures research does not interfere with the cadets’ schedules.

Consent for publication

This publication was approved for publication by the United States Air Force Academy, publication # USAFA-DF-2018-244.

Competing interests

The authors declare that they have no competing interests.

Publisher’s Note

Springer Nature remains neutral with regard to jurisdictional claims in published maps and institutional affiliations.

Figures

Fig. 1
Fig. 1
Sampling methodology. a Samples were grouped into two dormitories and further defined by squadron and room. b Timeline of sampling including the 9 weeks and key events during sampling
Fig 2
Fig 2
Bacterial diversity analyses using 16S rRNA gene sequences. a Shannon alpha diversity within samples by sample category, i.e., human (skin and gut), room-associated built environment samples (desk, outdoor, and dormitory room floor), and squadron-associated built environment samples (bathroom handle, common usage area, high surface dust-door stop, and low surface dust-floor corner) based on the bacterial ASVs. b Non-metric multidimensional scaling (NMDS) ordination plot showing variation among sample categories based on the weighted UniFrac distance metric. c Distribution of top 20 most abundant ASVs across all the sample categories. Not all ASVs were assigned a genus-level classification; 14 ASVs were assigned to a genus (“g”), 4 were assigned to an order (“o”), and 2 were assigned to a family (“f”)
Fig. 3
Fig. 3
Distinctive bacteria relative abundances across sample category and week. a Plot of log2-transformed average relative abundances in the cadets’ skin and built environment samples for all ASVs. b Shared ASVs heatmap for skin and individual built environment samples, i.e., desk, dormitory room floor, and outdoor across the temporal sampling series. Total samples week 1 = 1107, week 2 = 1207, week 3 = 1102, week 4 = 982, week 5 = 1211, week 6 = 1431, week 7 = 1429, week 8 = 914, week 9 = 1149. c Differentially abundant genera between skin and built environment samples as identified by ANCOM, which are then ranked from 1 to 10 (right to left) based on feature importance score based on random forest models
Fig. 4
Fig. 4
Boxplots showing distribution of weighted UniFrac distances calculated between roommates versus between non-roommates collected over 9 data points across a period of 5 months. a Skin-to-skin and b gut-to-gut comparison between two individuals sharing the same room (roommates), individuals not having roommate association (non-roommates, i.e., randomly generated dataset in which each cadet was paired with a cadet who was not their roommate), individuals in the neighboring squadrons (i.e., squadron pairs in the same building, i.e., 1 and 2, 3 and 4, 19 and 20), and individuals residing in squadrons in different buildings (i.e., above squadron pairs compared with squadrons 27 and 28 located in a different building, which is 400 feet away). PERMANOVA p values (ppermanova) are mentioned for longitudinal comparisons of weighted UniFrac distances (skin versus skin or gut versus gut). Blue dashed lines represent the two vacations, which break the continuous sampling points. Two asterisks over two time points (i.e., after the vacation) indicate that the difference between the UniFrac distance measures at those specific time points is significant (p < 0.05) based on the PERMANOVA test. The dark lines inside the boxes of boxplots are medians and “+” represents the mean
Fig. 5
Fig. 5
Boxplots showing distribution of weighted UniFrac distances calculated between human and built environment samples collected over 9 data points across a period of 5 months. Distribution of weighted UniFrac distances between a gut (both roommates) and built environment samples associated with the dorm room (desk, dormitory room floor, outdoor), b skin (both roommates) and dorm room samples, c gut (non-roommates) and dorm room samples, and d skin (non-roommates) and dorm room samples. Weighted UniFrac distances were calculated from the dataset of 1,515 roommate samples and 1,263 non-roommate samples. n values in each panel indicate the total number of pairs used for different sample categories in weighted UniFrac distance calculations. PERMANOVA p values (ppermanova) are labeled for the comparison of weighted UniFrac distances (for each pair, i.e., human vs built environment) between the 9 weeks of sampling. Blue dashed lines represent the two vacation breaks during which the cadets vacated the rooms. The dark lines inside boxplots are the medians and “+” represents the mean, which in most cases overlapped with the medians
Fig. 6
Fig. 6
Boxplots showing distribution of weighted UniFrac distances calculated between human and built environment samples collected over 8 data points across a period of 5 months in publicly shared spaces, i.e., squadrons. Distribution of weighted UniFrac distances between a gut and built environment samples, i.e., squadron common area, floor corner (low surface dust sample), bathroom handle, and door stop (high surface dust sample) for neighboring squadrons, b skin and built environment samples for neighboring squadrons, c gut and built environment for squadrons located in different buildings, and d skin and built environment for squadrons located in different buildings. PERMANOVA p values (ppermanova) are labeled for the comparison of weighted UniFrac distances (for each pair, i.e., human vs built environment) among the eight weeks sampled. The dark lines inside the boxes of boxplots are medians and “+” represents the mean, which in most cases overlapped with the medians. The neighboring squadrons are the ones within the same building and with adjacent hallways, i.e., squadron pairs 1 and 2, 3 and 4, 19 and 20. The comparisons for squadrons in different buildings are between the gut and skin microbiome profiles of cadets living in the neighboring squadrons (abovementioned pairs) to the built environment samples belonging to squadrons 27 and 28 located in a different building (400 feet away from the first building)
Fig. 7
Fig. 7
Sourcetracker analysis shows the sources of bacteria found on built surfaces. The surfaces include the dormitory room floor and occupant-specific desks (i.e., desk1, desk2). The four sources include the two occupants’ skin and gut samples and the outdoor surface (which is representative of external environment microbiota)

References

    1. National Academies of Sciences E, and Medicine . Microbiomes of the built environment: a research agenda for indoor microbiology, human health, and buildings. Washington DC: The National Academies Press; 2017. - PubMed
    1. Lax S, Gilbert JA. Hospital-associated microbiota and implications for nosocomial infections. Trends Mol Med. 2015;21(7):427–432. doi: 10.1016/j.molmed.2015.03.005. - DOI - PubMed
    1. Barberán Albert, Dunn Robert R., Reich Brian J., Pacifici Krishna, Laber Eric B., Menninger Holly L., Morton James M., Henley Jessica B., Leff Jonathan W., Miller Shelly L., Fierer Noah. The ecology of microscopic life in household dust. Proceedings of the Royal Society B: Biological Sciences. 2015;282(1814):20151139. doi: 10.1098/rspb.2015.1139. - DOI - PMC - PubMed
    1. Adams Rachel I., Miletto Marzia, Lindow Steven E., Taylor John W., Bruns Thomas D. Airborne Bacterial Communities in Residences: Similarities and Differences with Fungi. PLoS ONE. 2014;9(3):e91283. doi: 10.1371/journal.pone.0091283. - DOI - PMC - PubMed
    1. Dunn RR, Fierer N, Henley JB, Leff JW, Menninger HL. Home life: factors structuring the bacterial diversity found within and between homes. PLoS One. 2013;8(5):e64133. doi: 10.1371/journal.pone.0064133. - DOI - PMC - PubMed

Publication types

Substances