. 2019 Jun 6;74(5):951-965.e13.
doi: 10.1016/j.molcel.2019.03.041. Epub 2019 Apr 29.

Cross-Regulation between TDP-43 and Paraspeckles Promotes Pluripotency-Differentiation Transition

Affiliations

Cross-Regulation between TDP-43 and Paraspeckles Promotes Pluripotency-Differentiation Transition

Miha Modic et al. Mol Cell. .

Abstract

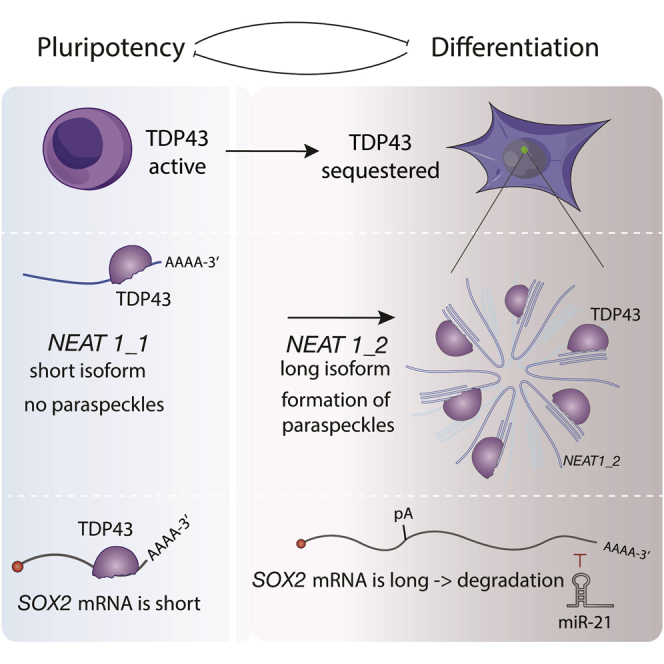
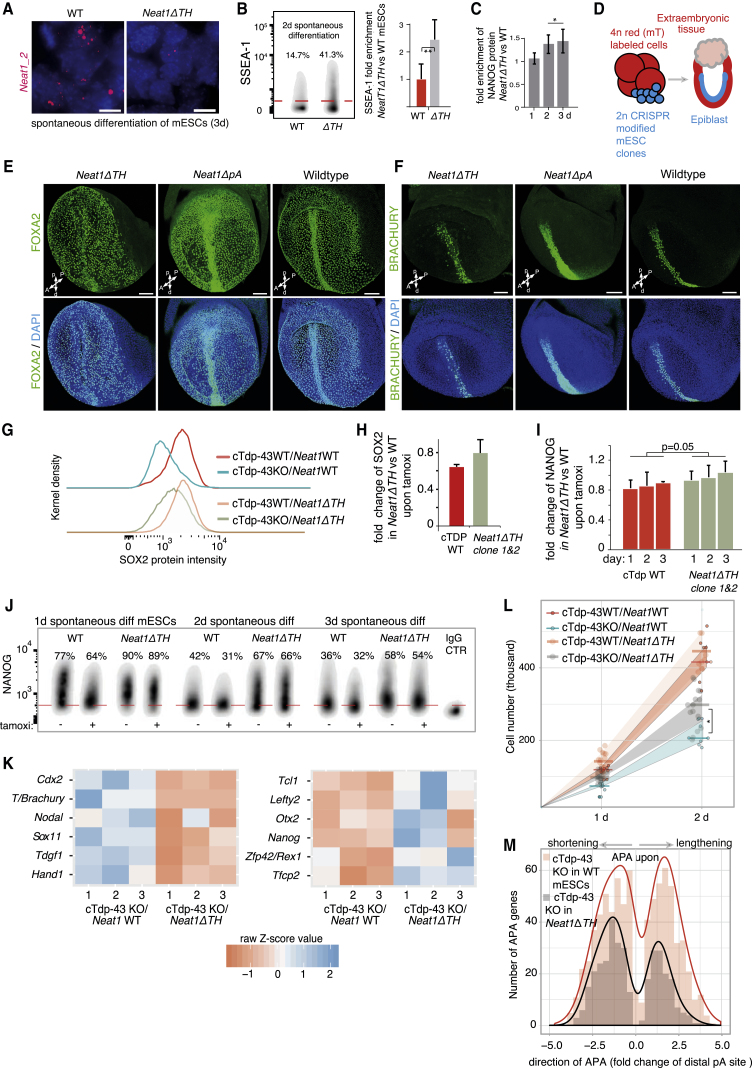
RNA-binding proteins (RBPs) and long non-coding RNAs (lncRNAs) are key regulators of gene expression, but their joint functions in coordinating cell fate decisions are poorly understood. Here we show that the expression and activity of the RBP TDP-43 and the long isoform of the lncRNA Neat1, the scaffold of the nuclear compartment "paraspeckles," are reciprocal in pluripotent and differentiated cells because of their cross-regulation. In pluripotent cells, TDP-43 represses the formation of paraspeckles by enhancing the polyadenylated short isoform of Neat1. TDP-43 also promotes pluripotency by regulating alternative polyadenylation of transcripts encoding pluripotency factors, including Sox2, which partially protects its 3' UTR from miR-21-mediated degradation. Conversely, paraspeckles sequester TDP-43 and other RBPs from mRNAs and promote exit from pluripotency and embryonic patterning in the mouse. We demonstrate that cross-regulation between TDP-43 and Neat1 is essential for their efficient regulation of a broad network of genes and, therefore, of pluripotency and differentiation.


Figures

None
Graphical abstract
Figure 1
Figure 1
Alternative Polyadenylation of NEAT1 Induces Paraspeckle Formation upon Differentiation and Depletion of TDP-43 in Mouse and Human ESCs (A and B) The number of paraspeckles analyzed by counting NEAT1_1, NEAT1_2 (A) or Neat1_1, Neat1_2 (B) double-labeled foci (based on single-molecule fluorescent in situ hybridization [smFISH] and criteria explained in Figure S1A). (A) Undifferentiated hESCs, spontaneously differentiating cells, and BMP4-, CHIR99021-, WNT3A-, and retinoic acid (RA)-treated cells, promoting trophoblast, mesoderm, mesendoderm (primitive streak-like), and neuroectoderm fates, respectively. (B) Undifferentiated mESCs and spontaneously differentiating iTDP-43-EGFP mESCs untreated or treated with doxycycline to ectopically express TDP-43; more than 250 (A) and more than 200 (B) cells analyzed per group, Mann-Whitney U test; ∗∗p < 0.001, ∗∗∗p < 0.0001. Duration of treatment was as indicated. (C) Venn diagram depicting differentially expressed genes in hESCs exposed to the indicated differentiation stimuli for 24 h relative to untreated cells (n = 2 biological replicates of global RNA-seq per condition; adjusted p < 0.01, Fisher’s exact test, fold change ≥ 4). Bottom: representative mapping of NEAT1 RNA-seq reads aligned to the two isoforms; global and nascent RNA-seq of undifferentiated hESCs and CHIR99021-treated hESCs (n = 2 biological replicates). (D and E) Percentage and representative maximum projection photomicrographs of h/mESCs exhibiting NEAT1_1, NEAT1_2 (D) and Neat1_1, Neat1_2 (E) isoforms analyzed as above. (D) Undifferentiated WT and NEAT1ΔpA line and 3-day TDP-43 small interfering RNA (siRNA)-treated hESCs (knockdown [KD]) maintained under pluripotency conditions. (E) Undifferentiated WT and Neat1ΔpA line and cTdp-43 KO (conditional knockout) mESCs 3 days following tamoxifen treatment, which leads to deletion of Tdp-43 under pluripotency conditions. Statistical analysis and counting as in (A); scale bars, 10 μm. Red, NEAT1_1, _2, Neat1_1, _2 probes; blue, DAPI (nuclear stain). (F) Representative mapping of NEAT1 and Neat1 RNA-seq reads displaying samples from TDP-43 siRNA KD or control siRNA-treated hESCs (2 days) and untreated or tamoxifen-treated Tdp-43 KO mESCs (2 days, n = 3 biological replicates) under pluripotency conditions.
Figure 2
Figure 2
NEAT1_2 Recruits TDP-43 into Paraspeckles (A) A schematic overview of the mRNA-interactome analysis strategy used for identifying relocalized RBPs upon paraspeckle formation. Peptides were identified by UV crosslinking and capturing mRNA-RBP complexes using Oligod(T)25-bound magnetic beads followed by mass spectrometry. Because deletion of the NEAT1 pA site promotes paraspeckle formation in undifferentiated hESCs (Figure 1), comparing peptide counts in NEAT1ΔpA with WT cells detects resulting changes in mRNA-RBP occupancy. Further details regarding global mRNA-interactome analysis are given in Figures S2D–S2F. (B) A Volcano plot displaying fold changes of mRNA-bound RBPs in NEAT1ΔpA undifferentiated hESCs and their respective statistical score (t test, n = 3 biological replicates per condition). Previously identified paraspeckle proteins are labeled red. (C) Western blot analysis of TDP-43 and non-paraspeckle control RBPs of the lysate versus the supernatant fraction after mRNA depletion by Oligod(T) capture, from UV-crosslinked WT and NEAT1ΔpA undifferentiated hESCs. Right: quantification (t test, n = 3, ∗∗p < 0.01). (D) The positions of TDP-43 cross-linked sites (red bars) in NEAT1 that were identified by TDP-43 iCLIP (from Tollervey et al., 2011). The 1∼2-kb deleted regions (black boxes) in the NEAT1ΔUG cell line, and the positions of the three longest stretches of UG repeats within the transcript (yellow bars) are indicated. (E–G) Representative maximum projection photomicrographs from RNA-FISH and immunofluorescence of NEAT1_2 and the paraspeckle markers PSPC1 (E) and TDP-43 (F) in WT and NEAT1ΔUG HAP-1 cells. Blue, DAPI (nuclear stain). Scale bars, 10 μm. (G) shows quantification of the TDP-43 immunofluorescence signal in DAPI and NEAT1 segmented areas corresponding to nuclei and paraspeckles, respectively. More than 200 cells were analyzed per group; Mann-Whitney U test, ∗∗∗p < 0.0001. The threshold was set on a ratio of TDP-43/NEAT1 signal as described in the STAR Methods. (H) Diagram of NEAT1 corresponding to (C), with the position of an ectopic stretch of 60 UG repeats. (I and J) Representative maximum projection photomicrographs from NEAT1 RNA-FISH and TDP-43 immunofluorescence (I) and analysis of co-localization (J). Cell lines included WT, NEAT1ΔUG, and NEAT1ΔUG+UG60 HAP1 cells. Cell numbers and statistical analysis were as in (F). Scale bars, 10 μm.
Figure 3
Figure 3
TDP-43 Maintains Pluripotency and Enhances Somatic Cell Reprogramming (A) Volcano plot displaying gene expression fold changes and their respective statistical score (adjusted p value, Fisher’s exact test), comparing untreated and tamoxifen-treated cTdp-43 KO undifferentiated mESCs (n = 10 biological replicates per condition). Known pluripotency and trophectoderm markers are labeled red and blue, respectively (marked factors fulfilled p < 0.01). (B) Representative photomicrographs of untreated cTdp-43 KO mESCs, following tamoxifen treatment in 2iLIF medium and following 2-day spontaneous differentiation. (C and D) Representative flow cytometry analyses of spontaneously differentiating (2 days) iTDP-43-EGFP mESCs that were treated with doxycycline (overexpression [OE]) or left untreated and immunostained for SSEA-1 (C) and NANOG (D). Non-treated cells were used for immunoglobulin G (IgG) control staining. The mean of three independent experiments is depicted on the right (error bars, SD); two-sided t test, ∗∗∗p < 0.001. (E–I) Reprogramming of hiF-T secondary fibroblasts with or without (empty vector) transduction of TDP-43, cells harboring doxycycline-inducible reprogramming factors (Cacchiarelli et al., 2015) (E), number of alkaline phosphatase (AP)-positive human induced pluripotent stem cell (hiPSC) colonies emerging on day 10 and 14 of reprogramming (F and G; dots represent replicates from three independent experiments, Mann-Whitney U test, ∗∗∗p < 0.001), representative photomicrographs (H), and TRA-1-60 flow cytometry analysis (I); n = 3 independent experiments, gating was based on an IgG control. (J and K) Reprogramming of primary human fibroblasts (J) and the number of AP-positive colonies on day 30 (dots represent replicates from three independent experiments) with or without (empty vector) transfection of TDP-43 (K); statistical analysis as in (F) and (G).
Figure 4
Figure 4
TDP-43 Regulates APA of Genes Important for Pluripotency, Including Sox2 (A) Scatterplot displaying relative changes of pA sites upon differentiation of hESCs (Figures S3A and S3B) and changes accruing by knocking down TDP-43 in undifferentiated hESCs for 48 h (n = 4 control short hairpin [shCTRL] and n = 8 shTDP-43 using 2 TDP-43-targeting short hairpin RNAs [shRNAs] with 4 replicates for each; adjusted p < 0.05, Fisher’s exact test). Linear regression (gray line) and the 90% confidence interval region (light blue) are shown (Pearson’s correlation coefficient [r] = 0.62). Increased use of the proximal pA site has positive values, and decreased use has negative values, based on genes passing filtering and statistical analysis as outlined in Figures S3C–S3E. (B and C) Non-redundant Gene Ontology (GO) terms (B) and ground-state and general pluripotency factors (C), characterized by (Kalkan et al., 2017), of genes exhibiting APA upon cTdp-43 KO in mESCs (n = 10 independent sample replicates per group; genes passing filtering and statistical analysis as outlined in Figure S3C–S3E). (D) Representative diagrams displaying the transcript isoforms of Sox2 upon cTdp-43 KO in mESCs and frequencies of the pA sites in Sox2 and SOX2 upon cTdp-43 KO in mESCs or KD of TDP-43 and 72 h CHIR99021 treatment of hESCs; samples as above. (E) The positions of TDP-43 crosslinking (red bars) in Sox2 transcript from mESCs, as defined by iCLIP, surrounding the proximal and distal pA sites; n = 2 biological replicates (Figure S5C) combined into a single track. (F) Western blot analysis of SOX2, TDP-43, and histone H3 following tamoxifen treatment (3 days) of cTdp-43 KO mESCs; independent replicates are shown. (G) An illustration of the EGFP-SOX2 3′ UTR reporter minigene displaying endogenous positions of the proximal and distal pA sites and the miR-21 binding site. (H–J) Representative flow cytometry analyses of HEK293T cells with the doxycycline-inducible TDP-43 gene cassette co-transfected with miR-21 (transfected cells were gated using tdTomato as described in STAR Methods), and the respective EGFP-SOX2 3′ UTR constructs: unmodified (H), harboring deletion of the proximal pA site (I), or with deletion of the miR-21 binding site (J). Control (CTR) indicates cells that were not treated with doxycycline. (K) Boxplot depicting relative levels of miR-21 in undifferentiated mESCs and in primitive streak (PS)-like progenitors generated by 3 d CHIR99021 treatment (n = 6 independent replicates, two sided t test; p value ∗∗∗ ≤ 0.001). (L) Boxplot analyses depicting levels of the Sox2 transcript in WT mESCs and cells lacking the endogenous miR-21 binding site in Sox2 (Sox2ΔmiR21) under pluripotency conditions (top) and upon PS differentiation (bottom) (n = 5 and 6 independent replicates, two-sided t test; p ≤ 0.01).
Figure 5
Figure 5
TDP-43 Directly Promotes Neat1 Polyadenylation to Repress Paraspeckles in Pluripotent Cells (A) Normalized expression of TDP-43 and NEAT1 in undifferentiated hESCs and differentiated developmental progenitors (transcriptome data from Gifford et al., 2013). (B and C) Quantification of TDP-43 during hESC differentiation, the transcript (B) based on Figure 1C, and on western blotting (C) using histone H3 for normalization (representative blot in Figure S5H). Samples were derived from undifferentiated hESCs and cells differentiated toward mesoderm progenitors using CHIR99021; (B) Fisher’s exact test and n = 2 and (C) t test, n = 3 independent replicates, as indicated by dots; error bars, SD; p≤ 0.05, ∗∗∗p ≤ 0.001). (D) TDP-43 crosslinked positions (red bars) in the Neat1 transcript (shown are Neat1_1 and the 5′ region of Neat1_2) from mESCs analyzed by iCLIP (replicates and samples as in Figure 4E). Sequence conservation score is plotted as gray bars (n.c., not conserved). (E) Modified mESC lines lacking the endogenous binding site of TDP-43 upstream of the pA site (Neat1Δ100nt) or lacking the pA signal (Neat1ΔpA). The region deleted in the Neat1Δ100 mESC line is highlighted and enlarged, showing the GU-rich motifs and the TDP-43 crosslinking positions in the region (based on D). (F and G) Percentage of cells exhibiting Neat1_1 or Neat1_2 foci (F) and number of paraspeckles in undifferentiated mESCs lines (G) and parental WT, Neat1Δ100nt, cTdp-43 KO mESC line 2 days following tamoxifen treatment and Neat1ΔpA (cell numbers analyzed, replicates, and statistical analysis as in Figure 1B).
Figure 6
Figure 6
Efficient Dissolution of Pluripotency upon Depletion of TDP-43 Requires Paraspeckles (A) Representative photomicrographs demonstrating the downregulation of Neat1_2 paraspeckles in spontaneously differentiating mESCs by deletion of the triple helix (ΔTH) in the 3′ region (further results in Figure S6A). Red, Neat1_1 and_2 probes; blue, DAPI (nuclear stain). Scale bars, 10 μm. (B and C) Pluripotency assessment by SSEA-1 (B, right, quantified gated positive cells) and intracellular NANOG (C) flow cytometry of spontaneously differentiating Neat1ΔTH and WT mESCs (duration indicated). IgG-treated samples were used for gating positive cells (red line in B). Error bars, SD; two-sided t test; biological replicates, n = 3 per time point; p < 0.05, ∗∗p < 0.01. (D–F) In vivo analysis of the developmental potency of mESCs exhibiting downregulation of paraspeckles using a 2n mESC - 4n aggregated mouse embryo complementation assay, giving rise, respectively and exclusively, to embryonic and extraembryonic tissues (D). Shown are mouse embryos (E7.75–E8.0) resulting from aggregations of Neat1ΔTH and Neat1ΔpA mESCs with 4n 2- to 4-cell-stage embryos and representative analysis of FOXA2 (E) and BRACHYURY (F) by immunostaining (n = 7 for Neat1ΔTH [5 are shown in Figures S6B and S6C], n = 7 for Neat1ΔpA [2 are shown in Figure S6D], and n = 3 for parental control mESC [2 are shown in Figure S6E]). Non-manipulated embryos are shown on the right. Blue, DAPI (nuclear stain). Scale bars, 100 μm. A, anterior; P, posterior; p, proximal; d, distal. (G–L) Pluripotency assessment by intracellular immunostaining flow cytometry (G–J; error bars, SD, two-sided t test in I, n = 3), RNA-seq (K; n = 3/group, Fisher’s exact test), and growth kinetics (L; Mann-Whitney U test, n ≥ 8/group as indicated by dots) in differentiating parental cTdp-43 KO mESCs or the same line harboring Neat1ΔTH, treated with tamoxifen during 2.5 days of spontaneous differentiation or left untreated (all consisting of independent replicates). Also shown are representative flow cytometry plots of SOX2 (G) and quantification of gated positive cells according to the IgG control (H) and of NANOG (I and J). IgG-treated samples were used to gate the positive cells (dotted red line) and to quantify the enrichment of these cells. In (K), shown are up- and downregulated representative differentiation and pluripotency genes according to the ScoreCard panel (Tsankov et al., 2015, and Kalkan et al., 2017, respectively), comparing the impact of Tdp-43 KO in mESCs lacking Neat1_2 (Neat1ΔTH) with control mESCs harboring WT Neat1. In (L), the width of colored intervals represents the interquartile range of the growth kinetics measurements. (M) Histogram depicting rearrangements (direction and degree) of pA sites following cTdp-43 KO in Neat1ΔTH mESCs compared with the respective parental WT cells (genes passing filtering and statistical analysis as outlined in Figures S3C–S3E; APA in the range of ±5-fold change, p < 0.01). mESCs were treated with tamoxifen for 2.5 days or left untreated during spontaneous differentiation (n = 3 independent replicates/group).

References

    1. Adriaens C., Standaert L., Barra J., Latil M., Verfaillie A., Kalev P., Boeckx B., Wijnhoven P.W.G., Radaelli E., Vermi W. p53 induces formation of NEAT1 lncRNA-containing paraspeckles that modulate replication stress response and chemosensitivity. Nat. Med. 2016;22:861–868. - PubMed
    1. Akhtar M.N., Bukhari S.A., Fazal Z., Qamar R., Shahmuradov I.A. POLYAR, a new computer program for prediction of poly(A) sites in human sequences. BMC Genomics. 2010;11:646. - PMC - PubMed
    1. Alon U. Third Edition. Chapman and Hall/CRC; 2007. An Introduction to Systems Biology: Design Principles of Biological Circuits.
    1. Baltz A.G., Munschauer M., Schwanhäusser B., Vasile A., Murakawa Y., Schueler M., Youngs N., Penfold-Brown D., Drew K., Milek M. The mRNA-bound proteome and its global occupancy profile on protein-coding transcripts. Mol. Cell. 2012;46:674–690. - PubMed
    1. Blake J.A., Christie K.R., Dolan M.E., Drabkin H.J., Hill D.P., Ni L., Sitnikov D., Burgess S., Buza T., Gresham C., Gene Ontology Consortium Gene Ontology Consortium: going forward. Nucleic Acids Res. 2015;43:D1049–D1056. - PMC - PubMed

Publication types