Infectious Disease Hospitalizations: United States, 2001 to 2014
- PMID: 31047954
- PMCID: PMC6696939
- DOI: 10.1016/j.chest.2019.04.013
Infectious Disease Hospitalizations: United States, 2001 to 2014
Abstract
Background: Infectious disease epidemiology has changed over time, reflecting improved clinical interventions and emergence of threats such as antimicrobial resistance. This study investigated infectious disease hospitalizations in the United States from 2001 to 2014.
Methods: Estimated rates of infectious disease hospitalizations were calculated by using the National (Nationwide) Inpatient Sample. Infectious disease hospitalizations were defined as hospitalizations with a principal discharge diagnosis of an infectious disease. Diagnoses according to site of infection and sepsis were examined, as was occurrence of in-hospital death. The leading nonsepsis infectious disease secondary diagnoses for hospitalizations with a principal diagnosis of sepsis were identified.
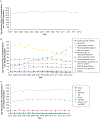
Results: The mean annual age-adjusted infectious disease hospitalization rate was 1,468.2 (95% CI, 1,459.9-1,476.4) per 100,000 population; in-hospital death occurred in 4.22% (95% CI, 4.18-4.25) of infectious disease hospitalizations. The mean annual age-adjusted infectious disease hospitalization rate increased from 2001-2003 to 2012-2014 (rate ratio, 1.05; 95% CI, 1.01-1.09), as did the percentage of in-hospital death (4.21% [95% CI, 4.13-4.29] to 4.30% [95% CI, 4.26-4.35]; P = .049). The diagnoses with the highest hospitalization rates among all sites of infection and sepsis diagnoses were the lower respiratory tract followed by sepsis. The most common nonsepsis infectious disease secondary diagnoses among sepsis hospitalizations were "urinary tract infection," "pneumonia, organism unspecified," and "intestinal infection due to Clostridium [Clostridioides] difficile."
Conclusions: Although hospital discharge data are subject to limitations, particularly for tracking sepsis, lower respiratory tract infections and sepsis seem to be important contributors to infectious disease hospitalizations. Prevention of infections that lead to sepsis and improvements in sepsis management would decrease the burden of infectious disease hospitalizations and improve outcomes, respectively.
Keywords: United States; epidemiology; hospitalizations; infectious disease.
Copyright © 2019 American College of Chest Physicians. All rights reserved.
Figures
References
-
- Armstrong GL, Conn LA, Pinner RW. Trends in infectious disease mortality in the United States during the 20th century. JAMA. 1999;281(1):61–66. - PubMed
-
- Centers for Disease Control and Prevention. Antibiotic resistance threats in the United States, 2013. https://www.cdc.gov/drugresistance/threat-report-2013/pdf/ar-threats-201....
MeSH terms
Grants and funding
LinkOut - more resources
Full Text Sources
Medical


