. 2019 Jul;9(7):910-925.
doi: 10.1158/2159-8290.CD-19-0125. Epub 2019 May 2.

The TP53 Apoptotic Network Is a Primary Mediator of Resistance to BCL2 Inhibition in AML Cells

Affiliations

The TP53 Apoptotic Network Is a Primary Mediator of Resistance to BCL2 Inhibition in AML Cells

Tamilla Nechiporuk et al. Cancer Discov. 2019 Jul.

Abstract

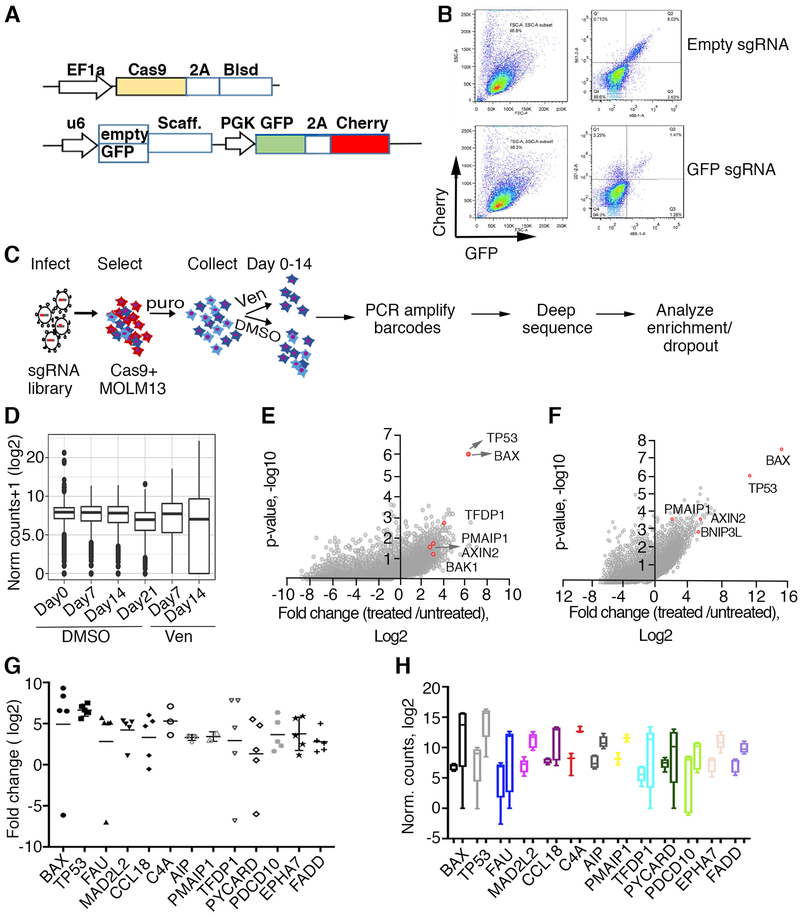
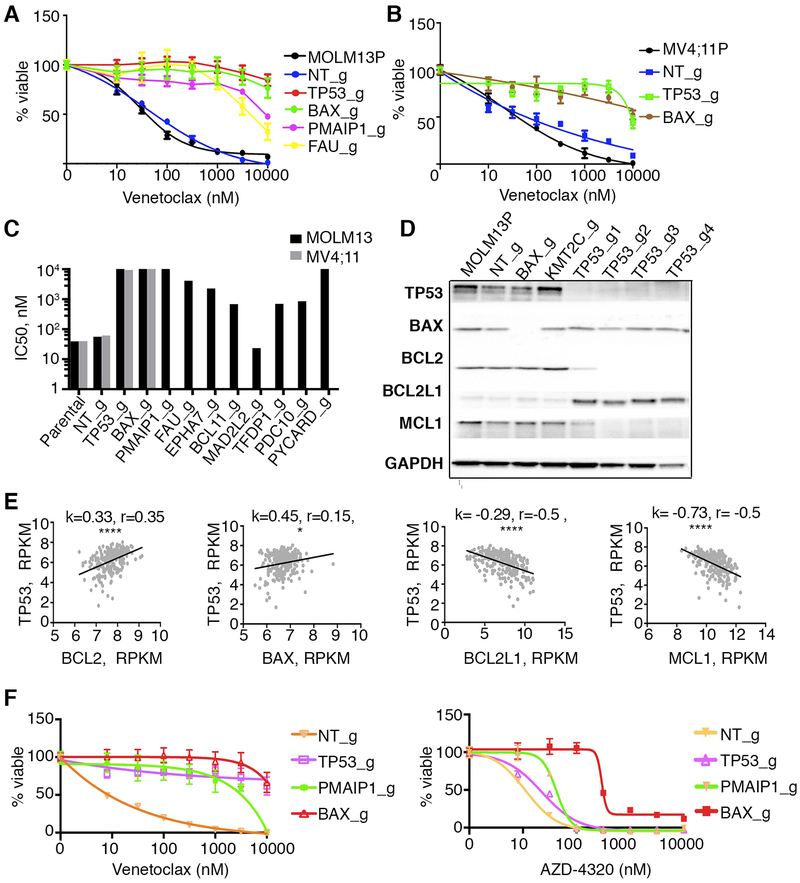
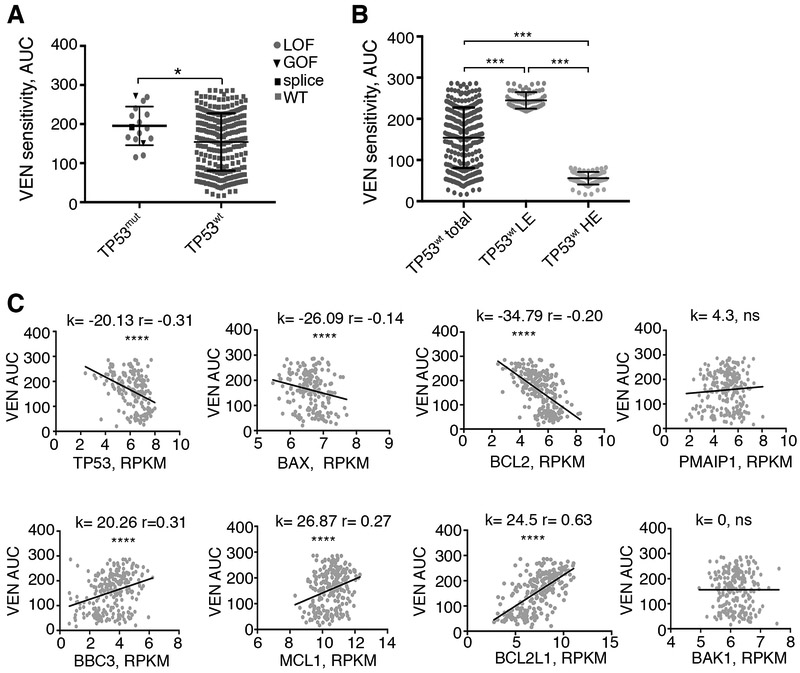
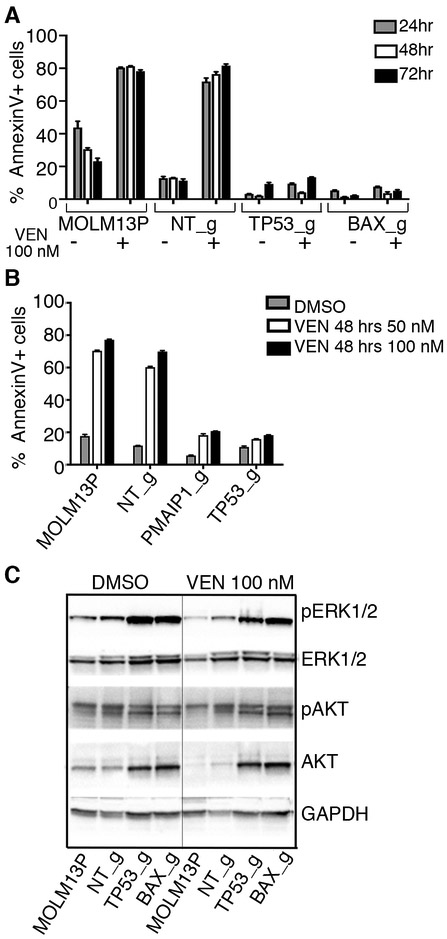
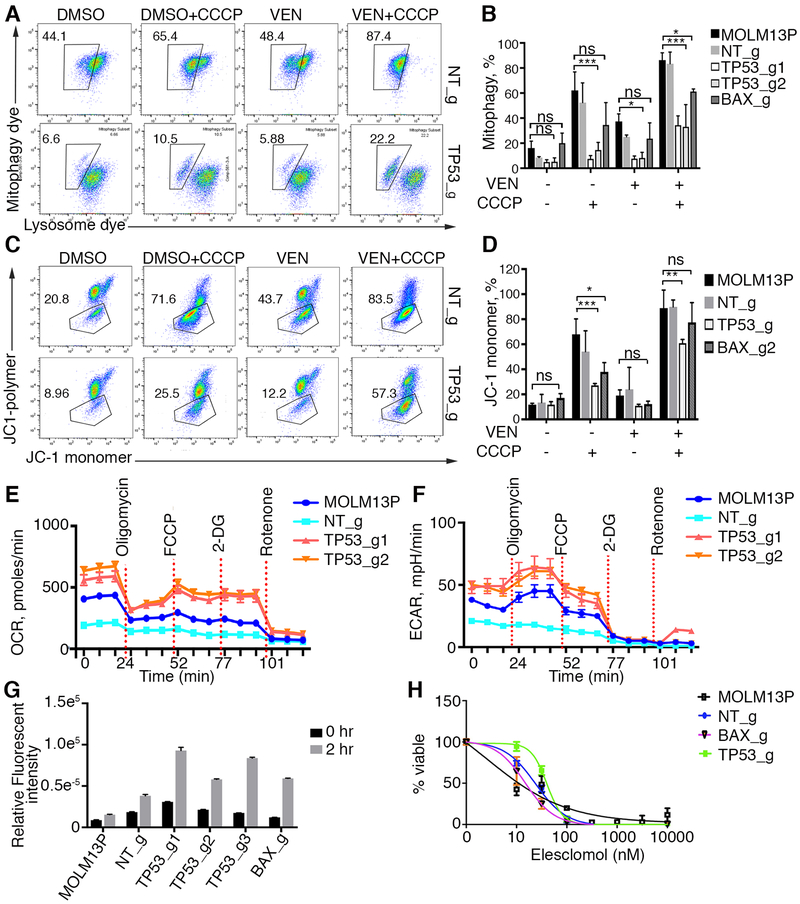
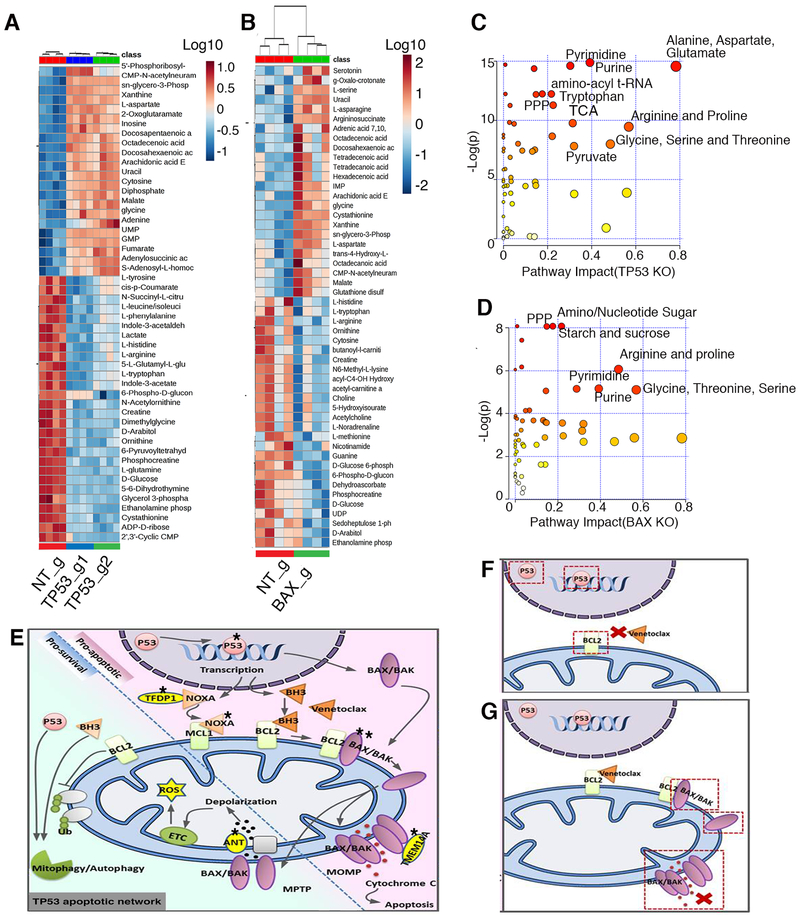
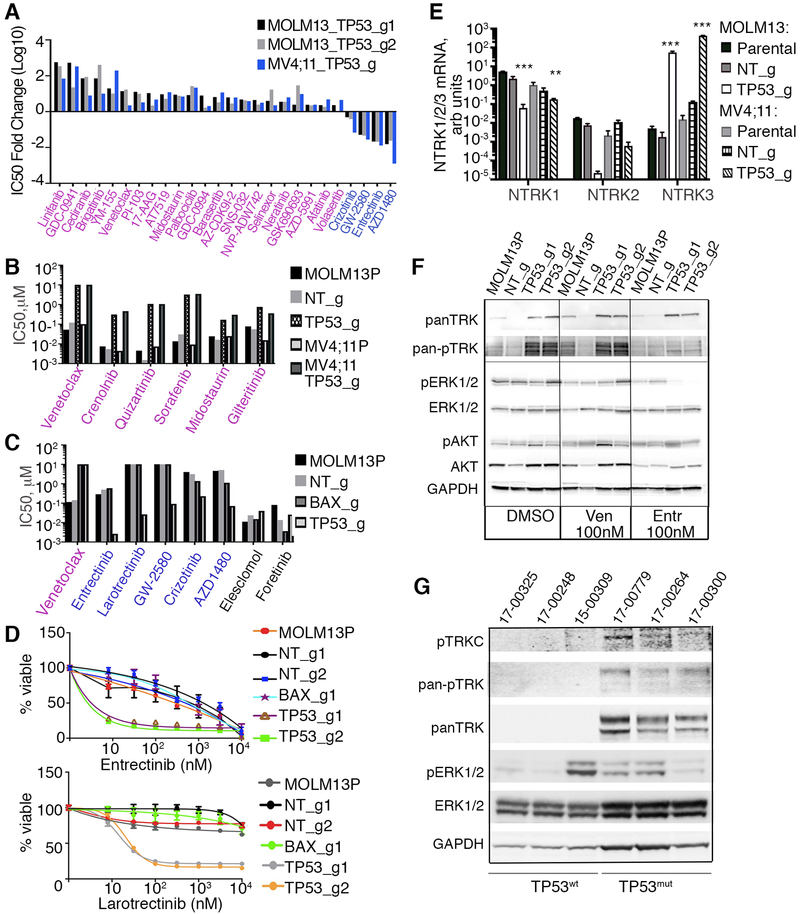
To study mechanisms underlying resistance to the BCL2 inhibitor venetoclax in acute myeloid leukemia (AML), we used a genome-wide CRISPR/Cas9 screen to identify gene knockouts resulting in drug resistance. We validated TP53, BAX, and PMAIP1 as genes whose inactivation results in venetoclax resistance in AML cell lines. Resistance to venetoclax resulted from an inability to execute apoptosis driven by BAX loss, decreased expression of BCL2, and/or reliance on alternative BCL2 family members such as BCL2L1. The resistance was accompanied by changes in mitochondrial homeostasis and cellular metabolism. Evaluation of TP53 knockout cells for sensitivities to a panel of small-molecule inhibitors revealed a gain of sensitivity to TRK inhibitors. We relate these observations to patient drug responses and gene expression in the Beat AML dataset. Our results implicate TP53, the apoptotic network, and mitochondrial functionality as drivers of venetoclax response in AML and suggest strategies to overcome resistance. SIGNIFICANCE: AML is challenging to treat due to its heterogeneity, and single-agent therapies have universally failed, prompting a need for innovative drug combinations. We used a genetic approach to identify genes whose inactivation contributes to drug resistance as a means of forming preferred drug combinations to improve AML treatment.See related commentary by Savona and Rathmell, p. 831.This article is highlighted in the In This Issue feature, p. 813.


Figures

Figure 1.
Figure 1.. Genome-wide CRISPR/Cas9 screen in AML cells identified TP53, BAX and other apoptosis network genes conferring sensitivity to venetoclax.
A. Schematic representation of lentiviral vectors described elsewhere in detail [31] and used for delivery and functional assay of Cas9. Top: Cas-9 expressing vector; Blsd, blasticidin selection gene, EF1a, intron-containing human elongation factor 1a promoter, Cas9, codon-optimized Streptococcus pyogenes double-NLS-tagged Cas9, 2A, Thosea asigna virus 2A peptides. Bottom: vector carrying dual fluorescent proteins; GFP and mCherry expressed from the PGK promoter, U6 denotes human U6 promoter driving GFP sgRNAs or empty cassette, Scaff denotes sgRNA scaffold. B. Functional assay for Cas9 activity in MOLM-13 cells transduced with virus carrying an empty sgRNA cassette (top) or sgRNA targeting GFP (bottom), assessed by flow cytometry 5 days post transduction. Note the significant decrease in GFP signal in the presence of sgRNA targeting GFP. C. Schematic representation of genome wide screen for drug resistance. The sgRNA library [31] was transduced into Cas9-expressing MOLM-13 cells, selected with puromycin for the integration of sgRNA-carrying virus for 5 days and DNA collected from cells exposed to venetoclax (1 μM) or vehicle (DMSO) for various time points (days 0, 7, 14, 21). sgRNA barcodes were PCR-amplified and subjected to deep sequencing to analyze for enrichment and/or dropout. D. Normalized counts of sgRNAs from collected DNA samples, median, upper and lower quartiles are shown for representative replicate samples. E, F. Enrichment effect in Y. Kosuke (E) and Brunello (F) library screens for loss-of-sensitivity to venetoclax. Fold change and corresponding p-values are plotted; genes representing significant hits in both libraries are highlighted in red. G. Enrichment extent plotted as fold change over control following venetoclax exposure (day 14) for the set of individual top hit sgRNAs per gene is shown (Y. Kosuke library). H. Box and whisker plots spanning min/max values of normalized counts for control (left boxes in each pair) and venetoclax treatment (right boxes in each pair) combined for all sgRNAs per gene. Top hits are shown.
Figure 2.
Figure 2.. A. Confirmation of genes conferring venetoclax resistance in MOLM-13 and MV4;11 cells and correlations with changes in apoptotic gene transcription in AML patients.
MOLM-13 (A) or MV4;11 (B) cells were transduced with lentiviruses carrying single sgRNA/Cas9 constructs targeting TP53, BAX, PMAIP1, FAU or control (non-targeting; NT_g). 10 days post transduction, venetoclax sensitivity was measured in triplicate by colorimetric MTS assay using a 7-point concentration range (10 nM to 10 μM). Percentages of viable cells, after normalization to untreated controls, were fit using non-linear regression analyses; mean and standard errors are shown. MOLM-13P, parental MOLM-13 cells. MV4;11P, parental MV4;11 cells. C. Histogram (log scale) summarizing IC50 estimates from triplicate measurements for venetoclax sensitivity in parental MOLM-13 (black shaded), parental MV4;11 cells (grey shaded) or cells transduced with indicated sgRNA/Cas9 viruses. D. Western blot analyses of proteins extracted from MOLM-13 cells, transduced with indicated sgRNA/Cas9 viruses and identified with antisera to BAX, BCL2, BCL2L1(BCLXL), MCL1 and GAPDH. Note: for TP53, four sgRNAs producing distinct knockout alleles were used to confirm changes in expression levels of BCL2, BCL2L1(BCLXL), and MCL1. sgRNA targeting KMT2C was used as an additional unrelated sgRNA control. E. Correlation of expression of TP53 and selected genes in an AML patient sample cohort (n=246; [40]. k, slopes generated by linear regression; r, Spearman coefficient; **, p<0.01; ****, p<0.0001. F. Sensitivity profiles of venetoclax (left) and AZD4320 (right) on MOLM13 cells transduced with lentiviruses carrying single sgRNA/Cas9 constructs targeting TP53, BAX, PMAIP1, and NT (non-targeting) control, measured as in panel A using a 7-point concentration range 8 nM to 10 μM.
Figure 3.
Figure 3.. Venetoclax sensitivity in AML patients inversely correlates with TP53 mutations and low expression of TP53 and BAX.
A. Comparison of VEN sensitivity between TP53 mutant (TP53mut, n=16) and TP53 WT (TP53wt, n=282) patient samples (Mann-Whitney, two-tailed). Within TP53 mutant groups, circles, triangles and square symbols denote loss of function (LOF), gain of function (GOF), and splice variants correspondingly. B. Comparison of VEN sensitivity between the lowest expressing (LE, n=71) and highest expressing (HE, n=71) quartiles for TP53 in wild type patient samples. Median expression levels for both LE and HE groups differ significantly from the median expression levels in all samples (ANOVA with Tukey post test). C. Correlation between gene expression levels from AML patient samples for the indicated genes and venetoclax sensitivities represented by AUC (n=246; [40]). k, slope values generated by linear regression; r, Spearman coefficient. *, p<0.05; ***, p<0.001 ****; p<0.0001; ns, not significant.
Figure 4.
Figure 4.. Cells with loss-of-function alleles for TP53, PMAIP1 or BAX have diminished apoptosis in response to venetoclax treatment.
A and B. Sensitivities to venetoclax in MOLM-13 parental cells (MOLM13P) and MOLM13 cells with sgRNA inactivated alleles, as indicated, was assessed by flow cytometry after staining with the early apoptosis marker, Annexin V, following 24, 48 and 72 hrs of exposure to venetoclax. Histogram represents mean and standard deviation for three replicates of percentage Annexin V+ cells in the total cell population. C. Western blot analysis of proteins extracted from MOLM-13 parental and MOLM-13 cells transduced with indicated sgRNA/Cas9 viruses and treated overnight with 100 nM venetoclax or vehicle (DMSO), and identified with antisera to phosphorylated ERK1/2 (Thr202/Tyr204, pERK1/2), ERK1/2, phosphorylated AKT (Thr308), AKT and GAPDH.
Figure 5.
Figure 5.. Cells with TP53 and BAX inactivation are resistant to mitochondrial stress induced by venetoclax and mitochondrial uncouplers.
A. Flow cytometry analyses of MOLM-13 non-targeting and MOLM-13 TP53 KO cells for mitophagy with and without initial 2 hr stimulation with 100 nM venetoclax and/or CCCP. 10,000 cells were analyzed. Box drawn around doubly stained brighter cells with mitophagy dye is a result of acidification of the mitophagy dye in lysosomes after fusion with damaged mitochondria. B. Histogram of mitophagy experiments (n=3). Statistical significance determined by ANOVA with Tukey post test. Note that number of mitochondria fused to lysosomes is significantly less in MOLM-13 cells with TP53 knockout (TP53_g) and BAX (BAX_g) relative to control parental and nontargeting (NT_g) cells in the presence of uncoupler CCCP with and without venetoclax (VEN). * denotes p<0.05; ** denotes p,0.01; ***denotes p<0.001; ns denotes not significant. C. Flow cytometry analyses of mitochondrial depolarization. Percentage of cells with depolarized mitochondria in response to mitochondrial uncoupler CCCP is shown (boxed region: green-fluorescent cells representing monomer form of cationic carbocyanine dye JC-1 in depolarized cells). Red-fluorescent cells represent polymeric form of JC-1 in hyperpolarized cells. Note protection against depolarization in TP53 and BAX KO cells. D. Histogram of experiments shown in C (n=3) with 10,000 cells analyzed per sample. Statistical significance determined by ANOVA with Tukey post test. * denotes p<0.05; ** denotes p,0.01; ***denotes p<0.001; ns denotes not significant. E, F. Analyses of oxygen consumption rate (OCR) and extracellular acidification rates (ECAR) using Seahorse assay (n=3). G. Measurement of Reactive Oxygen Species (ROS) using 2’,7’–dichlorofluorescin diacetate (DCFDA, Abcam) substrate as an indicator of oxidation inside the cell detected by conversion to fluorescent DCF compound. Note higher rate of reactive oxygen species in TP53 and BAX KO cells (n=6). H. Cell viability assay in response to elesclomol.
Figure 6.
Figure 6.. Metabolic changes in TP53 and BAX KO cells are indicative of increased cell proliferation.
A, B. Global metabolomics profile of MOLM-13 TP53 (A) and BAX KO (B) cells. Metabolomic analysis was performed on samples in quadruplicate. Top 50 changed metabolites are shown. C, D. Pathway analysis of metabolites with differential abundance dot plot for MOLM13 TP53 (C) and BAX KO (D) cells. Red to yellow color gradient indicates higher to lower statistical significance, circle size is proportional to the percent of impacted metabolites within the pathway. E. Summary of genes identified by the CRISPR/Cas9 screen impacting mitochondrial homeostasis, energy production, apoptosis and venetoclax response. Star symbol indicates identified genes (TP53 (p53), TFDP1 (DP-1), NOXA (PMAIP1), BAX/BAK, TMEM14A, SLC25A6(ANT3). Mechanisms of venetoclax resistance in cells with inactivation of TP53 (F), or BAX (G). Inactivation of TP53 leads to perturbation in expression of pro-survival proteins, including BCL2, the primary venetoclax target. Inactivation of BAX leads to inability to build effective MOMP during apoptosis, induced by venetoclax.
Figure 7.
Figure 7.. Cells with loss-of-function alleles for TP53 or BAX have altered sensitivities to small molecule inhibitors of various signaling pathways.
A. MOLM-13 and MV4;11 cells, transduced with indicated sgRNAs/Cas9 viruses, were screened with a panel of inhibitors targeting various molecular pathways and assessed using the drug screening method described in Figure 2A. Fold changes in IC50 values, (log10 scale) for those inhibitors concordant across both cells lines relative to nontargeting controls are shown. B. Analyses of FLT3 inhibitor sensitivities, in MOLM-13 and MV4;11 parental and KO cells, as indicated. Drug sensitivity was measured as described in Figure 2A, with IC50 estimated from triplicates. C. Histogram of sensitivities (IC50 values) to a series of NTRK inhibitors in MOLM-13 cells, transduced with indicated sgRNAs/Cas9 viruses. D. Drug sensitivity to NTRK inhibitors entrectinib (top) and larotrectinib (bottom) as measured in Figure 2A and 2F, in MOLM-13 cells transduced with indicated sgRNAs/Cas9 viruses. E. Expression levels of NTRK1, 2, and 3 mRNA using qRT-PCR analysis with RNAs isolated from MOLM-13 and MV4;11 cells with TP53 KO alleles or non-targeting (NT) control. Expression values were normalized to 36B4 gene expression levels. Statistical significance was determined ANOVA with Tukey posttest (**, p<0.01; ***, p<0.001). F. Western blot analyses of proteins extracted from MOLM-13 parental and MOLM-13 transduced with TP53 sgRNA/Cas9 viruses and treated overnight with venetoclax (Ven, 100 nM), entrectinib (Entr, 100 nM) or vehicle (DMSO), and identified with antisera to pan NTRK, phosphorylated NTRK (Tyr516), phosphorylated ERK1/2 (Thr202/Tyr204), ERK1/2, phosphorylated AKT(Thr308), AKT and GAPDH. G. Western blot analyses of proteins from AML patient samples with known TP53 mutant (TP53mut) or WT (TP53wt) status. Samples 17-00248 and 15-00309 have FLT3-ITD mutations; sample 17-00300 has a FLT3D835E mutation.

References

    1. Hanahan D and Weinberg RA, Hallmarks of cancer: the next generation. Cell, 2011. 144(5): p. 646–74. - PubMed
    1. Llambi F and Green DR, Apoptosis and oncogenesis: give and take in the BCL-2 family. Curr Opin Genet Dev, 2011. 21(1): p. 12–20. - PMC - PubMed
    1. Hata AN, Engelman JA, and Faber AC, The BCL2 Family: Key Mediators of the Apoptotic Response to Targeted Anticancer Therapeutics. Cancer Discov, 2015. 5(5): p. 475–87. - PMC - PubMed
    1. Letai AG, Diagnosing and exploiting cancer’s addiction to blocks in apoptosis. Nat Rev Cancer, 2008. 8(2): p. 121–32. - PubMed
    1. Khoo KH, Verma CS, and Lane DP, Drugging the p53 pathway: understanding the route to clinical efficacy. Nat Rev Drug Discov, 2014. 13(3): p. 217–36. - PubMed

Publication types

MeSH terms