. 2019 Jul;9(7):890-909.
doi: 10.1158/2159-8290.CD-19-0117. Epub 2019 May 2.

Targeting Mitochondrial Structure Sensitizes Acute Myeloid Leukemia to Venetoclax Treatment

Affiliations

Targeting Mitochondrial Structure Sensitizes Acute Myeloid Leukemia to Venetoclax Treatment

Xufeng Chen et al. Cancer Discov. 2019 Jul.

Abstract

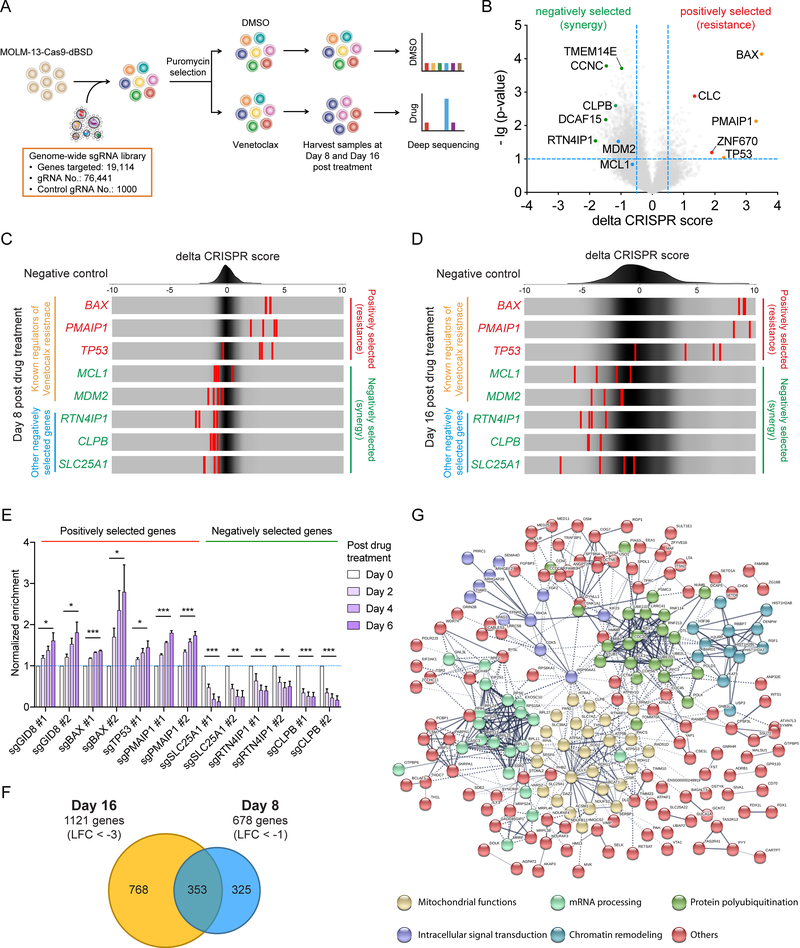
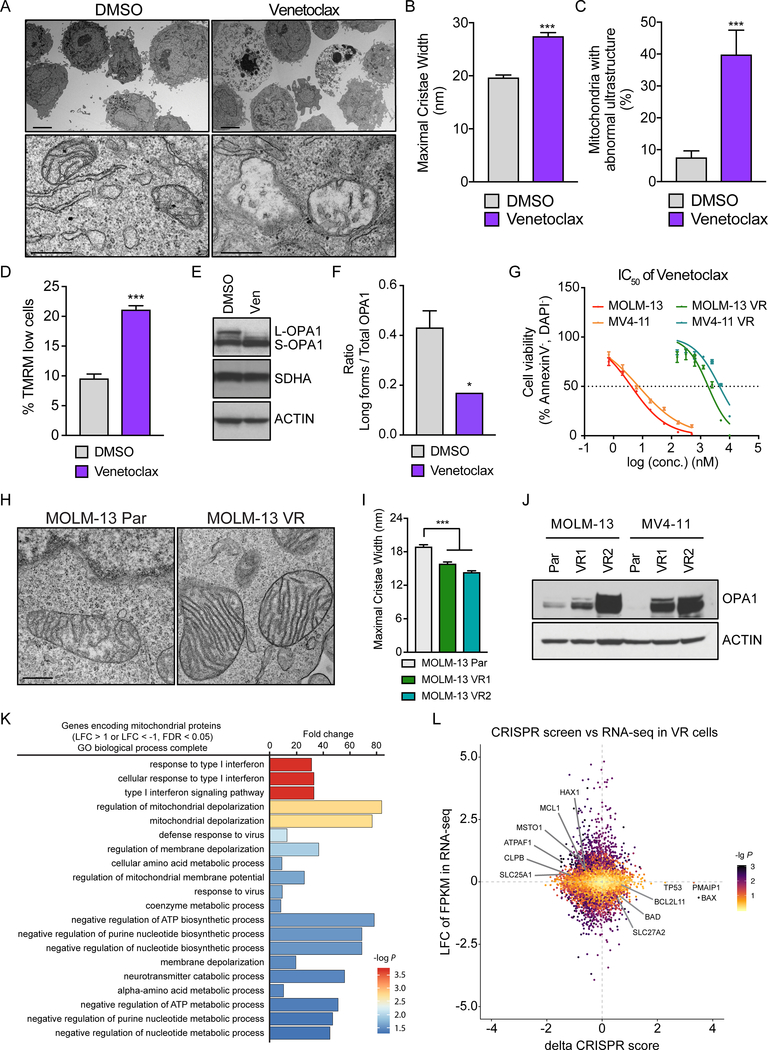
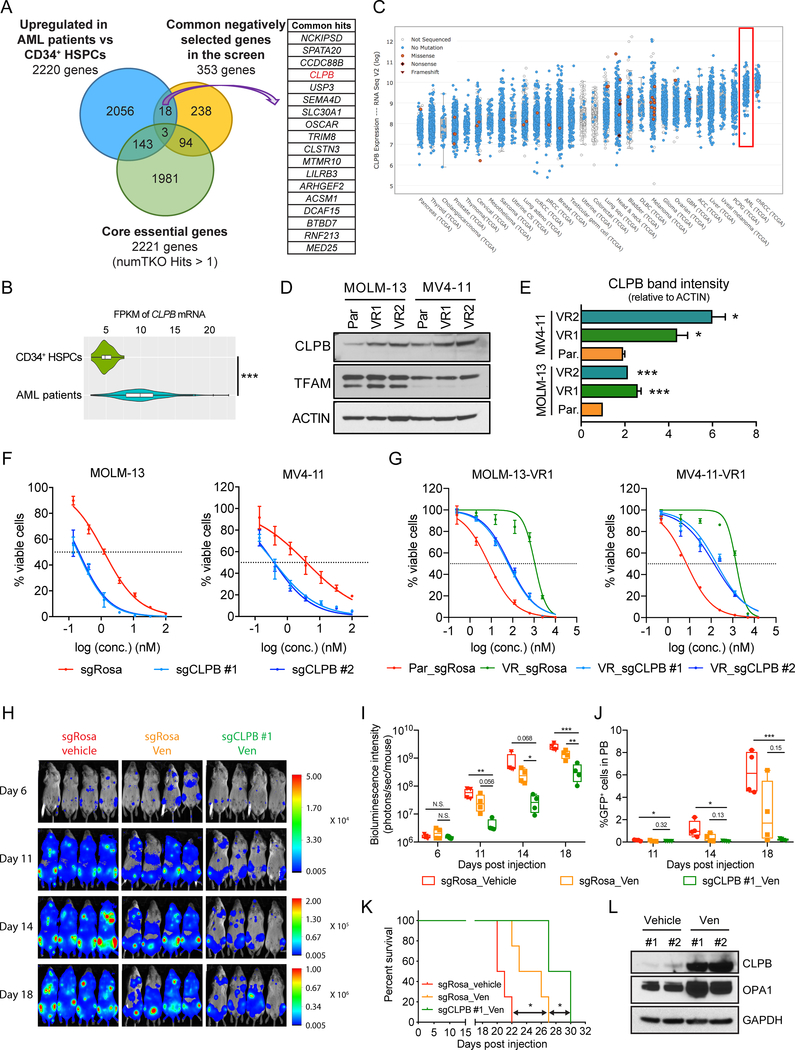
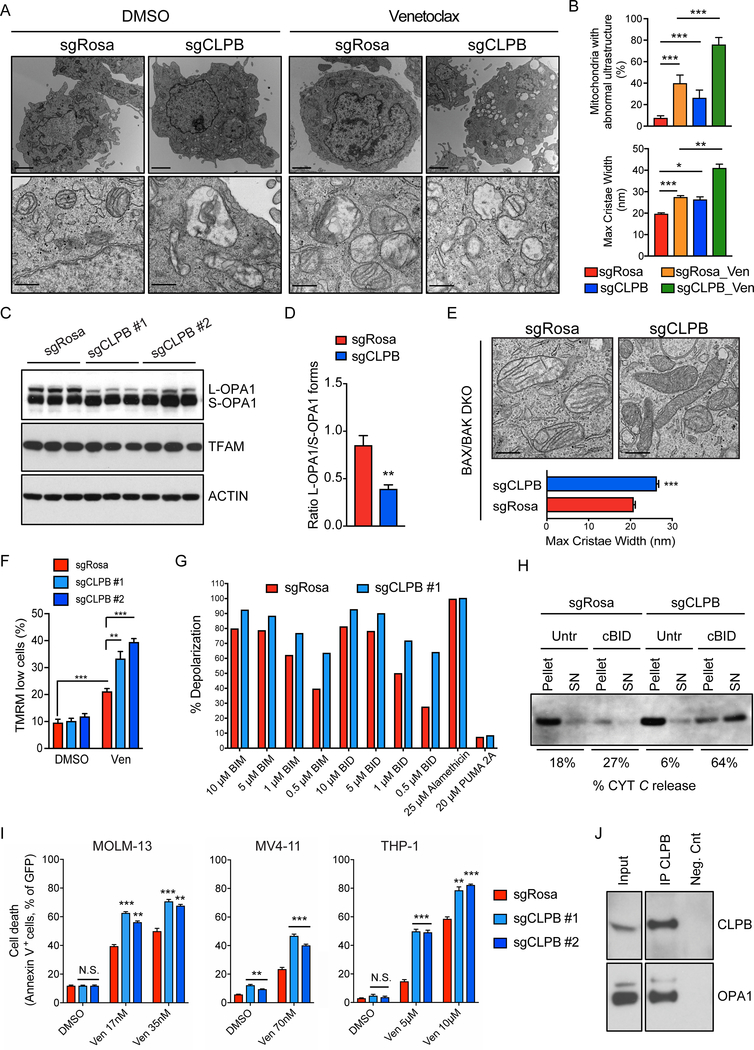
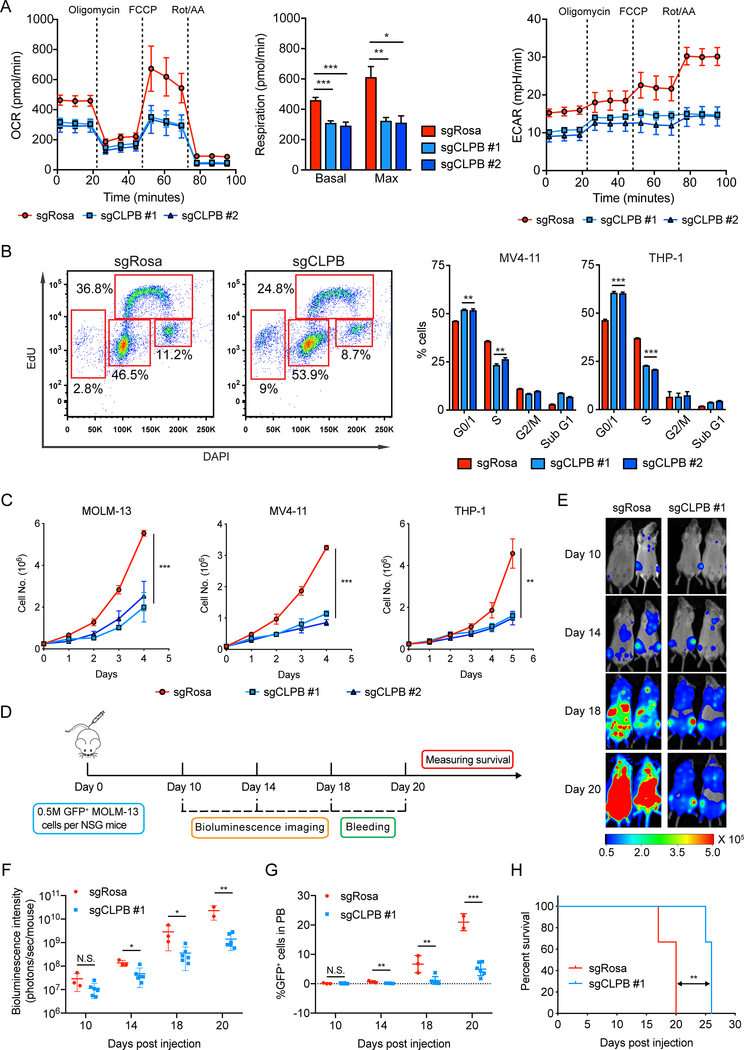
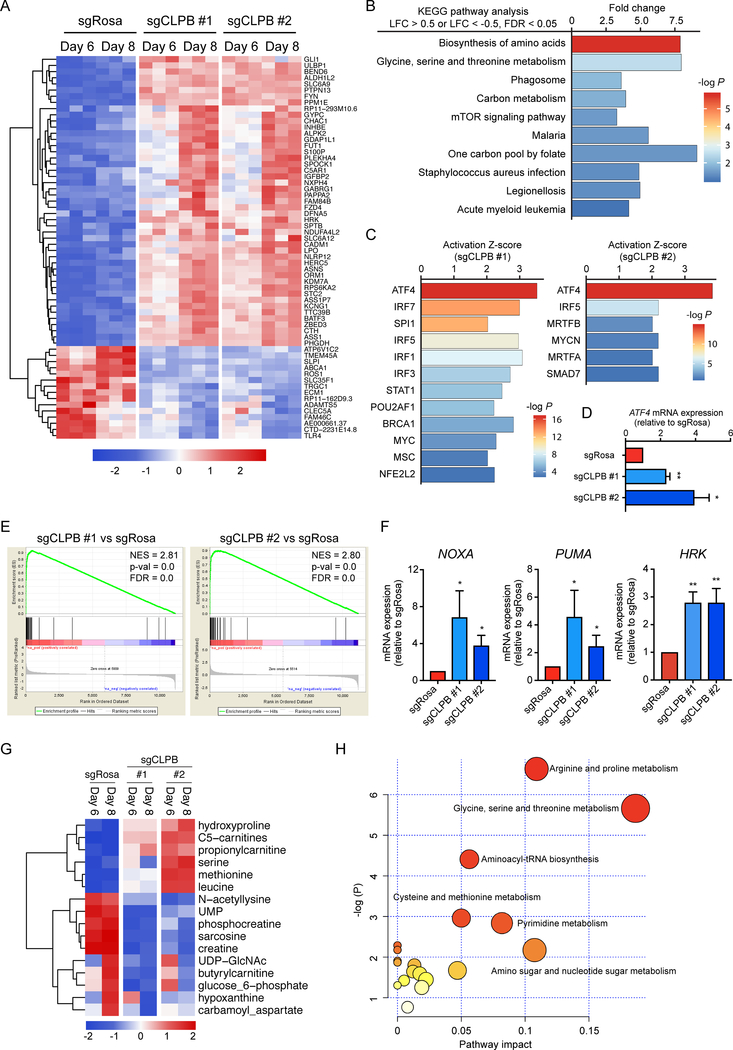
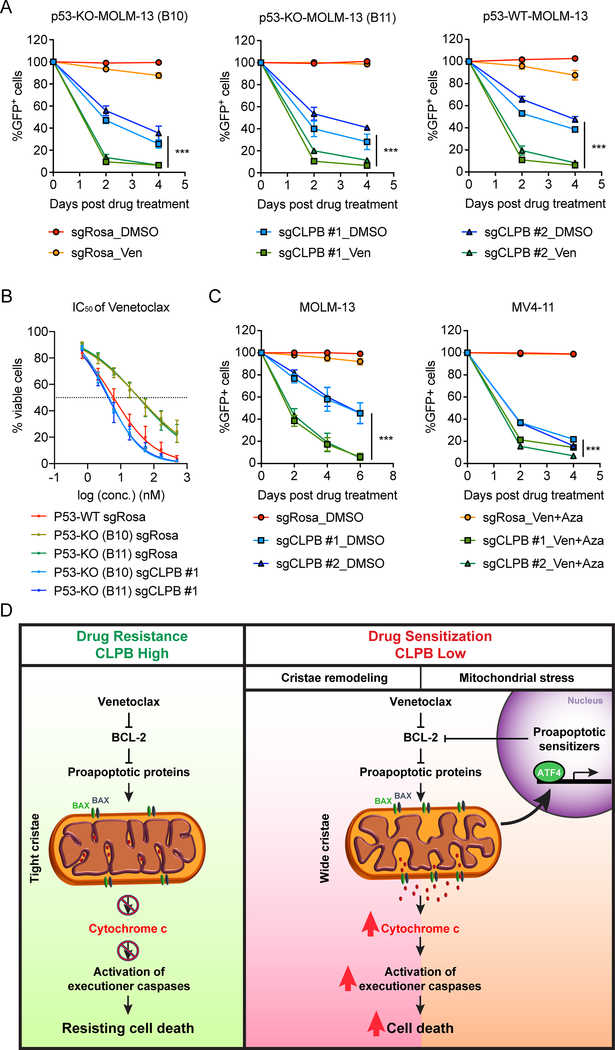
The BCL2 family plays important roles in acute myeloid leukemia (AML). Venetoclax, a selective BCL2 inhibitor, has received FDA approval for the treatment of AML. However, drug resistance ensues after prolonged treatment, highlighting the need for a greater understanding of the underlying mechanisms. Using a genome-wide CRISPR/Cas9 screen in human AML, we identified genes whose inactivation sensitizes AML blasts to venetoclax. Genes involved in mitochondrial organization and function were significantly depleted throughout our screen, including the mitochondrial chaperonin CLPB. We demonstrated that CLPB is upregulated in human AML, it is further induced upon acquisition of venetoclax resistance, and its ablation sensitizes AML to venetoclax. Mechanistically, CLPB maintains the mitochondrial cristae structure via its interaction with the cristae-shaping protein OPA1, whereas its loss promotes apoptosis by inducing cristae remodeling and mitochondrial stress responses. Overall, our data suggest that targeting mitochondrial architecture may provide a promising approach to circumvent venetoclax resistance. SIGNIFICANCE: A genome-wide CRISPR/Cas9 screen reveals genes involved in mitochondrial biological processes participate in the acquisition of venetoclax resistance. Loss of the mitochondrial protein CLPB leads to structural and functional defects of mitochondria, hence sensitizing AML cells to apoptosis. Targeting CLPB synergizes with venetoclax and the venetoclax/azacitidine combination in AML in a p53-independent manner.See related commentary by Savona and Rathmell, p. 831.This article is highlighted in the In This Issue feature, p. 813.


Conflict of interest statement

Conflicts of interest

R.T. was an advisory board member for AbbVie. No potential conflicts of interest are disclosed by other authors.

Figures

Figure 1.
Figure 1.. Genome-wide CRISPR screen identifies genes controlling mitochondrial physiology as synthetic lethal with Venetoclax treatment in AML
A. Schematic outline of the viability-based, genome wide CRISPR/Cas9 loss-of-function screen. B. Volcano plot showing both positively and negatively selected genes in the CRISPR screen at day 8 post drug treatment. A number of positively and negatively selected genes are shown in red and green, respectively. Known regulators of Venetoclax resistance are shown in orange (positively selected) and blue (negatively selected), respectively. C-D. Frequency histograms of the delta CRISPR score of the negative control guides (top), and selected genes at day 8 (C) and day 16 (D) post drug treatment. E. Validation of selected genes in the CRISPR screen using a competition-based survival assay in MOLM-13. The normalized enrichment scores were calculated as shown in supplementary Fig. S1C. Data represent mean ± SEM (n=4 for each sgRNA). F. Venn diagram of the negatively selected genes (“sensitizers”) in the CRISPR screen at day 8 (Log fold change < −1) and day 16 (Log fold change < −3) post drug treatment. G. STRING protein–protein interaction network of the 353 common negatively selected genes as defined in (F). The minimum required interaction score was set to 0.5, and the disconnected dots were removed. k-means clustering was applied with the number of clusters set to 6.
Figure 2.
Figure 2.. Mitochondrial response upon Venetoclax treatment and after acquisition of drug resistance
A. Representative electron micrographs of THP-1 treated with 4 μM Venetoclax or DMSO for 16 hrs. Scale bars represent 5 μm (upper panel) and 0.5 μm (lower panel). B. Quantification of the maximal cristae width in 60 randomly selected mitochondria from 15 cells in experiments as in (A) (n= 200 cristae per condition). Data represent mean ± SEM of 3 independent experiments. C. Quantification of the percentage of mitochondria with abnormal ultrastructure in experiments as in (A) (n= 100 mitochondria per condition). Data represent mean ± SEM of 3 independent experiments. D. Quantification of the membrane potential loss after staining with TMRM in THP-1 cells treated with 4 μM Venetoclax or DMSO for 16 hrs. Data represent mean ± SD (n=3). E-F. THP-1 were treated with 4 μM Venetoclax for 16 hrs and equal amounts (30 μg) of cell lysates were separated by SDS-PAGE and immunoblotted using the indicated antibodies (E). L-OPA1, long forms of OPA1; S-OPA1, short forms of OPA1. The bar plot (F) shows the quantitative densitometric analysis of the ratio of long OPA1 forms to the total OPA1. Data represent mean ± SEM of 3 independent experiments. G. IC50 curves of Venetoclax in parental or Venetoclax-resistant (VR) AML cell lines. Data represent mean ± SD (n=3 for each cell line). H. Representative electron micrographs of mitochondria from parental (Par.) or Venetoclax-resistant (VR) MOLM-13. Scale bar represents 0.5 μm. I. Quantification of the maximal cristae width in 60 randomly selected mitochondria from 15 cells in experiment as in (H) (n= 282 cristae per condition). Data represent mean ± SEM. J. Western blot analysis in cell lysates from parental (Par.) or Venetoclax-resistant (VR) AML cell lines. K. Gene Ontology analysis of differentially expressed genes involved in mitochondrial processes in Venetoclax-resistant cells (MOLM-13 VR1) compared to the parental cell line (Log fold change > 1 or < −1, FDR < 0.05). L. Scatter plot presenting the delta CRISPR score (Fig. 1B) plotted against the Log fold change from MOLM-13 VR RNA-seq (supplementary Fig. S3A). Colors correspond to the common -log (p-value) which was generated using the geometric mean of the CRISPR screen p-value and the RNA-Seq FDR. Selected genes are highlighted. Data with statistical significance are as indicated, *p< 0.05, ***p< 0.001.
Figure 3.
Figure 3.. Targeting the mitochondrial protein CLPB synergizes with Venetoclax in AML
A. Venn diagram of the 353 common negatively selected genes (“sensitizers”) throughout the screen, the 2221 core essential genes defined by Hart et al. (17) as well as 2220 genes which are upregulated in AML patients compared to healthy CD34+ HSPCs. Among these, 18 genes (listed in the table) were found non-essential and upregulated in AML patients. B. Violin plot of CLPB mRNA expression level (FPKM) from RNA-sequencing in TCGA AML patients (200 patients) and normal human CD34+ HSPCs (6 healthy donors). C. CLPB mRNA expression levels across diverse cancers from TCGA (log2 FPKM). Sorted by median expression level. D-E. Western blotting (D) and quantitative densitometric analysis (E) of CLPB protein levels of whole cell lysates from parental (Par.) and Venetoclax-resistant (VR) AML cell lines. F-G. IC50 curves of Venetoclax in parental AML cells (F) and Venetoclax-resistant (VR) AML cells (G) transduced with CLPB sgRNAs or negative control (sgRosa). Transduced AML cells were selected with puromycin and then treated with Venetoclax for 48 hours. Viable cells were measured by Cell-TiterGlo. Data represent mean ± SD (n=3 for each group). H. Bioluminescent images of mice transplanted with MOLM-13 cells transduced with sgRosa or sgCLPB #1. Mice were administrated with vehicle or Venetoclax (Ven) from day 6 to day 20 post transplantation as described in supplementary Fig. S5E. The same mice are depicted at each time-point (n=4 mice per group). I. Quantification of bioluminescence emitted from the whole body of each mouse described in (H) at the indicated time points. J. Flow cytometry analysis of GFP+ sgRNA-expressing leukemia cells in peripheral blood of MOLM-13 leukemia recipient mice described in (H) at the indicated time points. K. Kaplan-Meier survival curves of the MOLM-13 leukemia recipient mice described in (H). The p-values were determined using Log rank Mantel-Cox test. L. Western blotting in whole cell lysates from sorted GFP+ sgRosa-expressing leukemia cells in the bone marrow of MOLM-13 leukemia recipient mice treated with vehicle or Venetoclax (Ven), as described in (H). Animals were sacrificed when they showed signs of late stage leukemia. Data with statistical significance are as indicated, *p< 0.05, **p< 0.01, ***p< 0.001, N.S., not significant.
Figure 4.
Figure 4.. CLPB loss induces mitochondrial ultrastructure defects sensitizing AML cells to mitochondria-mediated cell death
A. Representative electron micrographs of THP-1 transduced with sgRNAs targeting CLPB or control (sgRosa) and treated with 4 μM Venetoclax or DMSO for 16 hrs. Scale bars represent 2 μm (upper panel) and 500 nm (lower panel). B. Quantification of the percentage of mitochondria with abnormal ultrastructure in experiments as in (A) (n= 100 mitochondria per condition; upper panel). Quantification of the maximal cristae width in 60 randomly selected mitochondria from 15 cells in experiments as in (A) (n= 200 cristae per condition; lower panel). C. Equal amounts (30 μg) of protein from THP-1 infected with sgRNAs targeting CLPB or control (sgRosa) were separated by SDS-PAGE and immunoblotted using the indicated antibodies. D. Quantitative densitometric analysis of the ratio of OPA1 long (L-OPA1) versus short (S-OPA1) forms in experiments as in (C). Data represent mean ± SEM of 8 independent experiments. E. Representative electron micrographs and morphometric analysis of BAX/BAK double-knockout MOLM-13 cells transduced with sgRNAs targeting CLPB or control (sgRosa). Scale bars represent 500 nm. Morphometric analysis was performed in 60 randomly selected mitochondria (n= 200 cristae per condition) in two independent experiments. F. Quantification of the membrane potential loss after staining with TMRM in THP-1 infected with sgRNAs targeting CLPB or control (sgRosa) and treated with 4 μM Venetoclax or DMSO for 16 hours. Data represent mean ± SD (n=3 for each group). G. BH3 profiling: Mitochondrial depolarization measured by JC-1 in permeabilized THP-1 transduced with sgRosa or sgCLPB upon stimulation with BIM and BID peptides. Depolarization (%) was calculated based on the area under the curve for each condition and normalized to CCCP positive control and 1% DMSO as negative control as previously described (48). H. Isolated mitochondria from THP-1 transduced as indicated were treated with recombinant cBID for 30 min and centrifuged at 12.000 x g for 10 min. Pellet and supernatant (SN) of each sample were separated with SDS-PAGE and immunoblotted for cytochrome c (cyt c). % Cyt c release is calculated as the percentage of the supernatant to the total (pellet and supernatant) cytochrome c band intensity. I. AML cells were transduced with sgRNAs targeting CLPB or control (Rosa), treated with Venetoclax or DMSO for 16 hrs and cell death was determined by flow cytometry using Annexin V. Data represent mean ± SD (n=3). J. Liver mitochondrial lysates were immunoprecipitated with anti-CLPB coupled to magnetic Protein-G beads. Co-precipitated proteins were separated by SDS-PAGE and immunoblotted against CLPB and OPA1. Input was diluted 1:10. Data with statistical significance are as indicated, *p< 0.05, **p< 0.01, ***p< 0.001, N.S., not significant.
Figure 5.
Figure 5.. CLPB ablation leads to cell growth suppression in AML in vitro and in vivo
A. Oxygen consumption rate (OCR), respiration (bar plot) and extracellular acidification rate (ECAR) of wild-type and CLPB-knockout MOLM-13 determined by Seahorse Extracellular Flux Analysis. Data represent mean ± SEM (n=5). B. Representative flow cytometry plots showing EdU cell cycle analysis of wild-type and CLPB knockout MV4–11 (left panel). Bar charts depict the mean percentage of cell populations ± SD (n=3) in MV4–11 or THP-1 AML cells (right panel). C. Cell growth analysis of AML cells transduced with sgRNAs targeting CLPB or control (sgRosa) (mean ± SD, n=3). D. Schematic outline of the mouse model of CLPB dependency in AML. E. Bioluminescent images of mice transplanted with MOLM-13 cells transduced with sgRosa (n=3) or sgCLPB #1 (n=6). Representative images of two mice per sgRNA construct are shown. The same mice are depicted at each time-point. F. Quantification of bioluminescence emitted from the whole body of each mouse transduced with sgRosa or sgCLPB #1 construct at the indicated time points. G. Flow cytometry analysis of GFP+ sgRNA-expressing leukemia cells in peripheral blood of MOLM-13 leukemia recipient mice at indicated time points. H. Kaplan-Meier survival curves of recipient mice transduced with sgRosa and sgCLPB #1 are plotted. The p-values were determined using Log rank Mantel-Cox test. Data with statistical significance are as indicated, *p< 0.05, **p< 0.01, ***p< 0.001, N.S., not significant.
Figure 6.
Figure 6.. CLPB deficiency amplifies proapoptotic signals by inducing mitochondrial stress response
A. Heatmap showing the differentially expressed genes in MOLM-13 transduced with sgRNAs targeting CLPB or control (sgRosa) at day 6 and day 8 post transduction (Log fold change > 1 or < −1, False Discovery Rate < 0.05 in all samples). Common genes are shown in the heatmap. B. KEGG pathway enrichment analysis of the differentially expressed genes in MOLM-13 transduced with sgRNAs targeting CLPB or control (sgRosa) at day 6 post transduction. C. Ingenuity Pathway Analysis of the differentially expressed genes (Log fold change > 1 or < −1, False Discovery Rate < 0.05 in all samples) in MOLM-13 transduced with two independent sgRNAs targeting CLPB (left panel, sgCLPB #1; right panel, sgCLPB #2) or control (sgRosa) at day 6 post transduction revealing activation of the ATF4 upstream pathway. D. qPCR analysis of ATF4 transcripts in MOLM-13 transduced with sgRNAs targeting CLPB or control (sgRosa) (mean ± SEM, n=3). E. Enrichment score plots from Gene-set enrichment analysis (GSEA) using the mitochondrial stress expression signature defined by Quirós et al (30) and the RNA-Seq data of MOLM-13 transduced with sgRNAs targeting CLPB or control (sgRosa) at day 6 post transduction. FDR, false discovery rate; NES, normalized enrichment score. F. qPCR analysis of the relative expression levels of NOXA (PMAIP1) mRNA, PUMA (BBC3) mRNA and HRK mRNA in MOLM-13 transduced with CLPB-targeting sgRNAs or control (sgRosa) at day 6 post transduction (mean ± SD, n=3). G. Heatmap showing the significantly differentially detected metabolites in MOLM-13 transduced with two independent sgRNAs targeting CLPB or control (sgRosa) at day 6 or day 8 post transduction (p < 0.05). Average intensity of each metabolite was shown. H. Metabolome pathway enrichment analysis of top altered metabolites in (G). Data with statistical significance are as indicated, *p< 0.05, **p< 0.01.
Figure 7.
Figure 7.. CLPB targeting overcomes p53-mediated Venetoclax resistance and sensitizes AML cells to combined Venetoclax and Azacitidine treatment
A. Synergistic effect of CLPB depletion and BCL-2 inhibition in TP53-knockout (KO) MOLM-13 cell lines (two clones, B10 and B11) generated as shown in Supplementary Fig. S9. Plotted are GFP+ percentages measured during 4 days in culture and normalized to Day 0 of drug treatment. Negative control (sgRosa) and two independent sgRNAs targeting CLPB are shown in the graphs. Data represent mean ± SD (n=4). B. IC50 curves of Venetoclax in p53 wild-type (WT) and p53-deficient (KO) (two clones, B10 and B11) MOLM-13 cells transduced with sgCLPB #1 or sgRosa. Transduced AML cells were selected with puromycin and then treated with Venetoclax for 48 hours. Viable cells were measured by Cell-TiterGlo. Data represent mean ± SD (n=6 for each group). C. Validation of the synergistic effect of CLPB depletion and Venetoclax + Azacitidine combined treatment using a competition-based survival assay in MOLM-13 (left) and MV4–11 (right) cells. Plotted are GFP+ percentages measured during 6 days (for MOLM-13) or 4 days (for MV4–11) in culture and normalized to Day 0 of drug treatment. Negative control (sgRosa) and two independent sgRNAs targeting CLPB are shown in the graphs. Data represent mean ± SD (n=6 for MOLM-13 and n=3 for MV4–11). D. Schematic outline of this study. Targeting the mitochondrial CLPB sensitizes AML cells to Venetoclax treatment by 1) promoting apoptotic cristae remodeling and 2) inducing mitochondrial stress response which will amplify the programmed cell death pathway. Data with statistical significance are as indicated, ***p< 0.001.

Comment in

Similar articles

Cited by

References

    1. Campos L, Rouault JP, Sabido O, Oriol P, Roubi N, Vasselon C, et al. High expression of bcl-2 protein in acute myeloid leukemia cells is associated with poor response to chemotherapy. Blood. 1993;81:3091–6. - PubMed
    1. Lagadinou ED, Sach A, Callahan K, Rossi RM, Neering SJ, Minhajuddin M, et al. BCL-2 inhibition targets oxidative phosphorylation and selectively eradicates quiescent human leukemia stem cells. Cell Stem Cell. 2013;12:329–41. - PMC - PubMed
    1. Tzifi F, Economopoulou C, Gourgiotis D, Ardavanis A, Papageorgiou S, and Scorilas A. The Role of BCL2 Family of Apoptosis Regulator Proteins in Acute and Chronic Leukemias. Adv Hematol. 2012;2012:524308. - PMC - PubMed
    1. Chao DT and Korsmeyer SJ. BCL-2 family: regulators of cell death. Annu Rev Immunol. 1998;16:395–419. - PubMed
    1. Antignani A and Youle RJ. How do Bax and Bak lead to permeabilization of the outer mitochondrial membrane? Curr Opin Cell Biol. 2006;18:685–9. - PubMed

Publication types

MeSH terms