. 2020 Jan 31;105(2):498-507.
doi: 10.3324/haematol.2019.219881. Print 2020.

Structural analysis of ischemic stroke thrombi: histological indications for therapy resistance

Affiliations

Structural analysis of ischemic stroke thrombi: histological indications for therapy resistance

Senna Staessens et al. Haematologica. .

Abstract

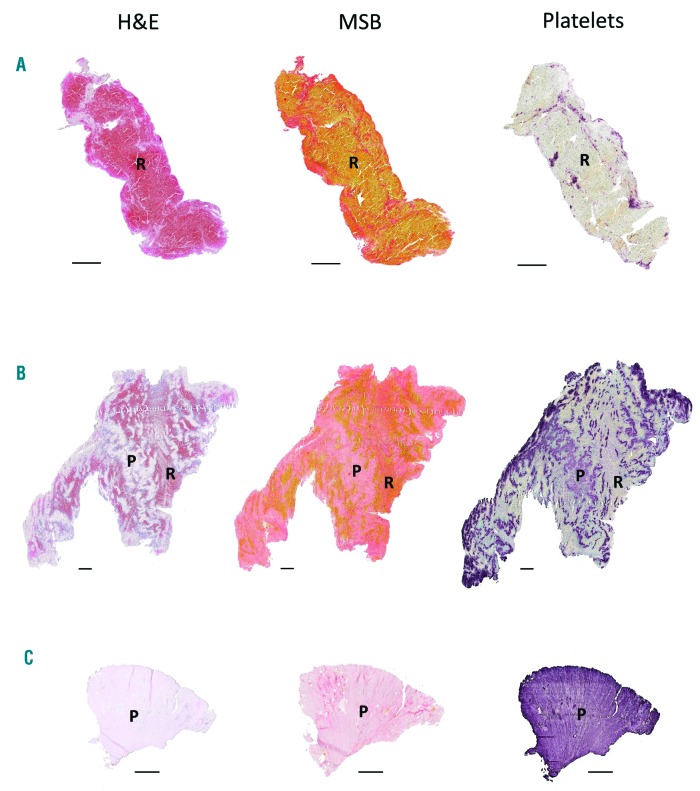
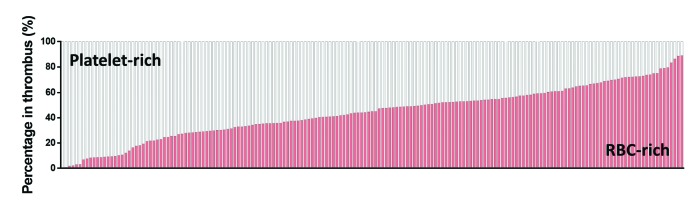
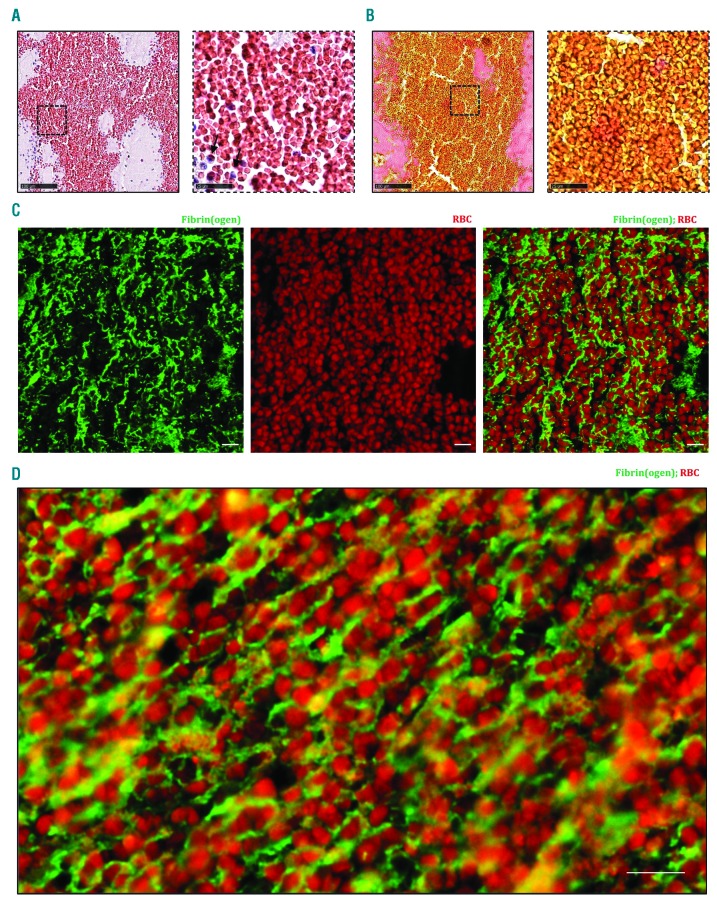
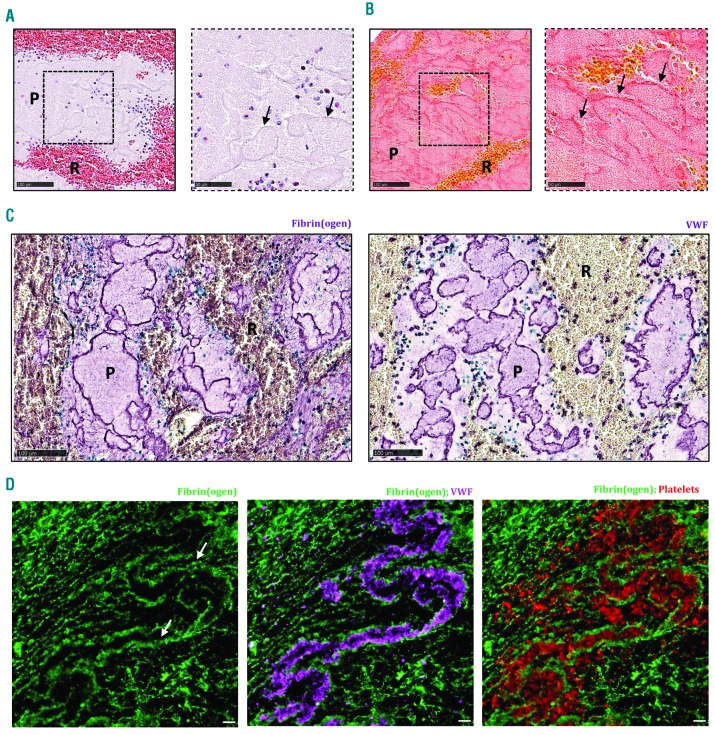
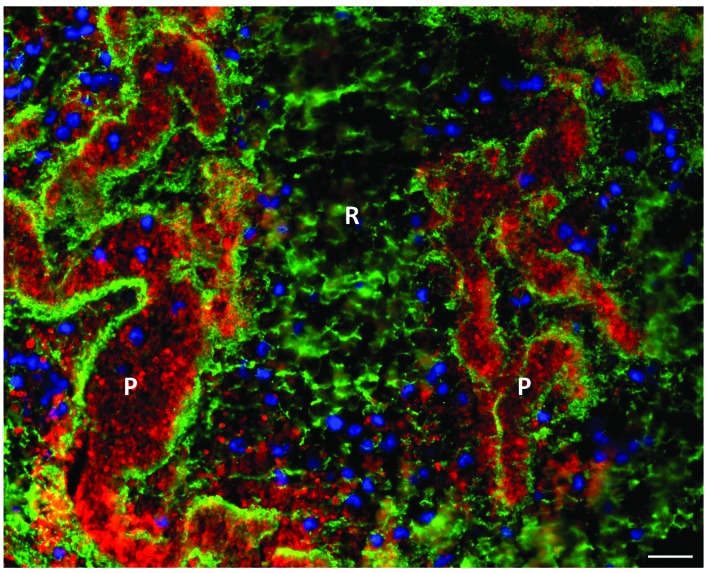
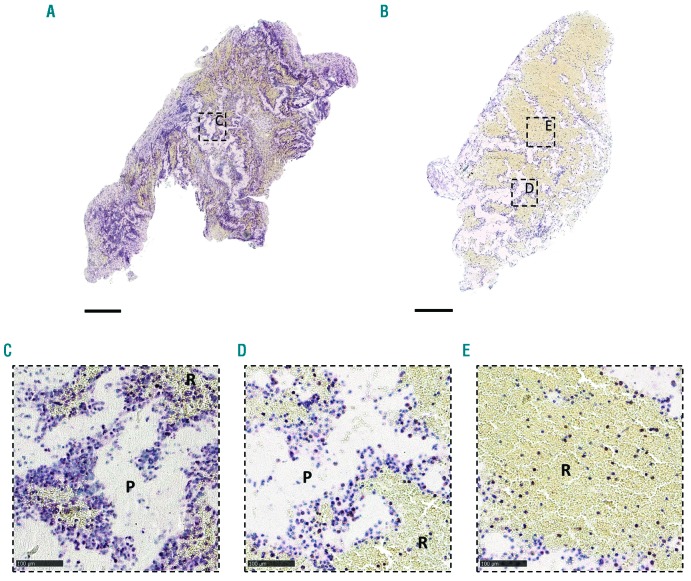
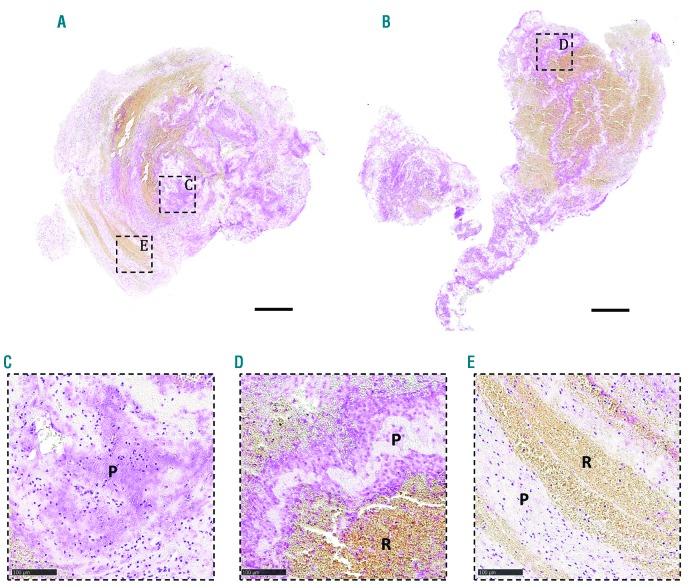
Ischemic stroke is caused by a thromboembolic occlusion of cerebral arteries. Treatment is focused on fast and efficient removal of the occluding thrombus, either via intravenous thrombolysis or via endovascular thrombectomy. Recanalization, however, is not always successful and factors contributing to failure are not completely understood. Although the occluding thrombus is the primary target of acute treatment, little is known about its internal organization and composition. The aim of this study, therefore, was to better understand the internal organization of ischemic stroke thrombi on a molecular and cellular level. A total of 188 thrombi were collected from endovascularly treated ischemic stroke patients and analyzed histologically for fibrin, red blood cells (RBC), von Willebrand factor (vWF), platelets, leukocytes and DNA, using bright field and fluorescence microscopy. Our results show that stroke thrombi are composed of two main types of areas: RBC-rich areas and platelet-rich areas. RBC-rich areas have limited complexity as they consist of RBC that are entangled in a meshwork of thin fibrin. In contrast, platelet-rich areas are characterized by dense fibrin structures aligned with vWF and abundant amounts of leukocytes and DNA that accumulate around and in these platelet-rich areas. These findings are important to better understand why platelet-rich thrombi are resistant to thrombolysis and difficult to retrieve via thrombectomy, and can guide further improvements of acute ischemic stroke therapy.


Figures

Figure 1.
Figure 1.
Stroke thrombi typically consist of distinct red blood cell (RBC)-rich and platelet-rich areas. Consecutive thrombus sections were stained with Hematoxylin & Eosin (H&E), Martius Scarlet Blue (MSB) and an anti-platelet GPIbα antibody. Classical H&E staining (left) was used to visualize overall thrombus composition and organization. On H&E staining, RBC-rich areas appear red whereas RBC-poor areas appear light pink. On MSB staining (middle), red areas show the presence of fibrin, whereas RBC appear yellow. Platelets were stained purple using an anti-GPIbα antibody (right). Overall, stroke thrombi consist of two distinct areas: RBC-rich areas (R), and platelet-rich areas (P). Examples of representative thrombi are shown, which are RBC-rich/platelet-poor (A), mixed (B), and RBC-poor/platelet-rich (C). Scale = 500 mm.
Figure 2.
Figure 2.
General stroke thrombus composition. Stroke thrombi (n=177, vertical bars) were quantitatively analyzed and the percentage of red blood cell (RBC)-rich areas (red) and platelet-rich areas (white) were determined. Thrombus composition ranges from very platelet-rich to very RBC-rich areas, with almost all thrombi containing significant amounts of both areas.
Figure 3.
Figure 3.
Red blood cell (RBC)-rich areas are composed of densely packed RBC in a fibrin network. Hematoxylin & Eosin (H&E) staining (A) and Martius Scarlet Blue (MSB) staining (B) show the abundance of RBC with little or no nucleated cells (black arrows), appearing red in H&E staining and yellow in MSB staining. Fibrin is stained red in MSB staining. (A and B, right panels) Magnification of the area indicated in the left panel. Occasional presence of nucleated cells in RBC-rich areas (blue on H&E) is observed. (C and D) Immunofluorescent staining was performed to specifically visualize fibrin(ogen) (green) and RBC (autofluorescence, red). RBC are found within a network of fibrin(ogen). Scale bars are: (A and B, left panels) 100 mm; (A and B, right panels) 25 mm; (C and D) 10 mm.
Figure 4.
Figure 4.
Platelet-rich areas consist of dense fibrin structures lined with von Willebrand Factor (vWF) and filled with platelets. Hematoxylin & Eosin (H&E) staining (A) and Martius Scarlet Blue (MSB) staining (B) show the presence of dense fibrin structures, indicated by the black arrows, within platelet-rich areas. (C) Immunohistochemical staining was used to specifically visualize fibrin(ogen) (left panel, purple) and vWF (right panel, purple). (D) Immunofluorescence analysis allowed to visualize fibrin (green), vWF (purple), and platelets (red). Dense fibrin structures (white arrows) are lined with vWF and filled with platelets. Scale bars are: (A and B, left panels, and C) 100 μm; (A and B, right panels) 25 mm; (D) 10 mm. P: platelet-rich area; R: RBC-rich area.
Figure 5.
Figure 5.
Immunofluorescent overview picture of red blood cell (RBC)-rich and platelet-rich areas. Immunofluorescent analysis was used to visualize fibrin(ogen) (green), platelets (red), and nuclei (blue). RBC-rich areas consist of thin fibrin strands and RBC (not stained), whereas platelet-rich areas consist of dense fibrin structures packed with platelets. Nucleated cells were mainly found near platelet-rich areas. Scale bar = 20 mm. P: platelet-rich area; R: RBC-rich area.
Figure 6.
Figure 6.
Leukocytes accumulate in platelet-rich areas and at the interface between platelet-rich and red blood cell (RBC)-rich areas. Stroke thrombi were immunohistochemically analyzed for leukocytes (purple). (A and B) Two representative images of stroke thrombi stained for leukocytes. (C-E) Magnifications show that leukocytes tend to accumulate in platelet-rich areas (C) or at the boundary between platelet-rich and RBC-rich areas (D), whereas leukocytes are homogenously spread within RBC-rich areas (E). Scale bars are: (A and B) 500 mm; (C-E) 100 mm. P: platelet-rich area; R: RBC-rich area.
Figure 7.
Figure 7.
Extracellular DNA accumulates in platelet-rich areas and on the interface between platelet-rich and red blood cell (RBC)-rich areas. Stroke thrombi were stained using a Feulgen’s reaction to visualize intra (nuclei) and extracellular (smears) DNA (pink). (A and B) Two representative images of stroke thrombi stained for DNA. (C-E) Magnifications show that extracellular DNA tends to accumulate within platelet-rich areas (C) or at the boundary between platelet-rich and RBC-rich areas (D). No extracellular DNA is observed in RBC-rich areas (E). Scale bar: (A and B) 500 μm; (C-E) 100 mm. P: platelet-rich area; R: RBC-rich area.

Comment in

References

    1. Aguiar de Sousa D, von Martial R, Abilleira S, et al. Access to and delivery of acute ischaemic stroke treatments: A survey of national scientific societies and stroke experts in 44 European countries. Eur Stroke J. 2019;4(1):13–28. - PMC - PubMed
    1. Prabhakaran S, Ruff I, Bernstein RA. Acute Stroke Intervention: A Systematic Review. JAMA. 2015;313(14):1451–1462. - PubMed
    1. Vanacker P, Lambrou D, Eskandari A, et al. Improving the Prediction of Spontaneous and Post-thrombolytic Recanalization in Ischemic Stroke Patients. J Stroke Cerebrovasc Dis. 2015;24(8):1781–1786. - PubMed
    1. Berkhemer OA, Fransen PSS, Beumer D, et al. A randomized trial of intraarterial treat ment for acute ischemic stroke. N Engl J Med. 2015;372(1):11–20. - PubMed
    1. Riedel CH, Zimmermann P, Ulf J-K, Stingele R, Deuschl G, Jansen O. The importance of size: successful recanalization by intravenous thrombolysis in acute anterior stroke depends on thrombus length. Stroke. 2011;42(6):1775–1777. - PubMed

Publication types