

Antibody Fab-Fc properties outperform titer in predictive models of SIV vaccine-induced protection
- PMID: 31048360
- PMCID: PMC6497031
- DOI: 10.15252/msb.20188747
Antibody Fab-Fc properties outperform titer in predictive models of SIV vaccine-induced protection
Abstract
Characterizing the antigen-binding and innate immune-recruiting properties of the humoral response offers the chance to obtain deeper insights into mechanisms of protection than revealed by measuring only overall antibody titer. Here, a high-throughput, multiplexed Fab-Fc Array was employed to profile rhesus macaques vaccinated with a gp120-CD4 fusion protein in combination with different genetically encoded adjuvants, and subsequently subjected to multiple heterologous simian immunodeficiency virus (SIV) challenges. Systems analyses modeling protection and adjuvant differences using Fab-Fc Array measurements revealed a set of correlates yielding strong and robust predictive performance, while models based on measurements of response magnitude alone exhibited significantly inferior performance. At the same time, rendering Fab-Fc measurements mathematically independent of titer had relatively little impact on predictive performance. Similar analyses for a distinct SIV vaccine study also showed that Fab-Fc measurements performed significantly better than titer. These results suggest that predictive modeling with measurements of antibody properties can provide detailed correlates with robust predictive power, suggest directions for vaccine improvement, and potentially enable discovery of mechanistic associations.
Keywords: HIV; antibody effector function; biomarker identification; protection modeling; systems serology.
© 2019 The Authors. Published under the terms of the CC BY 4.0 license.
Conflict of interest statement
The authors declare that they have no conflict of interest.
Figures
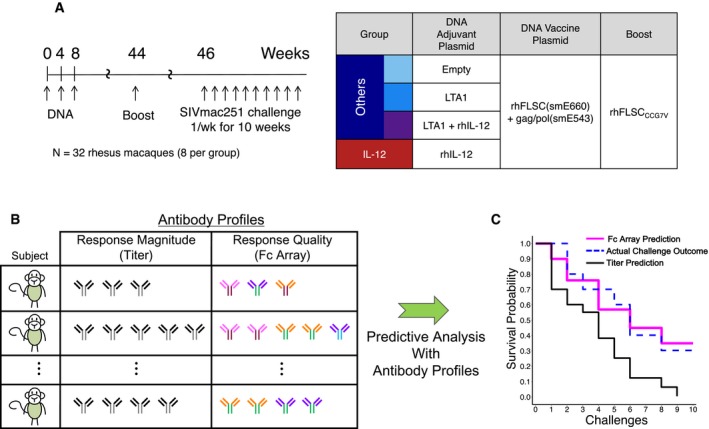
Overview of the vaccine regimen (adapted from Fouts et al, 2015).
Antibody profiles of subjects are assayed, post‐vaccination but pre‐challenge, capturing either response magnitude alone (quantity, titer) or Fab and Fc properties (quality, Fc Array). These profiles are input into a predictive analysis framework that trains models to predict a subject's risk of infection based on antibody profile.
The accuracy of the models is evaluated by making predictions for subjects not used in model training and comparing observed infection rates (blue dashed) to predictions, according to the models based on the two different antibody profile types (Fc Array in pink and titer in black).

The predicted survival probabilities in the final model closely match observed KM curves for the IL‐12 adjuvanted group (red) and for the others (blue). Log‐rank tests indicate insignificant difference between predicted (solid) and observed (dashed) curves. n = 8 for IL‐12 and n = 24 for Others.
The predicted relative risk of infection for each animal in the representative eightfold cross‐validation run (relative to mean at 0, horizontal dashed line) closely matches observed challenge data (concordance (C)‐index). The colors represent the adjuvant groups (groupID) as shown in the central legend box to the right side of panel (D).
Animals in the IL‐12 adjuvanted group (red) have significantly lower predicted risk of infection than those in the combined other groups (blues) in the representative eightfold cross‐validation run (Wilcoxon–Mann–Whitney). n = 8 for IL‐12 and n = 24 for Others. The colors represent the adjuvant groups (groupID) as shown in the central legend box to the right side of panel (D). The horizontal line in the box represents the median, the upper and lower limits represent the 3rd and 1st quartiles respectively, and the whiskers extends from the upper/lower limit to the highest/lowest value that is within 1.5 * (interquartile range) of the limit.
The approach is robust, with models trained on actual data consistently obtaining high C‐indices (100 repetitions of eightfold cross‐validation yield mean 0.73 ± 0.02) and significantly (tail probability) and substantially (Cliff's Δ) outperforming those trained on permuted data (0.61 ± 0.08) and baseline C‐index for random prediction (0.5).
A small set of features (columns) contribute to the final model (coefficients in bars; top panel), with one predictive of risk and three of protection (Cox PH P‐values: **P < 0.01; *P < 0.05; ‐, not significant). The individual animals (rows) are colored by adjuvant group and ordered in ascending order of time‐to‐infection.
Substitution analysis reveals co‐correlates of the features from the final model (E), dominated by Gag specificities as well as ability to bind C1q.
- A–F
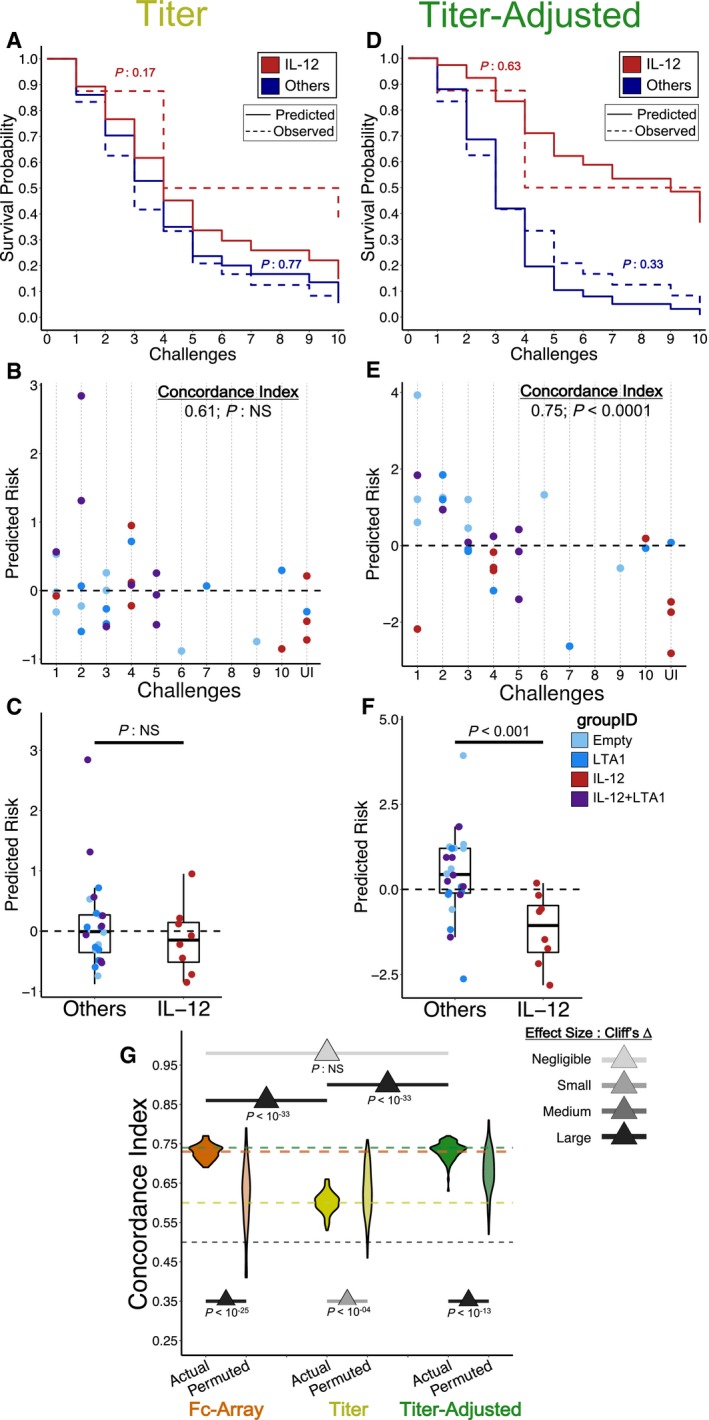
Models were trained using either (A–C) titer features or (D–F) titer‐adjusted features. (A & D) Observed KM curves and predicted survival probabilities. The predicted (solid) curves for the model using titer features (A) are significantly different from the observed (dashed) ones, while those for the model using titer‐adjusted features (D) are not (log‐rank test). (B & E) Observed time‐to‐infection versus predicted risk of infection according to representative eightfold cross‐validation runs. Predictions from the titer‐adjusted model (E) are much more concordant with observation (C‐index) than those from the titer model (B). (C & F) Group‐wise differences in predicted risk of infection from the representative eightfold cross‐validation runs. The titer model (C) does not predict the observed difference in protection between groups (Wilcoxon–Mann–Whitney), while the titer‐adjusted one does (F). n = 8 for IL‐12 and n = 24 for Others.
- G
C‐indices from repeated cross‐validation and permutation testing, using the three different sets of features. Titer‐adjusted data maintain substantial (Cliff's Δ) difference between using the actual data and the permuted data. There are also significant (tail probability) and substantial (Cliff's Δ) differences between titer‐only cross‐validation results and others, but not between the original Fc Array data and titer‐adjusted data. The pair‐wise comparison between actual models using three feature sets was done by measuring the tail probability of the mean of one distribution with respect to the other. The horizontal lines represent the mean C‐index for each data type and for random prediction (0.5). One hundred repetitions of 8‐fold cross‐validation.
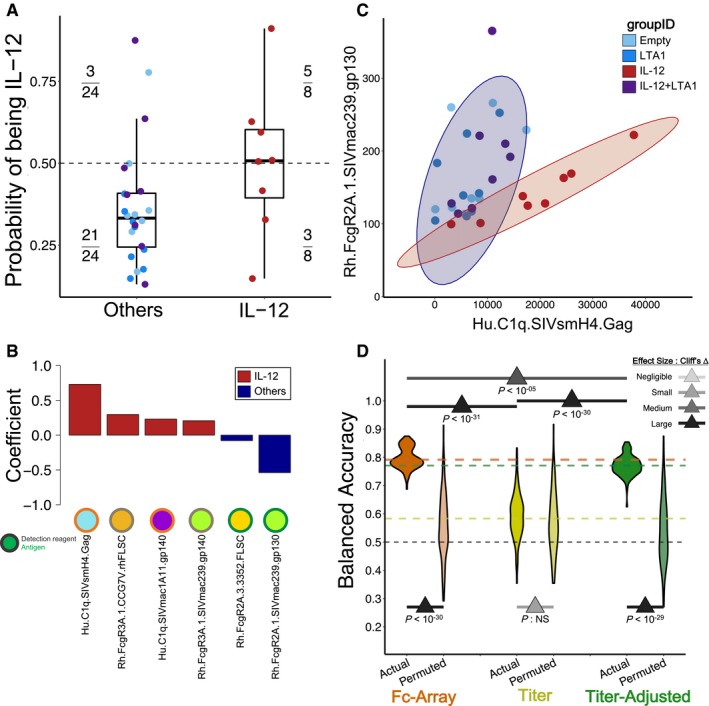
Predicted probability of being in the IL‐12 group according to the binomial logistic classifier in the representative eightfold cross‐validation run. Three animals (points, colored by group) from the combined other adjuvant groups are predicted to be members of the IL‐12 group (above the 0.5 decision boundary, dashed line), and likewise 3 out of 8 IL‐12 animals are misclassified as belonging to the “others” group. n = 8 for IL‐12 and n = 24 for Others.
The final model classified animals into groups based on a linear combination of a small set of features associated with the IL‐12 group (positive coefficients, red) vs. others (negative, blue).
Two of the features in the final model clearly separate the other groups.
Classifiers obtain robust performance using the original Fc Array features or the titer‐adjusted features, but not the titer‐only features, as revealed by tests of significance (tail probabilities) and magnitude (Cliff's Δ) in results from repeated cross‐validation and from permutation. The pair‐wise comparison between actual models using three feature sets was done by measuring the tail probability of the mean of one distribution with respect to the other. One hundred repetitions of 8‐fold cross‐validation.
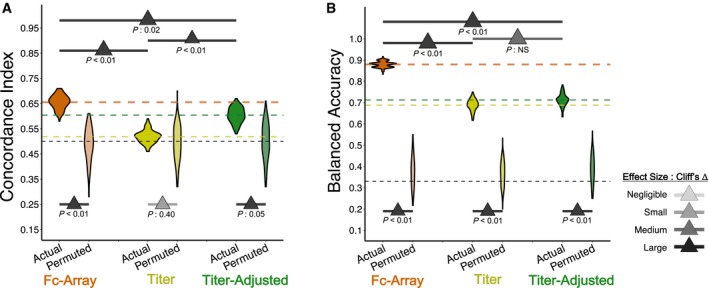
C‐indices from repeated cross‐validation and permutation testing, using the three different sets of features. The original and titer‐adjusted Fc Array data maintain substantial (Cliff's Δ) differences between using the actual data and the permuted data. Their performance is also significantly (tail probability) and substantially (Cliff's Δ) better than that for titer‐only models. The horizontal lines represent the mean C‐index for each feature set and for random prediction (0.5).
Classifiers are all better than random (comparing models with permuted data), but those with Fc Array data are significantly (tail probability) and substantially (Cliff's Δ) better than those with titer‐only and titer‐adjusted data, which show a significant drop in performance.
References
-
- Abraham B, Baine Y, De‐Clercq N, Tordeur E, Gerard PP, Manouvriez PL, Parenti DL (2002) Magnitude and quality of antibody response to a combination hepatitis A and hepatitis B vaccine. Antiviral Res 53: 63–73 - PubMed
Publication types
MeSH terms
Substances
Grants and funding
LinkOut - more resources
Full Text Sources
Research Materials
