. 2019 Jun 21;294(25):9666-9678.
doi: 10.1074/jbc.RA119.007866. Epub 2019 May 2.

Mechanism of cognate sequence discrimination by the ETS-family transcription factor ETS-1

Affiliations

Mechanism of cognate sequence discrimination by the ETS-family transcription factor ETS-1

Kenneth Huang et al. J Biol Chem. .

Abstract

Functional evidence increasingly implicates low-affinity DNA recognition by transcription factors as a general mechanism for the spatiotemporal control of developmental genes. Although the DNA sequence requirements for affinity are well-defined, the dynamic mechanisms that execute cognate recognition are much less resolved. To address this gap, here we examined ETS1, a paradigm developmental transcription factor, as a model for which cognate discrimination remains enigmatic. Using molecular dynamics simulations, we interrogated the DNA-binding domain of murine ETS1 alone and when bound to high-and low-affinity cognate sites or to nonspecific DNA. The results of our analyses revealed collective backbone and side-chain motions that distinguished cognate versus nonspecific as well as high- versus low-affinity cognate DNA binding. Combined with binding experiments with site-directed ETS1 mutants, the molecular dynamics data disclosed a triad of residues that respond specifically to low-affinity cognate DNA. We found that a DNA-contacting residue (Gln-336) specifically recognizes low-affinity DNA and triggers the loss of a distal salt bridge (Glu-343/Arg-378) via a large side-chain motion that compromises the hydrophobic packing of two core helices. As an intact Glu-343/Arg-378 bridge is the default state in unbound ETS1 and maintained in high-affinity and nonspecific complexes, the low-affinity complex represents a unique conformational adaptation to the suboptimization of developmental enhancers.

Keywords: DNA binding protein; DNA sequence motif; DNA-binding domain; ETS proto-oncogene 1 transcription factor (ETS1); ETS transcription factor family; allosteric regulation; developmental factor; low-affinity DNA binding; molecular dynamics; suboptimization; transcription enhancer; transcription factor.


Conflict of interest statement

The authors declare that they have no conflicts of interest with the contents of this article

Figures

Figure 1.
Figure 1.
Outline of the computational and experimental approach to DNA recognition by the ETS domain of ETS1. The crystal structure of the minimal ETS domain of ETS1 in complex with DNA (PDB code 1K79) was used as the template for independent simulations in the free (apo) and various DNA-bound states. The simulational and experimental DNA consisted of the shown sequences inserted into a (5′-CGGCCAA … ATGGCG-3′) cassette to generate a 23-bp construct. The 5′-GGA(A/T)-3′ consensus is underlined. The standard free energies of complex formation at 25 °C were determined from DNA binding experiments (mean ± S.E. of three or more replicates), as shown below the representative bound structures.
Figure 2.
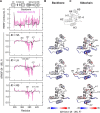
Figure 2.
Perturbations of ETS1 backbone and side-chain dynamics upon binding. From top to bottom, the rows show unbound ETS1 and the high-affinity, low-affinity, and nonspecific complexes. A, per-residue RMSF of backbone and nonhydrogen side-chain atoms of ETS1. Bound ETS1 RMSF was calculated by taking the difference of bound from the unbound backbone/side-chain RMSF. Residues with notable increases in side-chain dynamics in each set are marked with asterisks. The three first and last terminal residues were disregarded. B and C, Differences in backbone and side-chain RMSF (bound − unbound) are mapped to representative structures. Regions that were most stabilized are colored blue, and the most dynamic are colored red. Residues with the strongest side-chain dynamics are indicated by arrows.
Figure 3.
Figure 3.
Collective backbone fluctuations distinguish cognate and nonspecific binding. Shown is PCA of the protein backbone atoms (C, Cα, N, and O), excluding the three first and last terminal residues because of their proximity to the termini. A, Scree plot of the first five PCs. B, relative magnitudes of the eigenvectors comprising PC1 describe the contribution of each residue to the major global motion. Residues above a relative cutoff of 0.25 map primarily to the H2/loop (residues 378–383) and wing (residues 404–408) flanking the recognition helix H3. C, the collective motion along PC1 shows a range of motion in which the loop and wing fluctuate toward (negative PC1 scores) or away (positive scores) from the DNA. The overlaid structures correspond to the positions in the distributions of PC scores marked by asterisks. The DNA is included only as a visual guide.
Figure 4.
Figure 4.
Collective side-chain dynamics strongly distinguish specific and nonspecific binding modes of ETS1. Shown is PCA of nonhydrogen atoms of the protein side chain, excluding the three first and last terminal residues. A, scree plot indicating that side-chain dynamics were more concentrated in the first PC from their backbone counterparts. B, the magnitudes of the per-residue eigenvectors involved a broad range of residues distributed throughout the DNA-contacting surface. Residues 343, 378–381, 383, 387, 391, 394, 395, 399, 404–405, 408, and 410 exceeded a formal relative cutoff of 0.25. C, residues meeting the cutoff were mapped to an averaged structure as cyan spheres, with the arrows (red) indicating the motion from negative to positive along the respective PCs.
Figure 5.
Figure 5.
Cognate DNA discrimination is coupled allosterically to a distal salt bridge. A, representative snapshots of the high- and low-affinity complexes from the centroids of their respective side-chain PC1/PC2 clusters in the side-chain PCA. Gln-336 is at the N terminus of H1, whereas Glu-343 and Arg-378 are near the C termini of H1 and H2, respectively. The DNA bases contacted by either Gln-336 (high-affinity) or Arg-378 (low-affinity) are marked with asterisks. B, distance profile of the Glu-343/Arg-378 salt bridge, taken as the separation between the centers of mass of the terminal nitrogen and oxygen atoms in their side chains. Each histogram is normalized to the total number of frames counted, white-filled for WT and yellow-filled for mutant ETS1. C, separation distance of the side-chain nitrogen (Nϵ2) of Gln-336 to the phosphate oxygen (OP2) of its DNA contact (position marked with an asterisk in A, high-affinity). D, representative binding profiles of the Q336L and E343L mutants to high- and low-affinity DNA at 25 °C. E, free energy changes of WT and mutant ETS1 binding to high- or low-affinity DNA, expressed as difference from the WT high-affinity value as mean ± S.D. of three or more replicates. Student's t test, *, p < 0.05.
Figure 6.
Figure 6.
Cognate discrimination by ETS1 at the Mnx enhancer, a cis-regulatory element in embryogenesis. A, sequence and schematic of the Mnx enhancer in a syntax that produces correctly patterned expression in Ciona embryos (Mnx2bp), or a variation (Mnx2bp OE) that causes ectopic expression in vivo. The presentation maintains consistency with the reported nomenclature (2). Blue symbols correspond to ETS-binding sites, with the shading and number denoting the affinity relative to an optimal site (such as SC1). The red symbol represents a binding site for ZicL, another required transcription factor, that overlaps with the central weak ETS site. B, representative titrations of each enhancer with WT, selection-competent E343L, and the incompetent Q336L mutant, as resolved gel mobility shift. Each protein-containing lane represents a 1.5-fold change in concentration. Arrows indicate the 5% bound threshold in each titration. To the right of each gel is the lane trace for the rightmost lane, representing the distribution of bound states at a just-saturating concentration of protein. The numbers represent unbound (0) and bound states harboring 1 to 3 equivalents of protein.
Figure 7.
Figure 7.
Breach of a key salt bridge compromises the hydrophobic core of ETS1. A, time-averaged water contacts within a 3.4 Å radius for each residue in WT ETS1 near H1 and H2 (orange, 333–378). The change in solvent exposure was calculated as the difference from unbound protein. Values below an assigned cutoff (±1 water) are colored gray and those above black. Residues with values above/below the cutoff in H1 and H2 are marked with an asterisk. High-affinity binding resulted in loss of water exposure at Leu-337 (H1) and Trp-375 (H2). In contrast, the low-affinity binding increased water exposure at Phe-340, Glu-343 (H1), and Gly-376 (H2). Arg-378 became less hydrated because of DNA contact. B, local structure of helix H2, showing the backbone conformation from Arg-374 and Arg-378. C, values indicating the fraction of frames in which H2 residues were helical as scored by DSSP.
Figure 8.
Figure 8.
Proposed mechanism of variable autoinhibition in ETS1. A, DNA binding by ETS1 is autoinhibited by an allosteric mechanism mediated by helix H1 (blue), which couples the DNA binding interface with an N-terminal inhibitory module consisting of the short helices HI-1 and HI-2 (red). Structural evidence shows that both HI helices are folded in the unbound state (PDB code 1R36, left). Upon binding to high-affinity cognate DNA (right, PDB code 3MFK, the DNA sequence is 5′-GCAGGAAGTG-3′, consensus in orange), and HI-1 is differentially unfolded over HI-2. B, free energy relationship between ETS1 binding to the same DNA substrates as uninhibited (i.e. ΔN331) and autoinhibited (i.e. ΔN280) constructs. Data are compiled from the literature (see text for references) in decreasing uninhibited affinity as follows: 1, SC1; 2 and 3, nicked SC1 (green); 4, 6–8, and 10, flanking base variants of SC1; 5, a long construct harboring SC1; 9 and 11, hemi- and fully methylated SC1 (magenta). Reported error bars are shown. The line represents an error-weighted linear fit by York's method with the 95% confidence interval. The estimated slope is 1.5 ± 0.1. Note the base-10 logarithmic axes. The dashed line is unity. C, observed contacts Ala-323/Glu-343 and Glu-343/Arg-378 contacts in the high-affinity co-crystal in A. The present results suggest that the absence of the Glu-343/Arg-378 salt bridge in low-affinity complexes would destabilize HI-2, leading to increased autoinhibition (arrows).

References

    1. Farley E. K., Olson K. M., Zhang W., Brandt A. J., Rokhsar D. S., and Levine M. S. (2015) Suboptimization of developmental enhancers. Science 350, 325–328 10.1126/science.aac6948 - DOI - PMC - PubMed
    1. Farley E. K., Olson K. M., Zhang W., Rokhsar D. S., and Levine M. S. (2016) Syntax compensates for poor binding sites to encode tissue specificity of developmental enhancers. Proc. Natl. Acad. Sci. U.S.A. 113, 6508–6513 10.1073/pnas.1605085113 - DOI - PMC - PubMed
    1. Jiang J., and Levine M. (1993) Binding affinities and cooperative interactions with bHLH activators delimit threshold responses to the dorsal gradient morphogen. Cell 72, 741–752 10.1016/0092-8674(93)90402-C - DOI - PubMed
    1. Crocker J., Abe N., Rinaldi L., McGregor A. P., Frankel N., Wang S., Alsawadi A., Valenti P., Plaza S., Payre F., Mann R. S., and Stern D. L. (2015) Low affinity binding site clusters confer hox specificity and regulatory robustness. Cell 160, 191–203 10.1016/j.cell.2014.11.041 - DOI - PMC - PubMed
    1. Ramos A. I., and Barolo S. (2013) Low-affinity transcription factor binding sites shape morphogen responses and enhancer evolution. Philos. Trans. R Soc. Lond. B Biol. Sci. 368, 20130018 10.1098/rstb.2013.0018 - DOI - PMC - PubMed

Publication types