. 2019 Jun 7;364(6444):987-990.
doi: 10.1126/science.aav7617. Epub 2019 May 2.

Prenatal activity from thalamic neurons governs the emergence of functional cortical maps in mice

Affiliations

Prenatal activity from thalamic neurons governs the emergence of functional cortical maps in mice

Noelia Antón-Bolaños et al. Science. .

Abstract

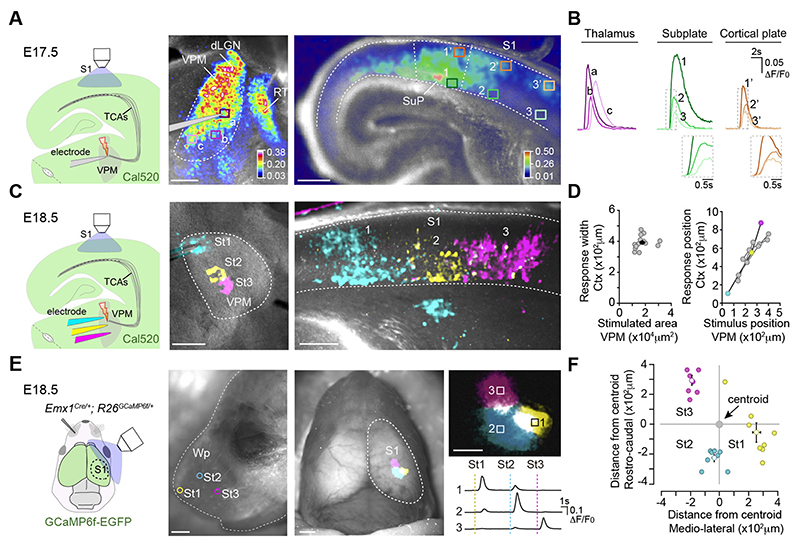
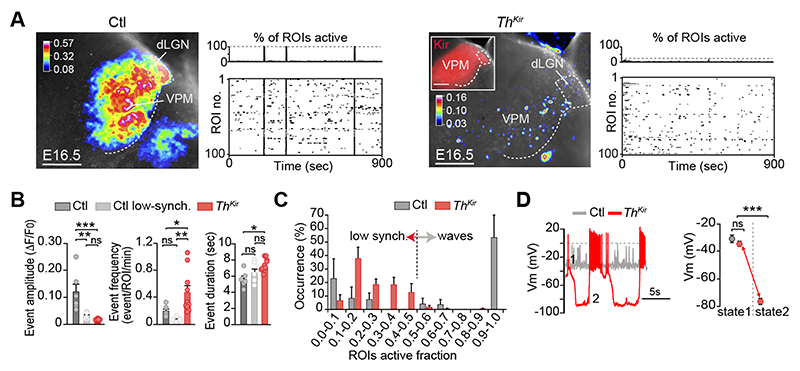
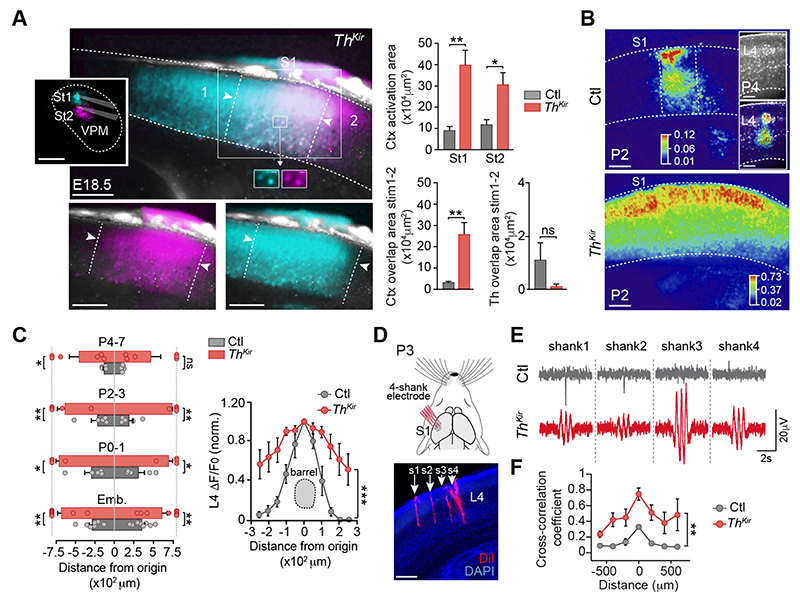
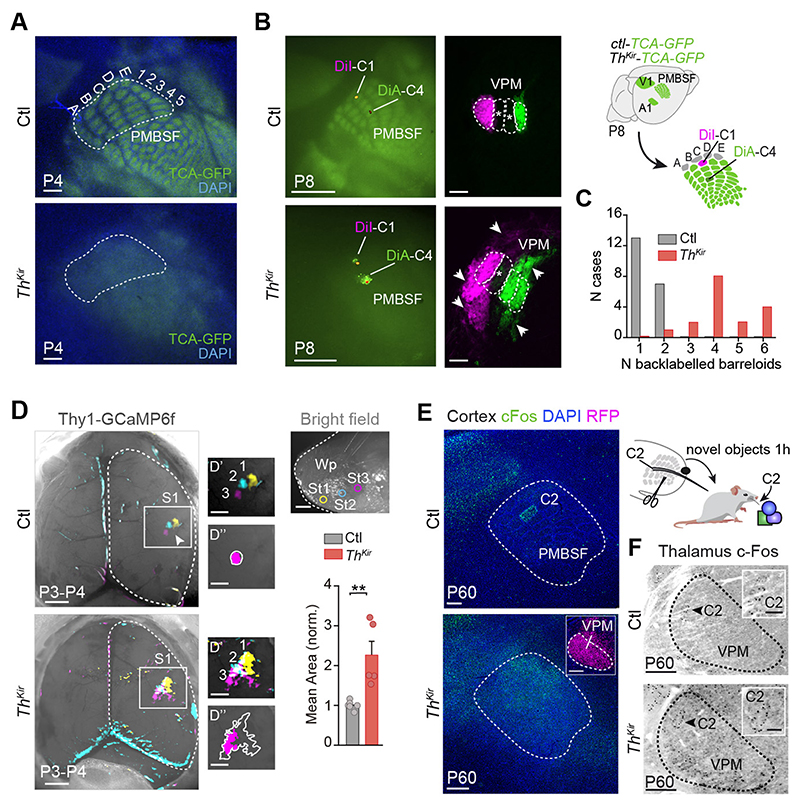
The mammalian brain's somatosensory cortex is a topographic map of the body's sensory experience. In mice, cortical barrels reflect whisker input. We asked whether these cortical structures require sensory input to develop or are driven by intrinsic activity. Thalamocortical columns, connecting the thalamus to the cortex, emerge before sensory input and concur with calcium waves in the embryonic thalamus. We show that the columnar organization of the thalamocortical somatotopic map exists in the mouse embryo before sensory input, thus linking spontaneous embryonic thalamic activity to somatosensory map formation. Without thalamic calcium waves, cortical circuits become hyperexcitable, columnar and barrel organization does not emerge, and the somatosensory map lacks anatomical and functional structure. Thus, a self-organized protomap in the embryonic thalamus drives the functional assembly of murine thalamocortical sensory circuits.


Conflict of interest statement

Competing interests: None declared.

Figures

Fig.1
Fig.1. Embryonic thalamocortical stimulation reveals an organized prenatal cortical map.
(A) Experimental design. Maximal projection of the calcium responses (ΔF/F0, color coded) in the ventral postero-medial nucleus (VPM) and cortex after VPM stimulation at E17.5. (B) Calcium transients from boxes in A. (C) Experimental design. Maximal projection of cortical responses after stimulation of three adjacent VPM regions at E18.5. (D) Plot of stimulated VPM area versus cortical response width (black dot equals mean value). Right: Plot of the stimulus position in the VPM versus the cortical response location (n = 16). Colored circles represent the data in C. (E) Experimental design. Cortical calcium responses elicited by mechanical stimulation of three contralateral whisker pad (Wp) sites (St1-St3) at E18.5. Right: High-magnification and transients recorded in each ROI (boxes 1-3). (F) Plot of the position of each cortical response relative to the centroid of the activated area (n = 8). dLGN, dorso-lateral geniculate nucleus; RT, reticular thalamus; SuP, subplate; TCAs, thalamocortical axons. Scale bars, 200 μm in A; 1 mm in E (left/middle) and 500 μm in E (right).
Fig.2
Fig.2. Desynchronizing the embryonic thalamic pattern of activity.
(A) Maximal projection of ex vivo spontaneous calcium activity in the ventral postero-medial nucleus (VPM) and accompanying raster plots in control and ThKir slices at E16.5. (B) Properties of the VPM calcium events (n = 6 control, n = 10 ThKir; *P < 0.05, **P < 0.01, ***P < 0.001). (C) Percentage distribution of active ROIs. (D) Representative traces and quantification of membrane potential (Vm) in control and ThKir neurons recorded at E16.5-E18.5 (control n = 7; ThKir n = 7). ***P < 0.001. dLGN, dorso-lateral geniculate nucleus. Scale bars, 200 μm. Data are means ± SEM.
Fig.3
Fig.3. Loss of functional cortical pre-barrel columns in the ThKir mice.
(A) Maximal projection of cortical responses after stimulation of two adjacent ventral postero-medial (VPM) regions in ThKir slices. Right: Quantifications of the activated area (n = 6 control, n = 6 ThKir; *P < 0.05, **P < 0.01). (B) Cortical activation elicited by VPM stimulation at P2 (inset: P4) in control and ThKir slices. (C) Quantification of the horizontal spread of the cortical response (E17-18 n = 8 control, n = 9 ThKir; P0-1 n = 5 control, n = 4 ThKir; P2-3 n = 5 control, n = 5 ThKir; P4-7 n = 5 control, n = 6 ThKir). Right: Same in layer 4 at P4-P7 (n = 6 control, n = 6 ThKir; ***P < 0.001). (D) Experimental design and coronal image showing the 4-shank (s1-s4) electrode insertion in S? (red). (E) Representative in vivo recordings of spontaneous cortical network activity. (F) Quantification of the cross-correlation coefficient among shanks in control (n = 3) and ThKir mice (n = 6). **P < 0.01. Scale bars, 200 μm. Data are means ± SEM.
Fig.4
Fig.4. Long-term anatomical and functional changes in S1 of the ThKir mice.
(A) Tangential sections showing the postero-medial barrel subfield (PMBSF) in control and ThKir TCA-GFP mice at P4. (B) Experimental design and images showing PMBSF injection sites and back-labeled barreloids in the ventral postero-medial nucleus (VPM). (C) Quantification of data shown in B (n = 10 control, n = 10 ThKir). (D) Maximal projection of the in vivo contralateral cortical responses elicited by mechanical stimulation of three whisker pad (Wp) sites at P3-P4 (top right). D’: high-power views. D”: drawing of initial (pink) and maximal (outline) extension of representative responses. Bottom-right: Quantification of the data (n = 6 control, n = 5 ThKir; **P < 0.01). (E) Experimental design and cortical cFos immunostaining. (F) VPM cFos immunostaining. Scale bars, 300 μm in A, B right, E and F (insets 100 μm); 1 mm in B left and D (insets 500 μm). Data are means ± SEM.

Comment in

References

    1. Mountcastle VB. J Neurophysiol. 1957;20:408–434. - PubMed
    1. Rakic P. Science. 1988;241:170–176. - PubMed
    1. Hubel DH, Wiesel TN. J Physiol. 1962;160:106–154. - PMC - PubMed
    1. Rakic P, Ayoub AE, Breunig JJ, Dominguez MH. Trends Neurosci. 2009;32:291–301. - PMC - PubMed
    1. Tiriac A, Smith BE, Feller MB. Neuron. 2018 - PMC - PubMed

Substances