. 2019 May 2;10(1):2027.
doi: 10.1038/s41467-019-10053-y.

Decoding individual differences in STEM learning from functional MRI data

Affiliations

Decoding individual differences in STEM learning from functional MRI data

Joshua S Cetron et al. Nat Commun. .

Abstract

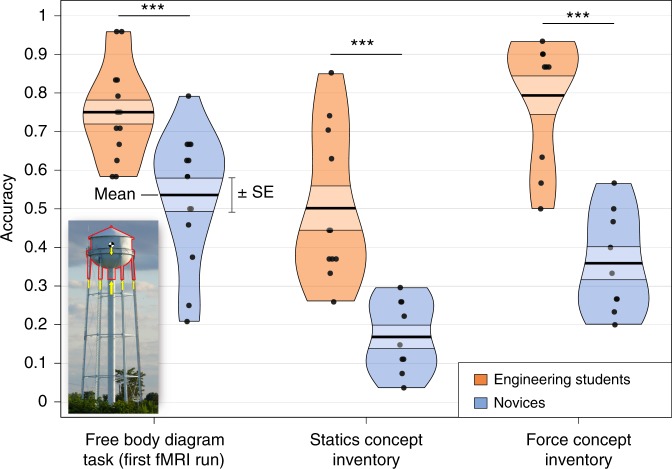
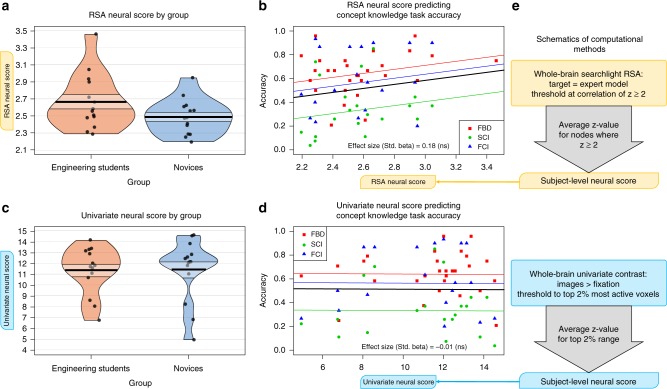
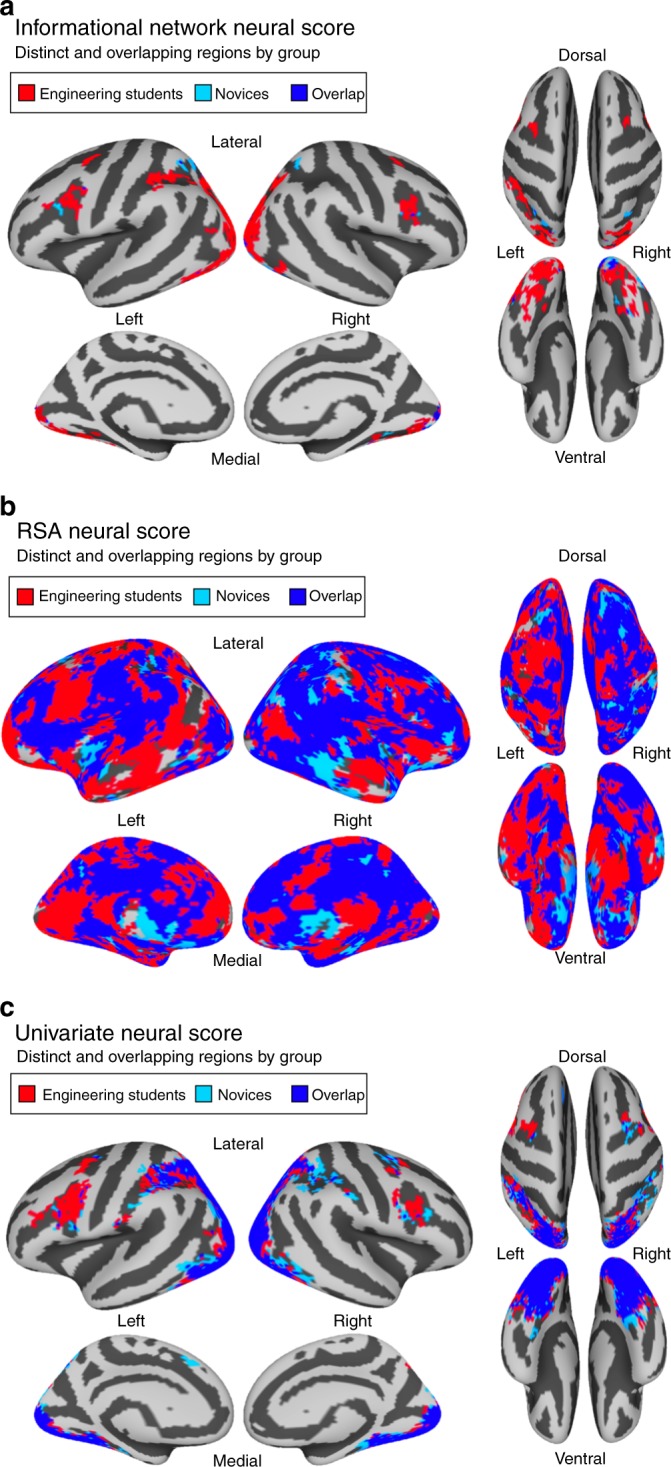
Traditional tests of concept knowledge generate scores to assess how well a learner understands a concept. Here, we investigated whether patterns of brain activity collected during a concept knowledge task could be used to compute a neural 'score' to complement traditional scores of an individual's conceptual understanding. Using a novel data-driven multivariate neuroimaging approach-informational network analysis-we successfully derived a neural score from patterns of activity across the brain that predicted individual differences in multiple concept knowledge tasks in the physics and engineering domain. These tasks include an fMRI paradigm, as well as two other previously validated concept inventories. The informational network score outperformed alternative neural scores computed using data-driven neuroimaging methods, including multivariate representational similarity analysis. This technique could be applied to quantify concept knowledge in a wide range of domains, including classroom-based education research, machine learning, and other areas of cognitive science.


Conflict of interest statement

The authors declare no competing interests.

Figures

Fig. 1
Fig. 1
Outcome measures: accuracy scores by group. Group performance on each outcome measure: FBD task performance at the first fMRI run, SCI accuracy score, and FCI accuracy score (between-group t test significance values: * = p < 0.05, ** = p < 0.01, *** = p< 0.001). Inset: example stimulus from the FBD task. (For a larger version of this example stimulus, see Supplementary Fig. 1)
Fig. 2
Fig. 2
Informational network neural score results. a Informational network neural score from the first fMRI run significantly differentiated the participants by group. b Informational network neural score significantly predicted concept knowledge in a linear mixed-effects model. The overall regression line is plotted as the thick black line over the observed accuracy data for each outcome measure type (FBD, SCI, and FCI accuracy). Random intercepts for each outcome measure are plotted as the colored lines. Effect size (standardized beta parameter) for the regression model are printed in the lower right corner of the plot. c Schematic outlining the computational method for the informational network analysis, used to compute the informational network neural score for each participant. (For between-group t test significance value at left and mixed-effects regression coefficient significance value at right: * = p < 0.05, ** = p < 0.01, *** = p< 0.001)
Fig. 3
Fig. 3
RSA and univariate neural score results. Neither the RSA neural score ab nor the univariate neural score cd from the first fMRI run significantly differentiated the participants by group, and neither was significantly predictive of concept knowledge. Regression outputs in b and d follow the same format as Fig. 2b, with effect size (standardized beta parameter) printed at bottom of each plot. Schematics on the right e outline the computational method for the RSA and univariate neural scores, following the format used in Fig. 2c
Fig. 4
Fig. 4
Neural score localizations by group. Regions contributing to neural scores in engineering students are shown in red. Regions contributing to neural scores in novices are shown in light blue. Regions contributing to neural scores in both engineering students and novices are shown in purple. a, b, and c show the informational network, RSA, and univariate neural score maps, respectively

References

    1. Kriegeskorte, N. Representational similarity analysis – connecting the branches of systems neuroscience. Front. Syst. Neurosci. 2, 4 (2008). - PMC - PubMed
    1. Cauchoix M, Barragan-Jason G, Serre T, Barbeau EJ. The neural dynamics of face detection in the wild revealed by MVPA. J. Neurosci. 2014;34:846–854. doi: 10.1523/JNEUROSCI.3030-13.2014. - DOI - PMC - PubMed
    1. Connolly AC, et al. The representation of biological classes in the human brain. J. Neurosci. 2012;32:2608–2618. doi: 10.1523/JNEUROSCI.5547-11.2012. - DOI - PMC - PubMed
    1. Connolly AC, et al. How the human brain represents perceived dangerousness or “Predacity” of animals. J. Neurosci. 2016;36:5373–5384. doi: 10.1523/JNEUROSCI.3395-15.2016. - DOI - PMC - PubMed
    1. Coutanche MN, Thompson-Schill SL. Creating concepts from converging features in human cortex. Cereb. Cortex. 2015;25:2584–2593. doi: 10.1093/cercor/bhu057. - DOI - PMC - PubMed

Publication types