. 2019 May 2;10(1):2024.
doi: 10.1038/s41467-019-10045-y.

TMEM33 regulates intracellular calcium homeostasis in renal tubular epithelial cells

Affiliations

TMEM33 regulates intracellular calcium homeostasis in renal tubular epithelial cells

Malika Arhatte et al. Nat Commun. .

Abstract

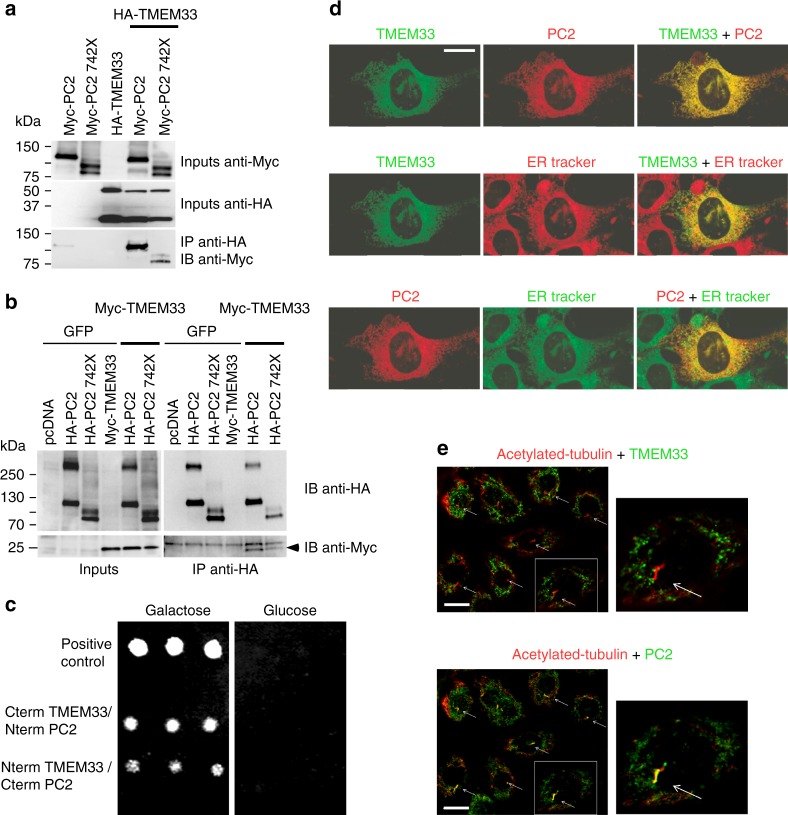
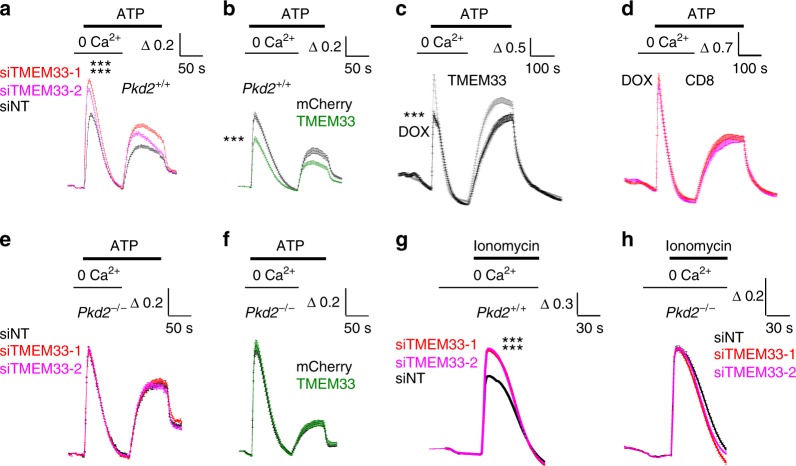
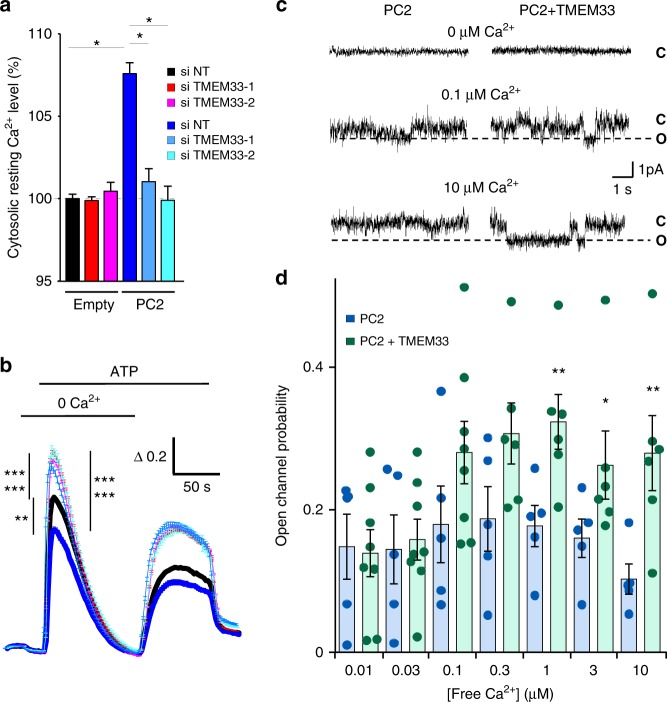
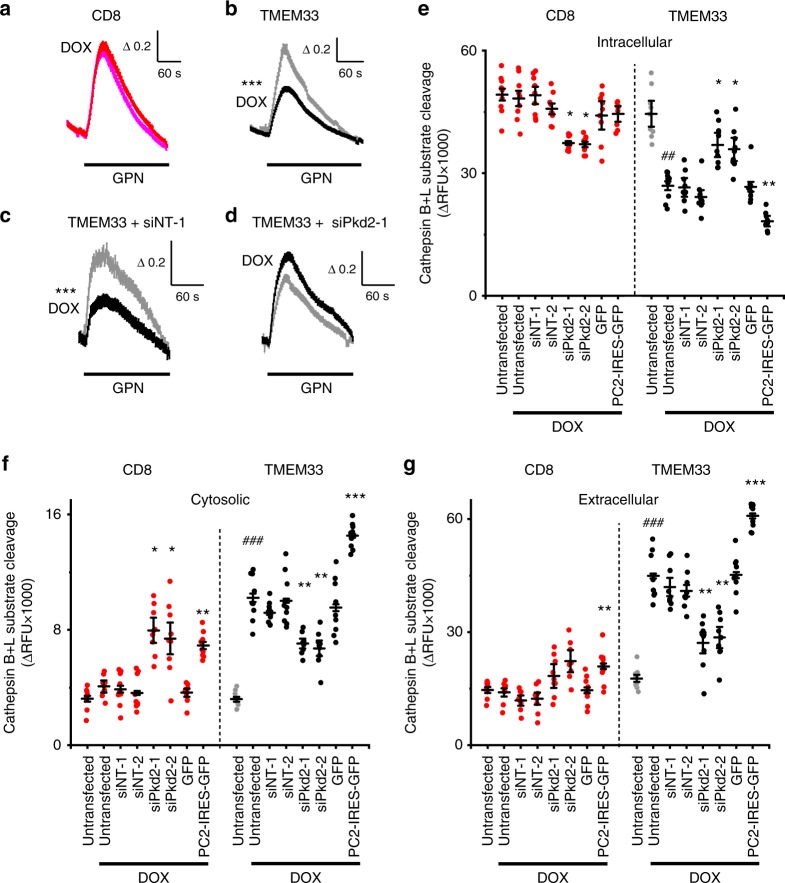
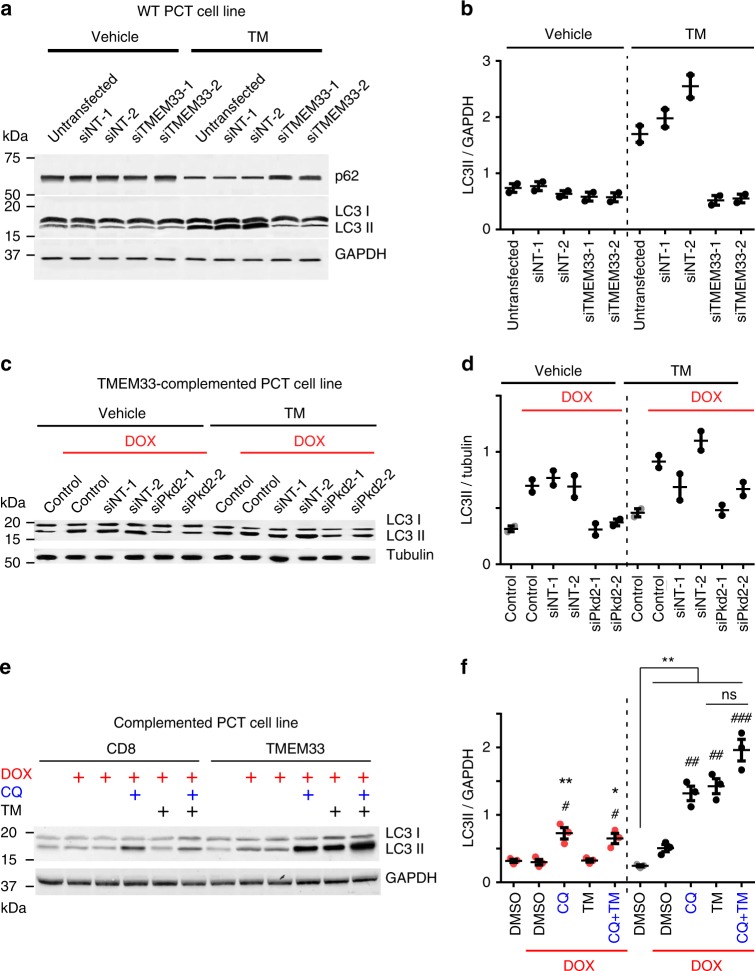
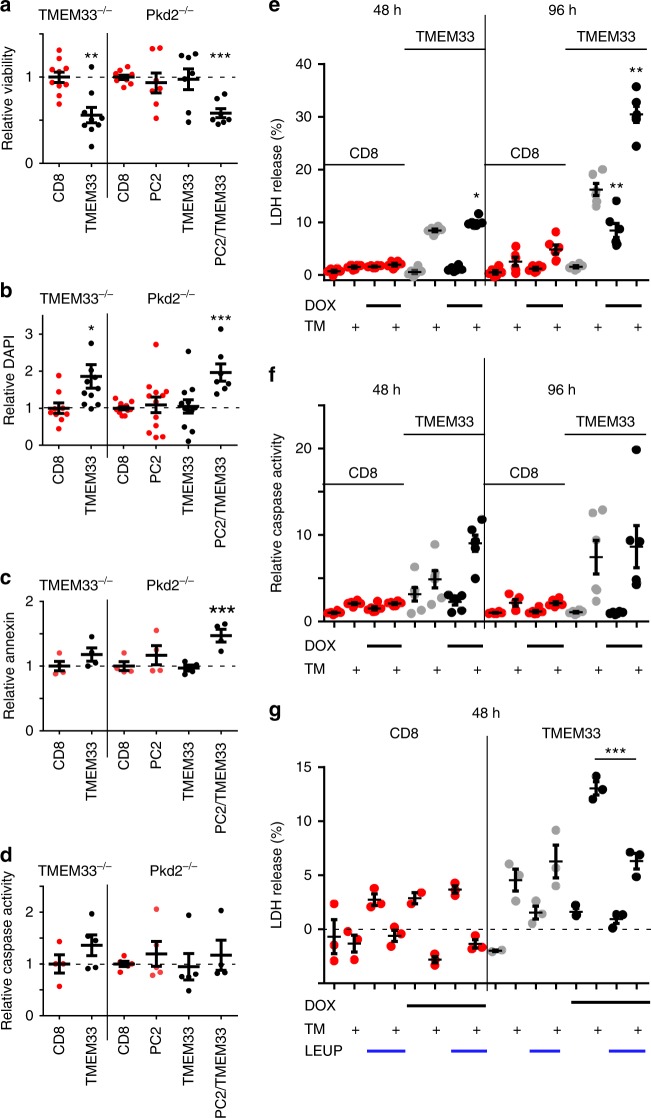
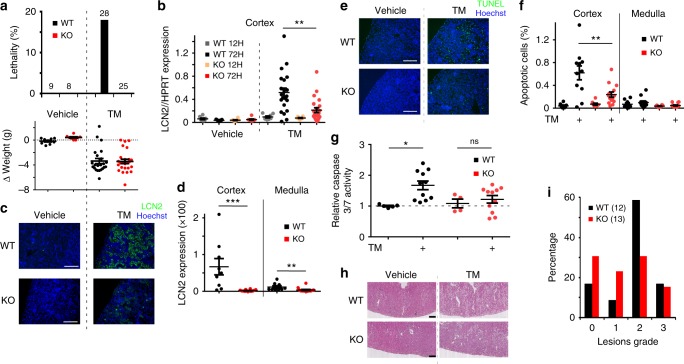
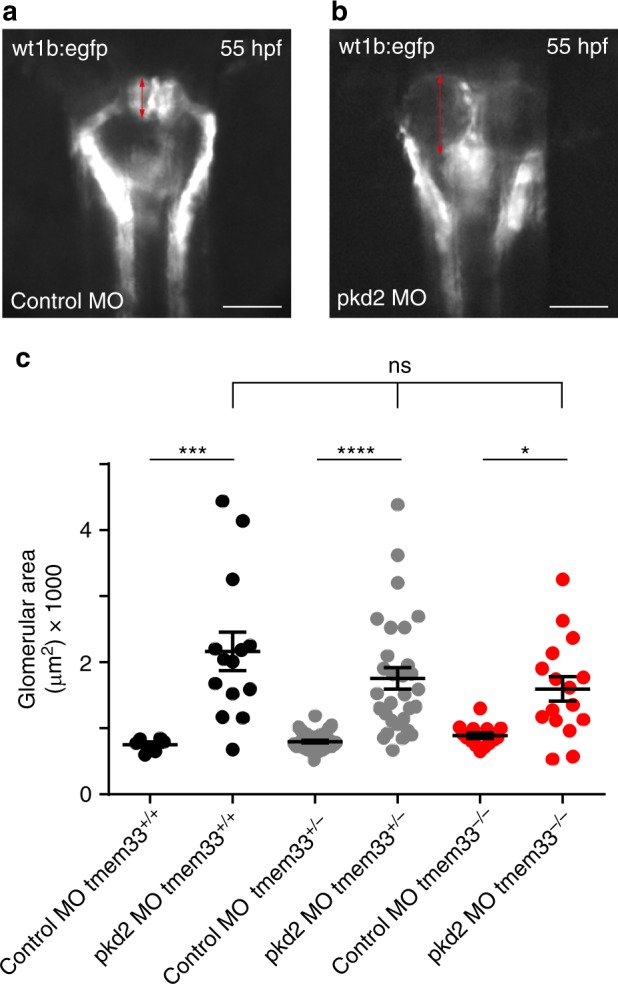
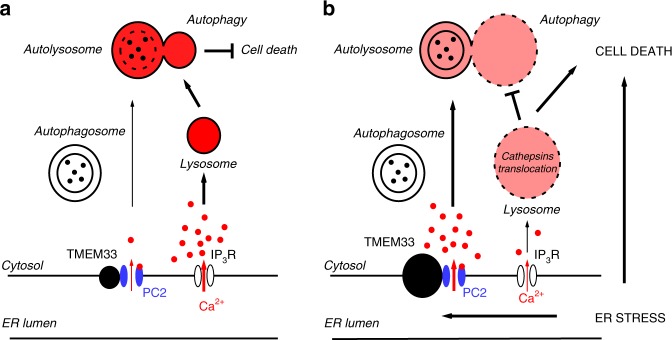
Mutations in the polycystins cause autosomal dominant polycystic kidney disease (ADPKD). Here we show that transmembrane protein 33 (TMEM33) interacts with the ion channel polycystin-2 (PC2) at the endoplasmic reticulum (ER) membrane, enhancing its opening over the whole physiological calcium range in ER liposomes fused to planar bilayers. Consequently, TMEM33 reduces intracellular calcium content in a PC2-dependent manner, impairs lysosomal calcium refilling, causes cathepsins translocation, inhibition of autophagic flux upon ER stress, as well as sensitization to apoptosis. Invalidation of TMEM33 in the mouse exerts a potent protection against renal ER stress. By contrast, TMEM33 does not influence pkd2-dependent renal cystogenesis in the zebrafish. Together, our results identify a key role for TMEM33 in the regulation of intracellular calcium homeostasis of renal proximal convoluted tubule cells and establish a causal link between TMEM33 and acute kidney injury.


Conflict of interest statement

The authors declare no competing interests

Figures

Fig. 1
Fig. 1
TMEM33 interacts with PC2 at the ER membrane of PCT cells. a Co-immunoprecipitation of TMEM33 with PC2 in PCT cells when TMEM33 is pulled down. A pathologic PC2 deletion mutant PC2–742X was also tested. b Same, but when PC2 is pulled down. Arrowhead indicates TMEM33 and the upper band is non-specific. c Yeast two hybrid experiments indicating an interaction (direct or indirect) between TMEM33 and PC2. We used a yeast strain with chromosomal LEU2 reporter gene harboring LexA operator binding sites. As a second reporter we used GFP under the control of the LexA operator (URA). The bait was either the COOH or NH2 terminus of TMEM33 expressed in frame with LexA (HIS), and the prey was either the COOH or NH2 terminus of PC2 expressed in frame with B42. As a further selection the prey product is only expressed in the presence of galactose. For a positive interaction, the yeast need to grow on medium -HIS-TRP-URA-LEU + Galactose and light up positive for GFP. As a positive control we used LexA-p53 with B42-LTA. As negative controls, we either expressed the LexA-CtermTMEM33 with the empty prey vector or B42-CtermPC2 with the empty bait vector. No growth was observed with any combination of either prey alone or bait alone. d Top: Co-localization of TMEM33-GFP (green) and mCherry-PC2 (red) in PCT cells; Middle: co-localization of TMEM33-GFP (green) with ER tracker as an ER marker (red); Bottom: co-localization of mCherry-PC2 (red) with ER tracker (green). The merged image (yellow shows co-localization) is shown at the right. False colors were used to consistently illustrate co-localizations in yellow (ER tracker blue). The scale bar corresponds to 20 μm. e TMEM33 is absent at the primary cilium, unlike PC2. Acetylated-tubulin in red labels the primary cilia and TMEM33 (top panels) or PC2 (bottom panels) are labeled in green (false colors). Co-localization of PC2 and acetylated tubulin is seen in yellow (merged image; bottom panels). The right panels are magnification of the boxed area shown in the left panels. Arrows indicate primary cilia. The scale bar corresponds to 15 μm. Source data are provided as a Source Data file
Fig. 2
Fig. 2
TMEM33 regulates intracellular calcium homeostasis. a Increases in cytosolic calcium concentration are expressed as ratios of 340:380 nm fluorescence signals (ΔR/R0). ΔR is the fluorescence ratio (340 nm/380 nm) measured at a given time divided by the initial ratio at time 0 (R0). Transfection of PCT cells with two siRNAs directed against TMEM33 increases ATP calcium transients recorded in the absence of extracellular calcium, as compared to the control non-targeting siRNA condition (siNT, n = 684, black symbols; siTMEM33–1, n = 589, red symbols; siTMEM33–2, n = 649, magenta symbols). Re-addition of extracellular calcium during the ATP stimulation elicits a capacitative calcium entry. b Same in PCT cells transiently overexpressing TMEM33 or not (Cherry, n = 244, black symbols; TMEM33, n = 254, green symbols). c Same in a conditional PCT cell line expressing TMEM33 when induced with DOX (black trace; n = 321) or not (gray trace; n = 464). d Same in a conditional PCT line expressing CD8ER in the presence of DOX (magenta trace; n = 181) or not (red trace; n = 266). e Same in Pkd2−/− PCT cells transfected or not with siRNAs against TMEM33 (siNT, n = 764; siTMEM33–1, n = 1025; siTMEM33–2, n = 856). f Same in Pkd2−/− PCT cells overexpressing or not TMEM33 (Cherry, n = 144; TMEM33, n = 141). g Ionomycin calcium transients in PCT cells (Pkd2+/+) bathed in the absence of extracellular calcium and transfected or not with siRNAs against TMEM33 (siNT, n = 1648; siTMEM33–1, n = 11615; siTMEM33–2, n = 1587). h Same in Pkd2−/− PCT cells (siNT, n = 627; siTMEM33–1, n = 769; siTMEM33–2, n = 659). Values are means ± SEM. One star indicates p < 0.05, two stars p < 0.01 and three stars p < 0.001, with a Student’s t test used to evaluate statistical significance. Source data are provided as a Source Data file
Fig. 3
Fig. 3
TMEM33 controls the calcium-dependent gating of PC2. a Increases in cytosolic calcium concentration are expressed as ratios of 340:380 nm fluorescence signals (ΔR/R0). Relative (to the siNT empty vector condition; black bar) basal cytosolic calcium levels in PCT cells transfected or not with siRNAs against TMEM33 (red and magenta bars). The effect of PC2 overexpression (as indicated at the bottom of the graph) was also investigated (dark blue bar, siNT and light blue bars: siTMEM33–1 and siTMEM33–2). Experimental points are available in the data source file. Numbers of cells analyzed are indicated in Fig. 2 and (b) legends. b ATP-induced calcium transients in the absence of extracellular calcium (siNT, n = 2353; siTMEM33–1, n = 2437; siTMEM33–2, n = 2201; siNT + PC2, n = 262; siTMEM33–1 + PC2, n = 246, siTMEM33 + PC2, n = 322). Same cells as in (a). c PC2 channel activity elicited with 0, 0.1 and 10 μM free calcium on the cis-side (cytosolic) in ER liposomes fused to planar bilayers (holding potential: 0 mV). As previously reported, the slope conductance of the channel was 85 pS when PC2 was activated by cytosolic calcium, . C indicates the closed state and O the open state (dashed line). d Open channel probability of PC2 measured at increasing concentration of free cytosolic calcium (PC2: blue bars and PC2 + TMEM33: green bars). Values are means ± SEM overlaid with dot plots for (d). One star indicates p < 0.05, two stars p < 0.01 and three stars p < 0.001, with a Student’s t test for (a, b), as well as a Mann–Whitney test for (d) used to evaluate statistical significance. Source data are provided as a Source Data file
Fig. 4
Fig. 4
TMEM33 inhibits endolysosomal calcium refilling and induces cathepsins translocation. a Increases in cytosolic calcium concentration are expressed as ratios of 340:380 nm fluorescence signals (ΔR/R0). GPN (250 μM) response in the absence of extracellular calcium in a conditional PCT cell line expressing CD8ER in the presence of DOX (magenta trace, n = 692), as compared to the non-induced condition (red trace; n = 706). b Same in a conditional PCT cell line expressing TMEM33 in the presence of DOX (black trace; n = 548) or without induction (gray trace; n = 620). c GPN response in cells transfected with siNT (n = 204 and n = 224, in the absence [gray trace] or the presence of DOX [black trace], respectively). d Knockdown of Pkd2 (coding for PC2) suppresses the effect of TMEM33 (n = 361 and n = 422 in the absence and in the presence of DOX, respectively). e Effect of Pkd2 knock-down or PC2 overexpression on intracellular cathepsins B/L content. CD8: red dots; TMEM33 non induced: gray dots; TMEM33 induced: black dots. f Same for cytosolic cathepsins. g Same for extracellular cathepsins. Values represent average peak ∆RFU values for n = 3 independent transfection experiments done in triplicate. * compared to respective untransfected DOX induced controls and # compared to respective non-induced controls. Bars are means ∆RFU ± SEM overlaid with dot plots for e-g. One star indicates p < 0.05, two stars p < 0.01 and three stars p < 0.001, with a Student’s t-test used to evaluate statistical significance. Source data are provided as a Source Data file
Fig. 5
Fig. 5
TMEM33/PC2 and the regulation of autophagy. a p62, LC3II/LC3I and GAPDH expression in WT PCT cells transfected with control siNT or siTMEM33 siRNAs. Cells were either treated with the vehicle or with TM (1 μg/ml for 16 h). Stimulation of autophagy induced by TM is seen as a decreased expression of p62 and increased LC3II/LC3I ratio. b LC3II/GAPDH ratio quantified from (a). c LC3II/LC3I and tubulin expression in TMEM33−/− cells conditionally complemented with TMEM33 (upon DOX induction). Cells were transfected with control siNT or siPkd2 siRNAs. Cells were either treated with the vehicle or with TM (1 μg/ml for 12 h). d LC3II/tubulin ratio quantified from (c). Gray dots: uninduced cells; black dots: induced with DOX. e Estimation of autophagic flux in CD8- or TMEM33-complemented TMEM33−/− stably complemented PCT cells. Treatments with doxycyline (DOX) to induce either CD8ER or TMEM33 expression is illustrated in red. Cells are treated either with vehicle (DMSO) or with TM (1 μg/ml) for 8 h with or without chloroquine (20 μg/ml)(CQ) for 2 h. f LC3II/GAPDH ratio quantified from e. Red dots: CD8; Gray dots: TMEM33 uninduced cells; black dots: TMEM33 induced with DOX. For TMEM33 expressing cells, the difference between DMSO and CQ is significant (**), while the difference between TM and TM + CQ is not significant. Values are means ± SEM overlaid with dot plots for b, d, f. One star indicates p < 0.05, two stars p < 0.01 and three stars p < 0.001, with a two-tailed Student’s t-test used to evaluate statistical significance. Source data are provided as a Source Data file
Fig. 6
Fig. 6
TMEM33 overexpression induces cytotoxicity in a PC2-dependent manner. a Cell viability determined by measuring the number of Cherry positive cells using a cell sorter. CD8ER (red dots) was used as a negative control. Cells were transfected with TMEM33 (black dots) or PC2 alone (red dots), or with the mix TMEM33/PC2 (black dots). The relative (to the CD8ER conditions) number of viable cells expressing Cherry is illustrated. b Relative number of DAPI positive cells. One TMEM33 complemented TMEM33−/− data point (4.66) is out of scale. c Relative number of annexin positive cells. d Relative caspase 3/7 activity. e LDH release in either a conditional PCT cell line expressing CD8ER (in red) or TMEM33 (in black), without (in gray) or with DOX induction (in black) at 48 and 96 h. Cells were treated with vehicle (DMSO) or TM (1 μg/ml) for 16 h. f Same for caspase 3/7 activity. g Effect of the cathepsins inhibitor leupeptin (LEUP; 25 μM) on LDH release in a conditional PCT cell line expressing TMEM33 (black dots) or CD8ER (red dots) without or with DOX induction (48 h), as indicated. Values are means ± SEM overlaid with dot plots. One star indicates p < 0.05, two stars p < 0.01 and three stars p < 0.001, with a one-way permutation test used to evaluate statistical significance. Source data are provided as a Source Data file
Fig. 7
Fig. 7
Deletion of TMEM33 in the mouse confers protection against AKI. a Percentage of lethality (the number of mice is indicated) is shown in the top panel. The bottom panel shows the amount of weight loss induced by TM injection. WT: black bars and dots; KO: red bars and dots. b Expression of LCN2, as detected by qPCR in mouse renal cortex 12or 72 h after TM (2 mg/kg) injection, comparing WT (gray and black dots) and KO (orange and red dots) mice. c LCN2 and Hoechst staining on cortical sections of kidney from WT and KO mice injected with vehicle or TM (same n values as a). Scale bars indicate 200 μm. d Relative intensity (TM/vehicle) of LCN2 staining in the cortex and medulla of WT and KO mice. e Tunel and Hoechst staining on cortical sections from kidneys of mice injected with vehicle or TM, comparing WT and KO mice. Scale bars indicate 200 μm. f Percentage of apoptotic cells in the cortex and the medulla. g Relative (to the vehicle treated WT mice) caspase 3/7 activity determined in renal cortical homogenates from WT and KO mice either injected with vehicle or TM. h Hematoxylin staining of cortical renal sections of WT and KO mice injected with vehicle or TM. i Quantification of lesion grades on cortical sections from WT and KO mice injected with vehicle or TM. The number of mice is indicated on the graph. Values are means ± SEM overlaid with dot plots. One star indicates p < 0.05, two stars p < 0.01 and three stars p < 0.001, with a one-way permutation test used to evaluate statistical significance. Source data are provided as a Source Data file
Fig. 8
Fig. 8
Tmem33 does not influence renal cystogenesis in zebrafish. a Epifluorescence image of zebrafish glomeruli. Control morpholino oligomer injected in Tg(wt1b:EGFP)li1. b Morpholino knockdown of pkd2 increases glomerular area in Tg(wt1b:EGFP)li1 (red arrows). Scale bars: 50 µm. c Pkd2-dependent renal cystogenesis was unaffected by the loss of tmem33 in zebrafish tmem33sh443 mutants (tmem33+/+ black dots, tmem33+/- gray dots and tmem33−/− red dots). Each data point refers to a single glomerulus. Values are means ± SEM overlaid with dot plots. One way ANOVA with Turkey’s post hoc *p < 0.05, ***p < 0.001, ****p < 0.0001, F = 15.44, DF = 119, 2 repeats. Source data are provided as a Source Data file
Fig. 9
Fig. 9
TMEM33/PC2, intracellular calcium homeostasis and cell death. Schematic model describing the effect of TMEM33 on the regulation of intracellular calcium homeostasis, lysosomal function, autophagic flux and tubular cell death in control conditions (a) or upon ER stress (b). The proposed model (figure created by EH) addresses the scenario of AKI (b), when TMEM33 expression is enhanced (right panel). Our findings indicate an interaction between TMEM33 and PC2 at the ER membrane causing an increase in PC2 channel activity spanning the whole physiological calcium range. TMEM33 induces, through PC2, a decrease in intracellular calcium and a diminished IP3 calcium signaling (right panel). Consequent decrease in the calcium refilling of lysosomes, associated with an enlargement and translocation of cathepsins sensitize PCT cells to TM-induced apoptosis. Moreover, impairment of autolysosome degradation causes an inhibition of the autophagic flux and a loss of cellular protection upon ER stress. Accordingly, genetic deletion of TMEM33 in the mouse provides a significant protection against TM-induced AKI. Source data are provided as a Source Data file

References

    1. Harris PC, Torres VE. Genetic mechanisms and signaling pathways in autosomal dominant polycystic kidney disease. J. Clin. Invest. 2014;124:2315–2324. doi: 10.1172/JCI72272. - DOI - PMC - PubMed
    1. Shen PS, et al. The Structure of the polycystic kidney disease channel PKD2 in lipid nanodiscs. Cell. 2016;167:763–773 e711. doi: 10.1016/j.cell.2016.09.048. - DOI - PMC - PubMed
    1. Grieben M, et al. Structure of the polycystic kidney disease TRP channel Polycystin-2 (PC2) Nat. Struct. Mol. Biol. 2017;24:114–122. doi: 10.1038/nsmb.3343. - DOI - PubMed
    1. Kleene SJ, Kleene NK. The native TRPP2-dependent channel of murine renal primary cilia. Am. J. Physiol. Ren. Physiol. 2017;312:F96–F108. doi: 10.1152/ajprenal.00272.2016. - DOI - PMC - PubMed
    1. Liu, X. et al. Polycystin-2 is an essential ion channel subunit in the primary cilium of the renal collecting duct epithelium. Elife7, e33183 (2018). - PMC - PubMed

Publication types

MeSH terms