. 2019 May 2;10(1):2064.
doi: 10.1038/s41467-019-10119-x.

A generic approach towards afterglow luminescent nanoparticles for ultrasensitive in vivo imaging

Affiliations

A generic approach towards afterglow luminescent nanoparticles for ultrasensitive in vivo imaging

Yuyan Jiang et al. Nat Commun. .

Abstract

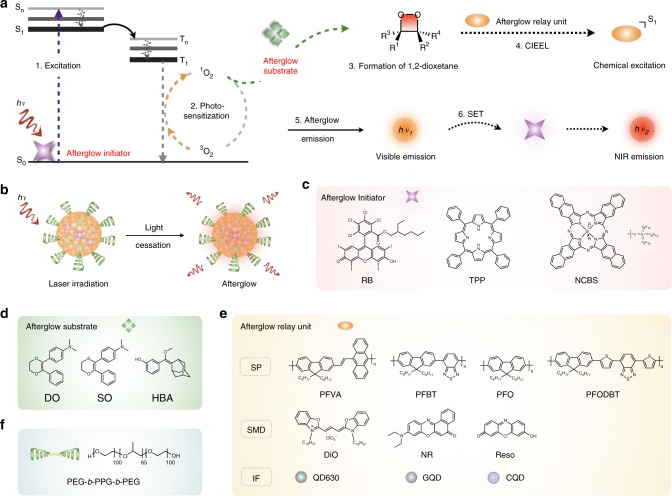
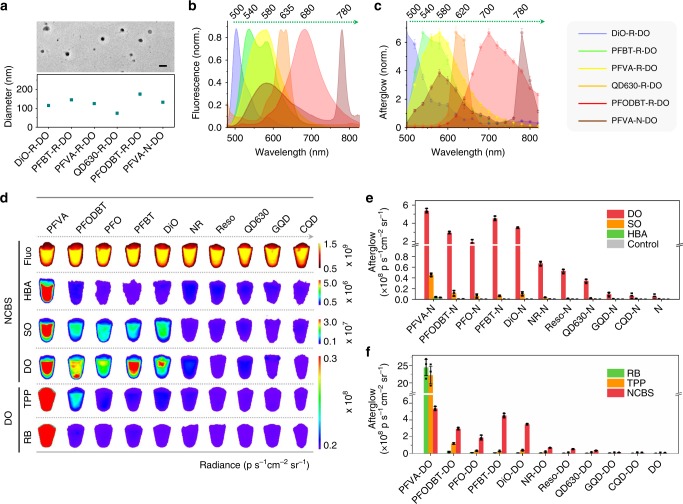
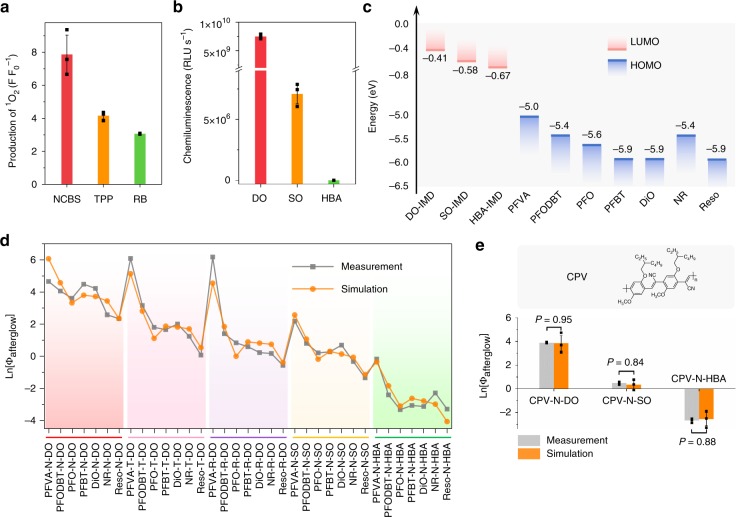
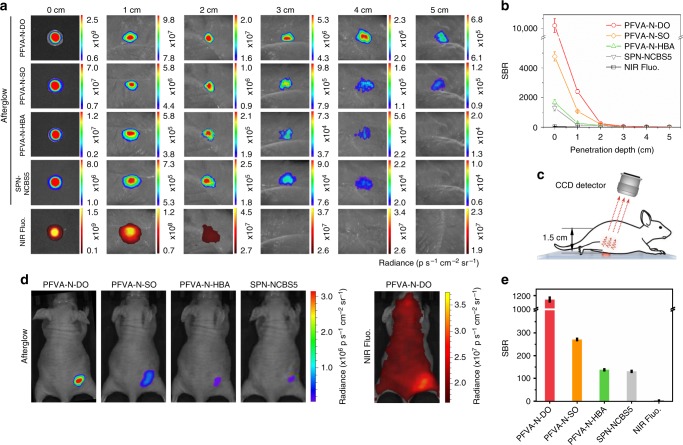
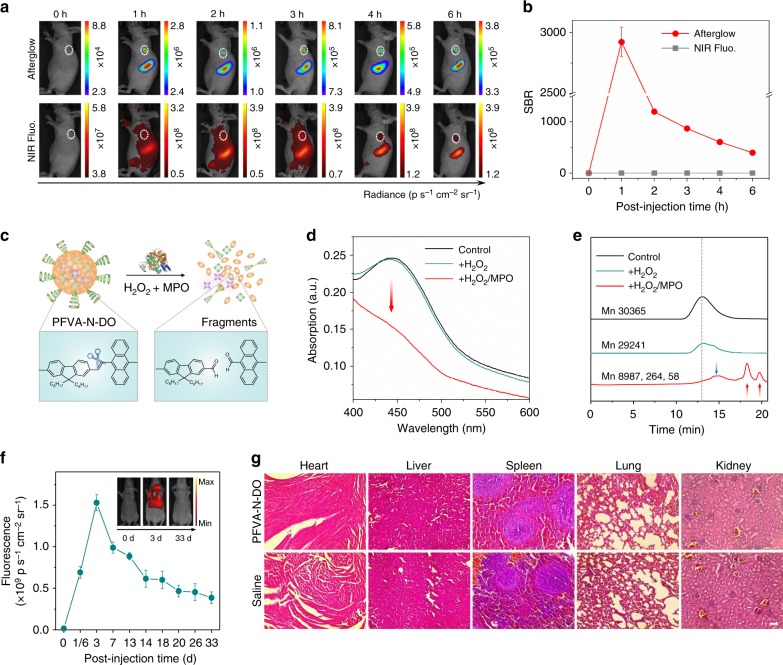
Afterglow imaging with long-lasting luminescence after cessation of light excitation provides opportunities for ultrasensitive molecular imaging; however, the lack of biologically compatible afterglow agents has impeded exploitation in clinical settings. This study presents a generic approach to transforming ordinary optical agents (including fluorescent polymers, dyes, and inorganic semiconductors) into afterglow luminescent nanoparticles (ALNPs). This approach integrates a cascade photoreaction into a single-particle entity, enabling ALNPs to chemically store photoenergy and spontaneously decay it in an energy-relay process. Not only can the afterglow profiles of ALNPs be finetuned to afford emission from visible to near-infrared (NIR) region, but also their intensities can be predicted by a mathematical model. The representative NIR ALNPs permit rapid detection of tumors in living mice with a signal-to-background ratio that is more than three orders of magnitude higher than that of NIR fluorescence. The biodegradability of the ALNPs further heightens their potential for ultrasensitive in vivo imaging.


Conflict of interest statement

The authors declare no competing interests.

Figures

Fig. 1
Fig. 1
The design approach toward afterglow luminescent nanoparticles (ALNPs). a Schematic illustration of detailed intraparticle photoreaction processes leading to afterglow. b Illustration of afterglow imaging of ALNPs. ce Chemical structures of afterglow initiators (c), afterglow substrates (d), afterglow relay units (e), and amphiphilic copolymer (f). PFVA, poly[(9,9′-dioctyl-2,7-divinylenefluorenylene)-alt-(9,10-anthracene)]; PFBT, poly[(9,9′-dioctylfluorenyl-2,7-diyl)-alt-(benzo[2,1,3]thiadiazol-4,7-diyl)]; PFO, poly(9,9′-dioctylfluorenyl-2,7-diyl); PFODBT, poly[2,7-(9,9′-dioctylfluorene)-alt-4,7-bis(thiophen-2-yl)benzo-2,1,3-thiadiazole]; DiO, 3,3′-dioctadecyloxacarbocyanine perchlorate; NR, nile red; Reso, resorufin; QD630, CdSe/ZnS core-shell type quantum dot
Fig. 2
Fig. 2
Characterization of ALNPs with different components. a Representative TEM image of PFVA-N-DO ALNPs (upper panel) and representative hydrodynamic diameters of various ALNPs measured by DLS (bottom panel) in 1 × PBS (phosphate buffered saline) buffer (pH = 7.4). Scale bar: 200 nm. b Normalized (norm.) fluorescence spectra of representative ALNPs with the emission ranging from visible to NIR region in 1 × PBS buffer (pH = 7.4). c Normalized afterglow luminescence spectra of ALNPs in (b) in 1 × PBS buffer (pH = 7.4). d Fluorescence and afterglow images of ALNPs with various components. Fluorescence images of NCBS based ALNPs were acquired at 780 nm upon excitation at 710 nm. Afterglow images were captured after light pre-irradiation (1 W cm−2 808 nm for NCBS based ALNPs while 0.1 W cm−2 white light for RB or TPP based ALNPs) for 5 s. For all ALNPs, [afterglow initiator] = 0.75 μg mL−1 (2.5 w/w%), [afterglow substrate] = 15 μg mL−1 (50 w/w%), [afterglow relay unit] = 30 μg mL−1. e Quantification of afterglow intensities of ALNPs with the same afterglow initiator (NCBS) whereas varying substrates and relay units in (d). f Quantification of afterglow intensities of ALNPs with the same afterglow substrates (DO) whereas varying afterglow initiators and relay units in (d). Error bars indicated standard deviations of three separate measurements
Fig. 3
Fig. 3
Mechanistic study of descriptors in the estimation of afterglow intensity of ALNPs. a Quantification of 1O2 generating capability for the different afterglow initiator doped nanoparticles at identical mass concentration (0.75 μg mL−1) in 1 × PBS (pH = 7.4). NCBS nanoparticles were pre-irradiated at 808 nm for 5 s (at 1 W cm−2), while TPP and RB nanoparticles were pre-irradiated with white light for 5 s (0.1 W cm−2). Production of 1O2 was defined as the fluorescence enhancement (FF0−1) of 1O2 sensor green (SOSG, 1 μM) at 524 nm. b Chemiluminescent intensities (RLU s−1) of DO, SO, and HBA in the presence of NCBS in tetrahydrofuran after pre-irradiation at 808 nm for 5 s (at 1 W cm−2). [DO] = [SO] = [HBA] = 15 μg mL−1; [NCBS] = 0.75 μg mL−1. RLU, relative light unit. c Schematic illustration of energy levels of afterglow substrates and afterglow relay units,,. LUMO, lowest unoccupied molecular orbitals. DO/SO/HBA-IMD, DO/SO/HBA-based dioxetane intermediate. d Measured (measurement) and estimated (simulation) afterglow intensities of ALNPs. Estimated afterglow intensities were calculated from Eq. (1). e Prediction of afterglow intensities of a new afterglow relay unit CPV by Eq. (1). P values were calculated by Student’s two-sided t-test. Inset: chemical structure of CPV. Error bars indicated standard deviations of three separate measurements
Fig. 4
Fig. 4
Tissue penetration study of ALNPs. a Afterglow and NIR fluorescence images of PFVA-based ALNPs ([PFVA] = 100 μg mL−1, [DO], [SO], or [HBA] = 50 μg mL−1, [NCBS] = 2.5 μg mL−1, 50 μL) and SPN-NCBS5 nanoparticles ([MEHPPV] = 100 μg mL−1, [NCBS] = 5 μg mL−1, 50 μL) under different depths of chicken breast tissues. b SBRs of afterglow or fluorescence images in (a) at different tissue depths. c Schematic illustration of optical imaging through a living mouse. Afterglow and NIR fluorescence images of PFVA-based ALNPs or SPN-NCBS5 were captured after penetrating through a living mouse. CCD, charged coupled device. d Afterglow and fluorescence images of PFVA-based ALNPs or SPN-NCBS5 nanoparticles penetrating through a living mouse. Concentrations of nanoparticles were identical to those in (b). e Quantification of the SBRs of afterglow or fluorescence images in (d). Both the PFVA-based ALNPs and SPN-NCBS5 were pre-irradiated at 808 nm for 5 s (at 1 W cm−2) before imaging. Fluorescence images were captured at 780 nm upon excitation at 710 nm. Error bars indicated standard deviations of three separate measurements
Fig. 5
Fig. 5
In vivo imaging, biodegradation, and clearance studies of ALNPs. a Representative afterglow and NIR fluorescence images of 4T1 xenograft tumor bearing mice at the different time points after tail vein injection of PFVA-N-DO ([PFVA] = 250 μg mL−1, [DO] = 125 μg mL−1, [NCBS] = 6.25 μg mL−1, 250 μL). Afterglow images were acquired after pre-irradiation of mice at 808 nm laser for 5 s (0.3 W cm−2). Fluorescence images were acquired at 780 nm upon excitation at 710 nm. White dashed circles indicated location of tumor. b SBRs of afterglow and NIR fluorescence imaging in tumor region as a function of time in (a). c Proposed mechanism of biodegradation of PFVA-N-DO nanoparticles by the mixture of MPO and H2O2. d Absorption spectra of PFVA-N-DO ([PFVA] = 4 μg mL−1) after incubation with buffer (control), H2O2 (300 mM), or MPO (50 μg mL−1)/H2O2 (300 mM) at 37 °C for 24 h in 100 mM PBS (pH = 7.0). e GPC results of ALNP solutions in (d). f Quantification of the NIR fluorescence intensities of liver region in living mice as a function of time after intravenous injection of PFVA-N-DO ([PFVA] = 250 μg mL−1, [DO] = 125 μg mL−1, [NCBS] = 6.25 μg mL−1, 250 μL). NIR fluorescence images were acquired at 780 nm upon excitation at 710 nm. g Hematoxylin & eosin staining of major organs from mice after tail vein injection of PFVA-N-DO ALNPs ([PFVA] = 250 μg mL−1, [DO] = 125 μg mL−1, [NCBS] = 6.25 μg mL−1, 250 μL) or saline (250 μL) for 33 days. Scale bar: 50 µm. Error bars indicated standard deviations of three separate measurements (n = 3)

Comment in

  • Afterglow probes made easy.
    Strack R. Strack R. Nat Methods. 2019 Jul;16(7):577. doi: 10.1038/s41592-019-0483-y. Nat Methods. 2019. PMID: 31249415 No abstract available.

References

    1. Park SM, Aalipour A, Vermesh O, Yu JH, Gambhir SS. Towards clinically translatable in vivo nanodiagnostics. Nat. Rev. Mater. 2017;2:17014. doi: 10.1038/natrevmats.2017.14. - DOI - PMC - PubMed
    1. Smith BR, Gambhir SS. Nanomaterials for in vivo imaging. Chem. Rev. 2017;117:901–986. doi: 10.1021/acs.chemrev.6b00073. - DOI - PubMed
    1. Ntziachristos V, Ripoll J, Wang LV, Weissleder R. Looking and listening to light: the evolution of whole-body photonic imaging. Nat. Biotechnol. 2005;23:313–320. doi: 10.1038/nbt1074. - DOI - PubMed
    1. Hyun H, et al. Structure-inherent targeting of near-infrared fluorophores for parathyroid and thyroid gland imaging. Nat. Med. 2015;21:192–197. doi: 10.1038/nm.3728. - DOI - PMC - PubMed
    1. Choi HS, et al. Targeted zwitterionic near-infrared fluorophores for improved optical imaging. Nat. Biotechnol. 2013;31:148–153. doi: 10.1038/nbt.2468. - DOI - PMC - PubMed

Publication types

Substances