. 2019 May 2;15(5):e1008130.
doi: 10.1371/journal.pgen.1008130. eCollection 2019 May.

Variants in myelin regulatory factor (MYRF) cause autosomal dominant and syndromic nanophthalmos in humans and retinal degeneration in mice

Affiliations

Variants in myelin regulatory factor (MYRF) cause autosomal dominant and syndromic nanophthalmos in humans and retinal degeneration in mice

Sarah J Garnai et al. PLoS Genet. .

Abstract

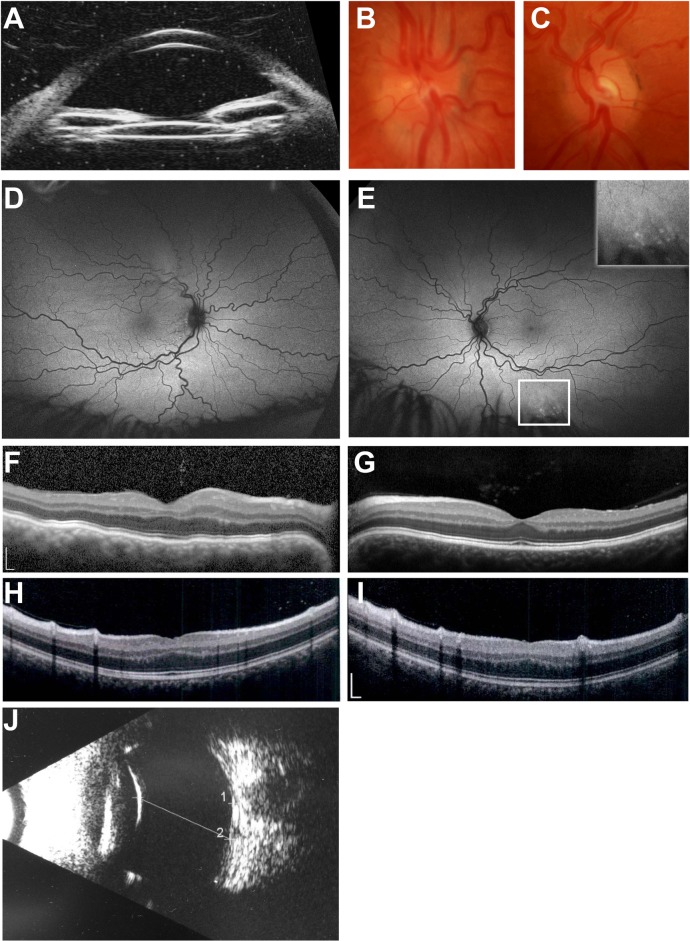
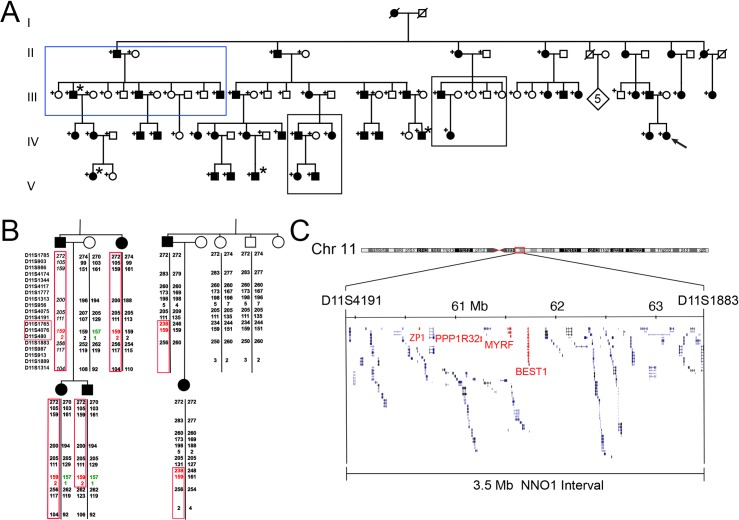
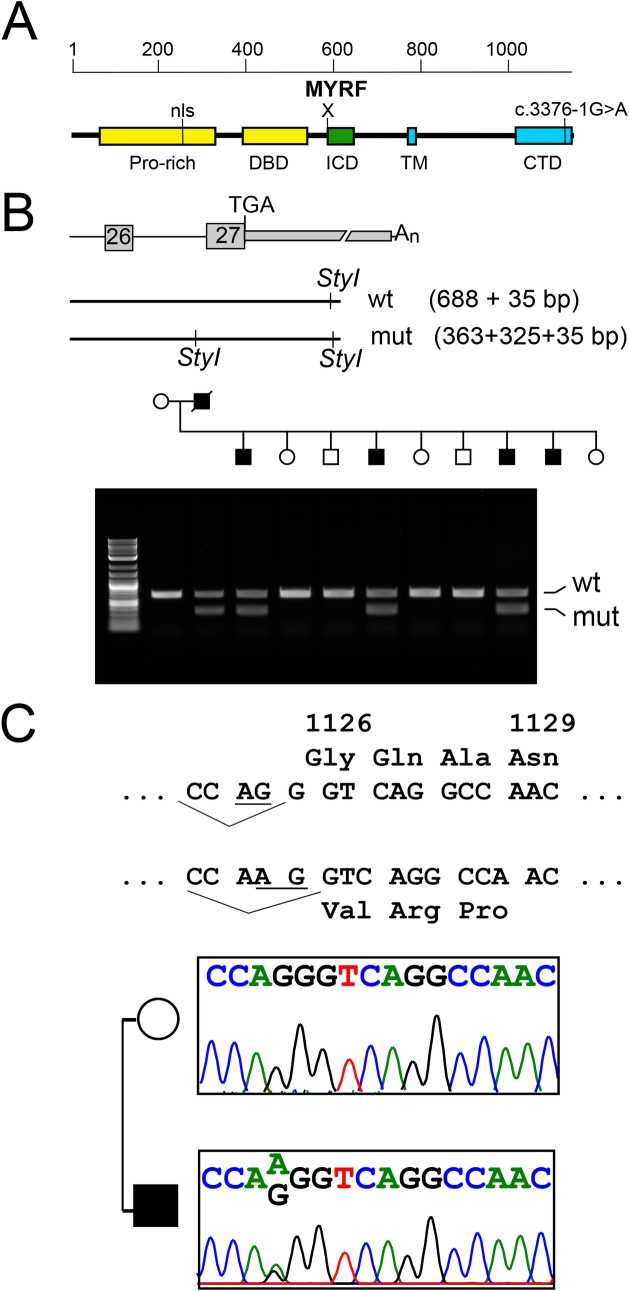
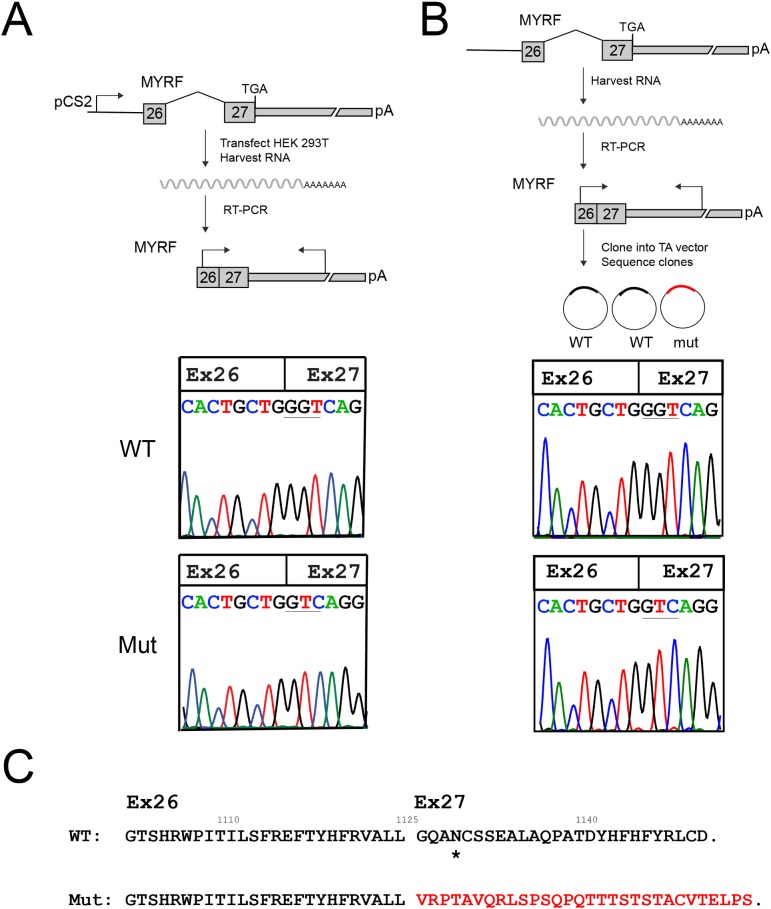
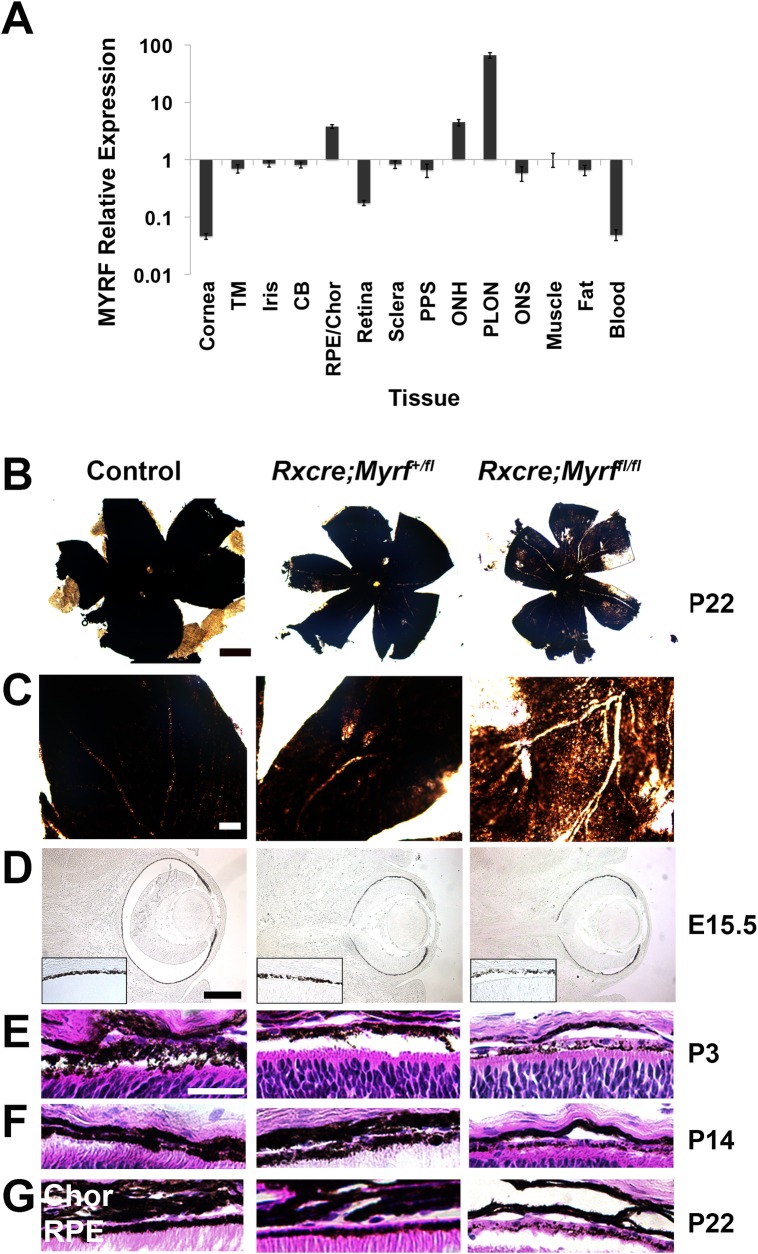
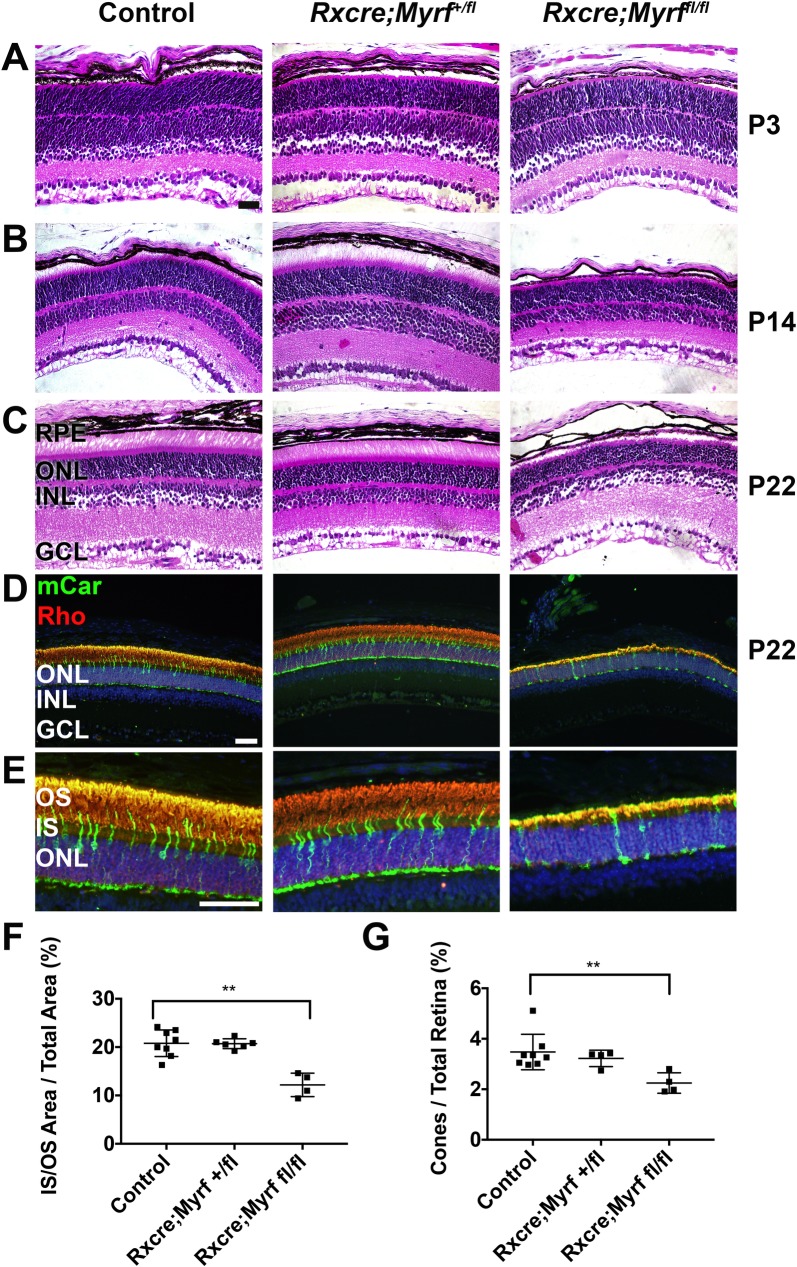
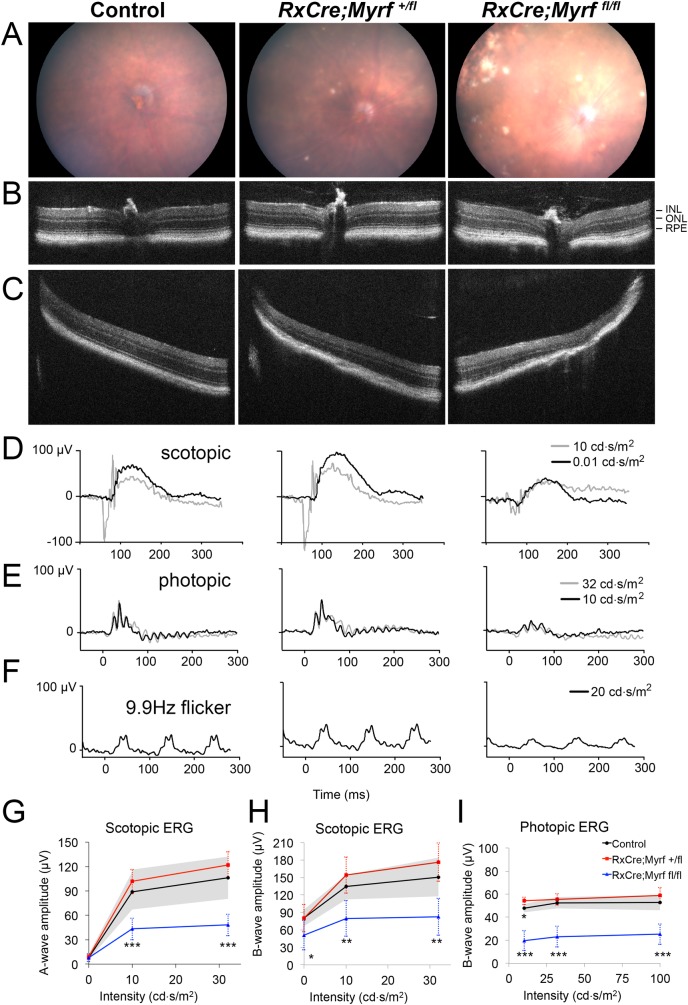
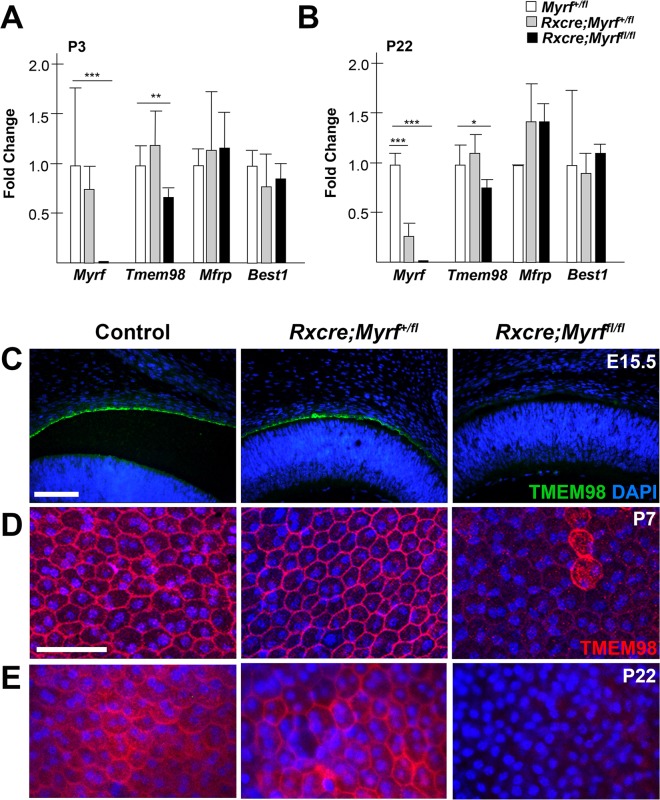
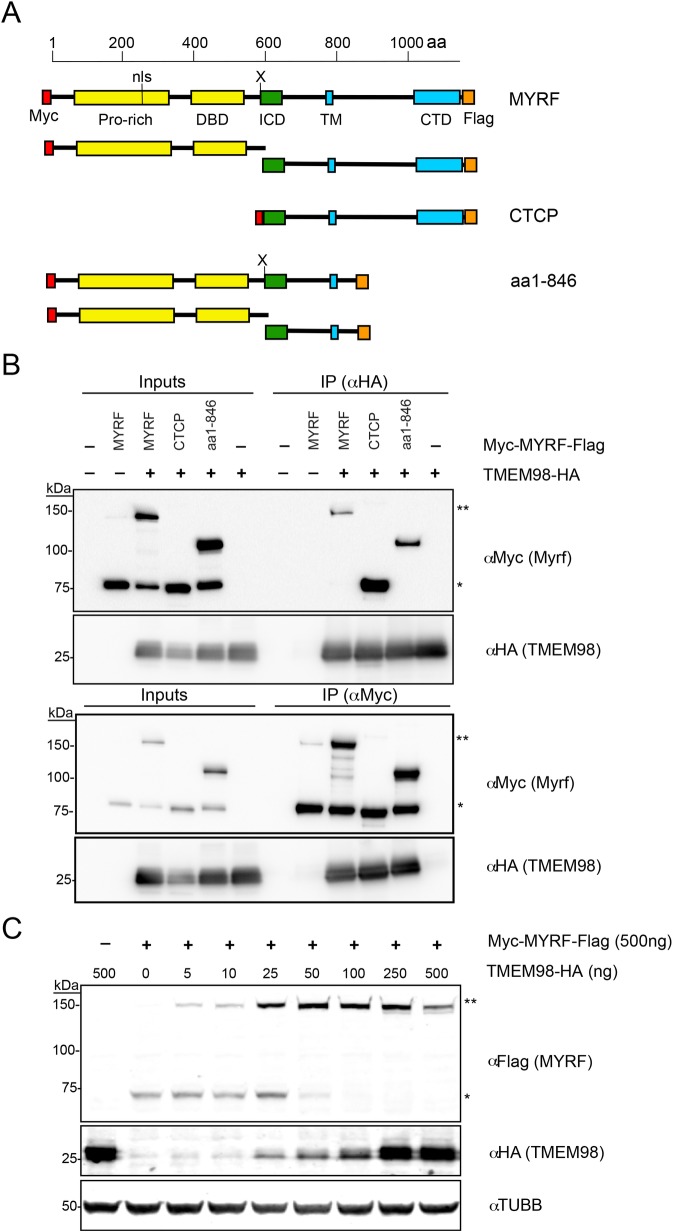
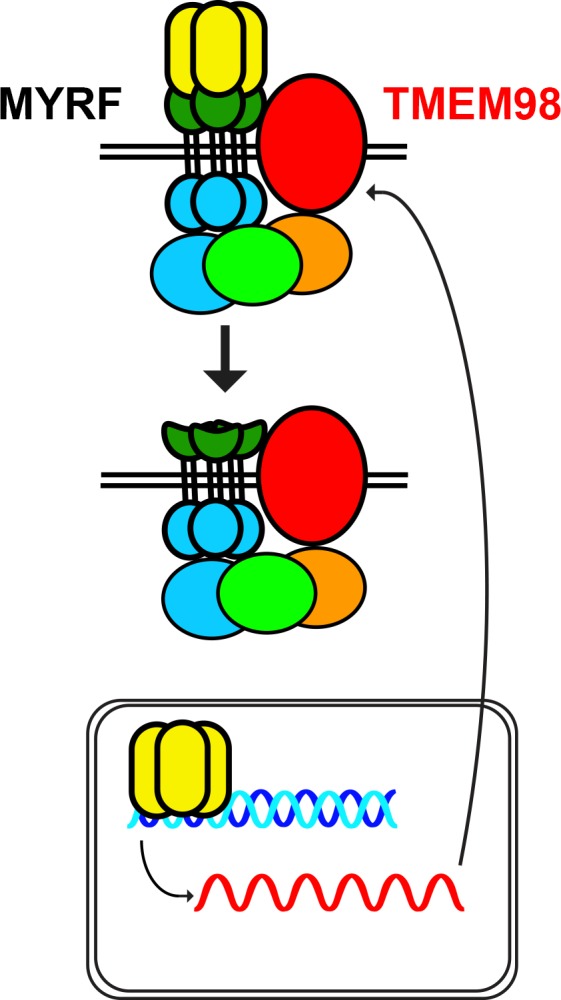
Nanophthalmos is a rare, potentially devastating eye condition characterized by small eyes with relatively normal anatomy, a high hyperopic refractive error, and frequent association with angle closure glaucoma and vision loss. The condition constitutes the extreme of hyperopia or farsightedness, a common refractive error that is associated with strabismus and amblyopia in children. NNO1 was the first mapped nanophthalmos locus. We used combined pooled exome sequencing and strong linkage data in the large family used to map this locus to identify a canonical splice site alteration upstream of the last exon of the gene encoding myelin regulatory factor (MYRF c.3376-1G>A), a membrane bound transcription factor that undergoes autoproteolytic cleavage for nuclear localization. This variant produced a stable RNA transcript, leading to a frameshift mutation p.Gly1126Valfs*31 in the C-terminus of the protein. In addition, we identified an early truncating MYRF frameshift mutation, c.769dupC (p.S264QfsX74), in a patient with extreme axial hyperopia and syndromic features. Myrf conditional knockout mice (CKO) developed depigmentation of the retinal pigment epithelium (RPE) and retinal degeneration supporting a role of this gene in retinal and RPE development. Furthermore, we demonstrated the reduced expression of Tmem98, another known nanophthalmos gene, in Myrf CKO mice, and the physical interaction of MYRF with TMEM98. Our study establishes MYRF as a nanophthalmos gene and uncovers a new pathway for eye growth and development.


Conflict of interest statement

The authors have declared that no competing interests exist.

Figures

Fig 1
Fig 1. Clinical features of individuals in this study.
(A-G) NNO1 family member clinical imaging. (A) Ultrasound biomicroscopy showing shallow anterior chamber and narrow angles. (B-C) Optic disc photos of the right (B) and left (C) eye showing crowded discs with vascular tortuosity. (D-E) Wide-field 200-degree Optos autofluorescence images of right (D) and left (E) showing tortuous vasculature and highlighting small area of hyperfluorescence in the left eye below the inferiotemporal arcade. (F-G) SD-OCT images of right (F) and left (G) eye showing choroidal folds in the right eye and otherwise normal foveal structure. (H-J) Sporadic nanophthalmos case clinical images. (H-I) SD-OCT of right (H) and left eye (I) eye showing mild foveal hypoplasia. (J) Bscan ultrasound showing short axial length and reduced posterior segment dimensions (line). Scale bar, 200 μm.
Fig 2
Fig 2. Haplotype analysis and fine mapping of NNO1 interval.
(A) Updated NNO1 pedigree highlighting 4 individuals with dextrocardia (*) from different branches of the family. Blue box denotes subset of family that was subsequently chosen for segregation analysis. Black boxes indicate key regions of the pedigree with recombination events. (B) Haplotype analysis of key recombinants in the NNO1 pedigree showing minimal recombinant interval between D11S4191 and D11S1883 (highlighted in red). Disease haplotype is outlined with red boxes, and one example of shared non-disease haplotype is highlighted in green. Italics denote a deduced haplotype. (C) Genomic region encompassed by the non-recombinant interval on chromosome 11q (MYRF, ZP1, PPP1R32, and BEST1 location with the interval are highlighted in red).
Fig 3
Fig 3. The MYRF c.3376-1G>A variant co-segregates with the nanophthalmos within the NNO1 family.
(A) Schematic diagram of MYRF protein and functional domains. (B) Schematic and agarose gel electrophoresis for StyI restriction digest used to confirm variant segregation in NNO1 family within one large nuclear family branch. (C) Sequence of normal and variant MYRF with splice acceptor site (underlined) and predicted amino acids. Sequencing chromatograms confirming heterozygous c.3376-1G>A mutation. Pro-rich, proline-rich domain; nls, nuclear localization sequence; DBD, DNA binding domain; ICD, intramolecular chaperone domain; TM, transmembrane domain; CTD, C-terminal domain.
Fig 4
Fig 4. MYRF c.3376-1G>A variant disrupts mRNA splicing and produces a stable RNA species.
(A) Minigene splicing assay. Schematic diagram showing the design of the minigene assay, and sample chromatograms showing the wild-type and mutant cDNA species isolated from this assay. A single splice product was generated for each form, wild-type (WT) and mutant (Mut) RNA. The splice product for the mutant form uses a splice acceptor site one base pair downstream of the original splice site and creates a frameshift (see Fig 3C). (B) RT-PCR from individual IV-22 blood RNA. Schematic diagram of the experiment is shown with sequence chromatograms from representative cloned RT-PCR products demonstrated. The mutant clones comprised 42% (3/7) of the spliced RNA species. (C) Predicted effect of splice site mutation on C-terminal amino acid sequence, showing frameshift and replacement of the final 26 amino acids with 30 different amino acids. A putative glycosylation site is marked with a *.
Fig 5
Fig 5. MYRF is expressed in the RPE and loss of MYRF in mouse leads to pigmentary change in the mouse RPE.
(A) qRT-PCR showing relative expression of MYRF in human ocular and adnexal tissue. MYRF expression is normalized to GAPDH and reported as expression level relative to extraocular muscle. (B-C) Low-magnification (B) and high magnification (C) RPE flatmounts from P22 control (Myrf+/fl or Myrffl/fl) and Myrf heterozygous and homozygous conditional knockout mice (RxCre;Myrf+/fl and RxCre;Myrffl/fl) showing patchy areas of hypopigmentation in the RxCre;Myrffl/fl mice. (D-F) H&E histology of RPE from the above mice at E15.5 (D), P3 (E), P14 (F), and P22 (G) showing early loss of RPE pigmentation (D) in RxCre;Myrffl/fl mice, which persists after retinal histogenesis is complete (G). TM, trabecular meshwork; CB, ciliary body, Chor, choroid; PPS, peripapillary sclera; ONH, optic nerve head; PLON, post-laminar optic nerve. Scale bar, 500 μm in B, 100 μm in C, 50 μm in D, 25 μm in E.
Fig 6
Fig 6. Loss of MYRF leads to early retinal degeneration in mice.
(A-C) H&E histology of P3 (A), P14 (B), and P22 (C) control (Myrf+/fl or Myrffl/fl) or Myrf heterozygous and homozygous conditional knockout mice (RxCre;Myrf+/fl and RxCre;Myrffl/fl). RxCre;Myrffl/fl retinas have shortened inner and outer segments, but retinal structure during development is preserved. RxCre;Myrf+/fl are structurally indistinguishable from control. (D-E) Low magnification (D) and high magnification (E) images of photoreceptor immunolabeling in P22 animals. Mouse cone arrestin (mCar, green) and rhodopsin (Rho, red) and DAPI (blue) were used to mark cones, rods, and nuclei, respectively. (F) Quantitative analysis of inner/outer segment area compared to total retinal area. (G) Quantitative analysis of cone fraction compared to fraction of total retinal cells. There is a significant decrease in IS/OS area and cone fraction in RxCre;Myrffl/fl retinas. n = 8 eyes, 6 animals (control); n = 6 eyes, 3 animals (RxCre;Myrf+/fl), n = 4 eyes, 4 animals (RxCre;Myrffl/fl). Mean±standard deviation are plotted along with each individual eye data point. **, p<0.01. Scale bar, 50μm.
Fig 7
Fig 7. Loss of MYRF leads to global retinal dysfunction and patchy outer retinal atrophy.
(A-C) Representative central color fundus photos (A) and central (B) and peripheral (C) SD-OCT from 10-month old eyes from control (Myrffl/fl or Myrf+/fl), RxCre;Myrf+/fl and RxCre;Myrffl/fl mice. Patchy areas of atrophy with RPE pigment changes are seen most prominently in RxCre; Myrf fl/fl eyes (A), and correspond to outer retinal and RPE loss on OCT (C) with relatively preserved peripapillary retina (B). (D-I) Electroretinography of 10-month old control (Myrffl/fl or Myrf+/fl), RxCre;Myrf+/fl and RxCre;Myrffl/fl mice. (D-F) Representative electroretinogram traces from 10-month old mice under scotopic (D), photopic (E), or photopic 9.9 Hz flicker conditions with the noted intensity stimuli. Both scotopic and photopic responses are diminished in RxCre;Myrffl/fl eyes compared to controls. (G-I) Scotopic a-wave (G), scotopic B-wave, and photopic B-wave amplitudes and comparison statistics across varying intensity stimuli. Error bars indicate standard deviation and are noted by the shaded grey for the control group. Summary statistics for comparisons of RxCre;Myrf+/fl and RxCre;Myrffl/fl to control eyes are shown with stars. In RxCre;Myrffl/fl, scotopic a-wave ERG amplitudes are reduced by 45–50% and B-wave amplitudes are reduced 35–45%, while photopic B-wave amplitudes are reduced 50–60%. Control n = 4 eyes from 2 animals, RxCre;Myrf+/fl n = 4 eyes from 2 animals, RxCre;Myrffl/fl n = 12 eyes from 6 animals. Mean±standard deviation. ***, p < 0.001; **, p < 0.01; * p < 0.05.
Fig 8
Fig 8. TMEM98 is genetically downstream of MYRF.
(A-B) Taqman qRT-PCR analysis of RPE expressed genes important for nanophthalmos (Myrf, Best1, Mfrp, Tmem98) in Myrf+/fl, RxCre;Myrf+/fl and RxCre;Myrffl/fl eyes at P3 (A) and P22 (B). There is significantly reduced expression of Tmem98 in RxCre;Myrffl/fl compared to wild-type, but comparable levels of expression of Mfrp and Best1. (C) TMEM98 staining in embryonic (E15.5) mouse eyes showing loss of TMEM98 staining in RxCre;Myrffl/fl compared to controls. (D-E) Mouse RPE flat mounts from P7 (D) and P22 (E) eyes showing decreased TMEM98 staining (red) and altered localization in RxCre;Myrffl/fl compared to controls. DAPI (blue) is used to counterstain nuclei. ***, p < 0.001; **, p < 0.01; * p < 0.05.
Fig 9
Fig 9. MYRF physically interacts with TMEM98.
(A) Schematic diagram of N-terminal Myc-tagged and C-terminal HA-tagged MYRF constructs used for co-immunoprecipitation experiments. Below each construct, the observed cleavage products are shown. Note that only the N-terminal product can be detected with anti-Myc, and the C-terminal product with anti-FLAG, and all constructs are expected to be cleaved except the one corresponding to the already-cleaved C-terminal cleavage product. (B) Co-immunoprecipitation (co-IP) experiments with HA-tagged TMEM98 and Myc-tagged MYRF constructs in HEK293T cells. Extracts from HEK293T cells were transfected with the indicated constructs, and then immunoprecipitated with anti-HA (top) or anti-Myc (bottom). Western blots against Myc or HA are shown for each immunoprecipitation experiment. HA-TMEM98 immunoprecipitates with either full-length Myc-MYRF, the uncleaved form of a Myc-MYRF1-846 construct or a Myc-C-terminal-cleavage-product (aa587-1139), mapping the region of interaction to MYRF587-846. (C) Western blots showing stabilization of uncleaved MYRF in a dose dependent manner by increasing levels of TMEM98. Extracts from HEK293T cells were transfected with myc-MYRF-FLAG and increasing doses of HA-TMEM98, and subsequently blotted against C-terminal FLAG tag (MYRF), N-terminal HA tag (TMEM98), and loading control β-III tubulin (TUBB3). MYRF, full-length MYRF; CTCP, C-terminal cleavage product; aa1-846, MYRF truncated construct (amino acids 1–846); ** corresponds to full-length MYRF band, * corresponds to cleavage product band (N-terminal in B, C-terminal in C). The N-terminal and C-terminal cleavage products run at a similar size due to post-translational modification.
Fig 10
Fig 10. Model of MYRF and TMEM98 function.
MYRF interacts with TMEM98 and other factors, as yet unidentified, and upon cleavage activates transcription of specific downstream genes, including TMEM98, in various tissues including RPE. MYRF domains including the N-terminal (yellow), intramolecular chaperone (green), and C-terminal (blue) domains are highlighted.

Similar articles

Cited by

References

    1. Flaxman SR, Bourne RRA, Resnikoff S, Ackland P, Braithwaite T, et al. (2017) Global causes of blindness and distance vision impairment 1990–2020: a systematic review and meta-analysis. Lancet Glob Health 5: e1221–e1234. 10.1016/S2214-109X(17)30393-5 - DOI - PubMed
    1. Day AC, Khawaja AP, Peto T, Hayat S, Luben R, et al. (2013) The small eye phenotype in the EPIC-Norfolk eye study: prevalence and visual impairment in microphthalmos and nanophthalmos. BMJ Open 3. - PMC - PubMed
    1. Hoffman RS, Vasavada AR, Allen QB, Snyder ME, Devgan U, et al. (2015) Cataract surgery in the small eye. J Cataract Refract Surg 41: 2565–2575. 10.1016/j.jcrs.2015.10.008 - DOI - PubMed
    1. Carricondo PC, Andrade T, Prasov L, Ayres BM, Moroi SE (2018) Nanophthalmos: A Review of the Clinical Spectrum and Genetics. J Ophthalmol 2018: 2735465 10.1155/2018/2735465 - DOI - PMC - PubMed
    1. Hendriks M, Verhoeven VJM, Buitendijk GHS, Polling JR, Meester-Smoor MA, et al. (2017) Development of Refractive Errors-What Can We Learn From Inherited Retinal Dystrophies? Am J Ophthalmol 182: 81–89. 10.1016/j.ajo.2017.07.008 - DOI - PubMed

Publication types

MeSH terms

Supplementary concepts