. 2019 Apr 24:7:3.
doi: 10.1186/s40170-019-0195-x. eCollection 2019.

Stratification of cancer and diabetes based on circulating levels of formate and glucose

Collaborators, Affiliations

Stratification of cancer and diabetes based on circulating levels of formate and glucose

Matthias Pietzke et al. Cancer Metab. .

Abstract

Background: Serum and urine metabolites have been investigated for their use as cancer biomarkers. The specificity of candidate metabolites can be limited by the impact of other disorders on metabolite levels. In particular, the increasing incidence of obesity could become a significant confounding factor.

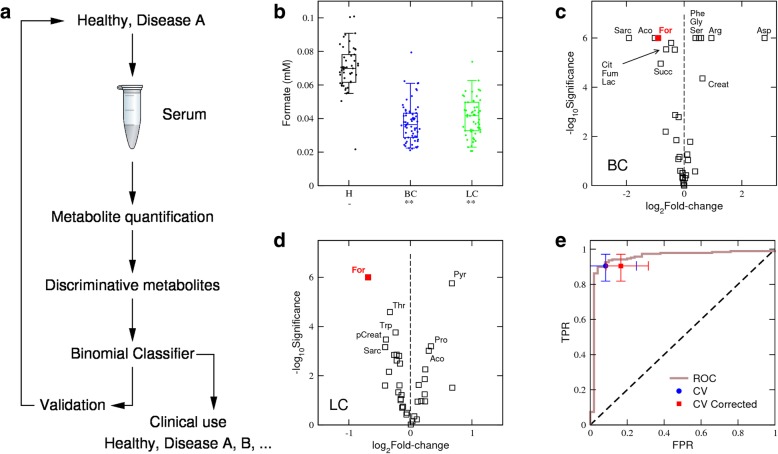
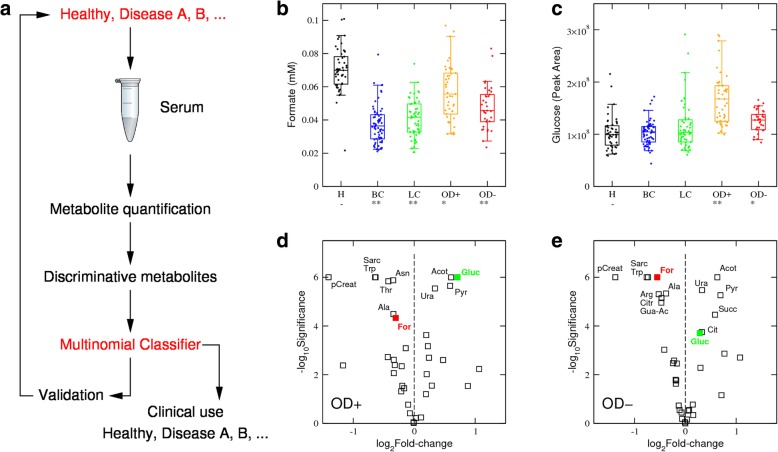
Methods: Here we developed a multinomial classifier for the stratification of cancer, obesity and healthy phenotypes based on circulating glucose and formate levels. We quantified the classifier performance from the retrospective analysis of samples from breast cancer, lung cancer, obese individuals and healthy controls.

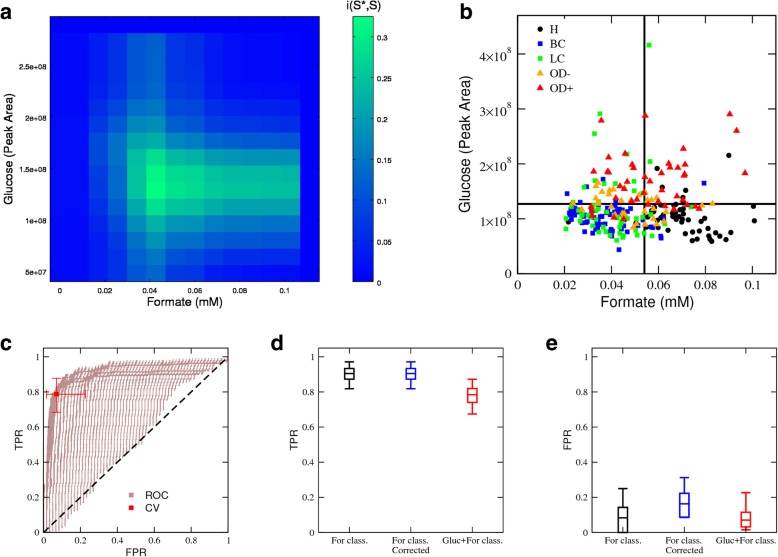
Results: We discovered that circulating formate levels are significantly lower in breast and lung cancer patients than in healthy controls. However, the performance of a cancer classifier based on formate levels alone is limited because obese patients also have low serum formate levels. By introducing a multinomial classifier based on circulating glucose and formate levels, we were able to improve the classifier performance, reaching a true positive rate of 79% with a false positive rate of 8%.

Conclusions: Circulating formate is reduced in HER2+ breast cancer, non-small cell lung cancer and highly obese patients relative to healthy controls. Further studies are required to determine the relevance of these observations in other cancer types and diseases.

Keywords: Biomarker; Cancer; Formate; Obesity; Serum metabolomics.


Conflict of interest statement

For the healthy controls, diabetes patients and long cancer patients, written informed consent was obtained from all participants as required by the ethics committee of the Hospital Universitari Sant Joan de Reus (Reus, Spain). For the breast cancer cohort, written informed consent was obtained from all participants as required by the ethics committee of the Dr. Josep Trueta Hospital (Girona, Spain) and independent Institutional Review Boards at each site participating in the METTEN study. All procedures were in accordance with the ethical standards of the institutional research committees and with the 1964 Helsinki Declaration and its later amendments or comparable ethical standards.Not applicable.The authors declare that they have no competing interest.Springer Nature remains neutral with regard to jurisdictional claims in published maps and institutional affiliations.

Figures

Fig. 1
Fig. 1
Formate classifier. a Schematic representation of a standard case-control study to identify and validate disease metabolite biomarkers. b Box plots of serum formate levels across healthy controls (H), HER2+ breast cancer (BC) and non-small cell lung cancer (LC) samples. Each point represents a sample, the error bars indicate the range excluding the lowest 5% and highest 5% values, boxes the range excluding the lowest 25% and highest 25% values, and the line within the box the median. Asterisk/double asterisks denote a significant difference of 10−3/10−6 relative to healthy controls (−), two-tailed t test with unequal variance. c, d Volcano plots reporting the statistical significances vs fold change of metabolite levels relative to the healthy controls, in BC (c) and LC (d). Each point represents a metabolite and selected metabolites are indicated by their abbreviated name. e ROC plot for the formate-based classifier (brown line), together with the FPR and TPR obtained from cross-validations not corrected (CV) and accounting (CV corrected) for obesity incidence The symbol reports the median and the error bars the observed range excluding the 5% lowest and largest values
Fig. 2
Fig. 2
(Glucose,Formate) classifier. a Schematic representation of the proposed study design to identify and validate disease metabolite biomarkers considering the prevalence of multiple diseases. Box plots of formate (b) and glucose (c) levels across the healthy controls (H), HER2+ breast cancer (BC), non-small cell lung cancer (LC), severe obesity without diabetes (OD−) and severe obesity with diabetes (OD+) samples. Each point represents a sample, the error bars indicate the range excluding the lowest 5% and highest 5% values, boxes the range excluding the lowest 25% and highest 25% values, and the line within the box the median. Asterisk/double asterisks denote a significant difference of 10−3/10−6 relative to healthy controls (−), two-tailed t test with unequal variance. d, e Volcano plots reporting the statistical significances vs fold change of metabolite levels in the indicated group relative to the healthy controls, in OD+ (d) and OD- (e). Each point represents a metabolite and selected metabolites are indicated by the labels
Fig. 3
Fig. 3
Performance of the (Glucose,Formate) classifier. a Colour map of the relative mutual information between the classifier prediction and the reference classification as a function of the formate and glucose thresholds. b Scatter plot of human serum samples as a function of the formate and glucose concentrations, colour coded by the sample subtypes. The horizontal and vertical lines represent the best glucose and formate threshold, respectively. c ROC plot for the glucose + formate-based classifier, focusing on the cancer class. The brown area reports the FPR and TPR for different formate and glucose thresholds and the red symbol the corresponding cross-validation values (symbol for median and error bars for observed range excluding the 5% lowest and largest values). d, e Comparison of the different classifiers according to their TPR (d) and FPR (e). Corrected indicates accounting for obesity incidence. Error bars indicate the range excluding the lowest 5% and highest 5% values, boxes the range excluding the lowest 25% and highest 25% values, and the line within the box the median
Fig. 4
Fig. 4
Cancer type specific metabolites. Box plots of metabolite levels manifesting a significant difference between breast or lung cancer and the other groups. The sample groups include healthy controls (H), HER2+ breast cancer (BC), non-small cell lung cancer (LC), severe obesity without diabetes (OD−) and severe obesity with diabetes (OD+) samples. Each point represents a sample, the error bars indicate the range excluding the lowest 5% and highest 5% values, boxes the range excluding the lowest 25% and highest 25% values, and the line within the box the median. Asterisk/double asterisks denote a significant difference of 10−3/10−6 relative to BC (ad) or LC (e, f), two-tailed t test with unequal variance

References

    1. American Diabetes A Standards of medical care in diabetes--2010. Diabetes Care. 2010;33(Suppl 1):S11–S61. doi: 10.2337/dc10-S011. - DOI - PMC - PubMed
    1. Yonezawa K, Nishiumi S, Kitamoto-Matsuda J, Fujita T, Morimoto K, Yamashita D, et al. Serum and tissue metabolomics of head and neck cancer. Cancer Genomics Proteomics. 2013;10(5):233–238. - PubMed
    1. Schwimmer R, Ojakian GK. The alpha 2 beta 1 integrin regulates collagen-mediated MDCK epithelial membrane remodeling and tubule formation. J Cell Sci. 1995;108(Pt 6):2487–2498. - PubMed
    1. Hadi NI, Jamal Q, Iqbal A, Shaikh F, Somroo S, Musharraf SG. Serum metabolomic profiles for breast cancer diagnosis, grading and staging by gas chromatography-mass spectrometry. Sci Rep. 2017;7(1):1715. doi: 10.1038/s41598-017-01924-9. - DOI - PMC - PubMed
    1. Perez-Rambla C, Puchades-Carrasco L, Garcia-Flores M, Rubio-Briones J, Lopez-Guerrero JA, Pineda-Lucena A. Non-invasive urinary metabolomic profiling discriminates prostate cancer from benign prostatic hyperplasia. Metabolomics. 2017;13(5):52. doi: 10.1007/s11306-017-1194-y. - DOI - PMC - PubMed