. 2019 Mar 4;5(2):160-169.
doi: 10.1002/cre2.166. eCollection 2019 Apr.

Expression and role of regulator of G-protein signaling 5 in squamous cell carcinoma of the tongue

Affiliations

Expression and role of regulator of G-protein signaling 5 in squamous cell carcinoma of the tongue

Yushi Abe et al. Clin Exp Dent Res. .

Abstract

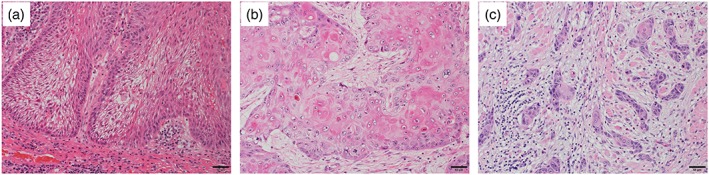
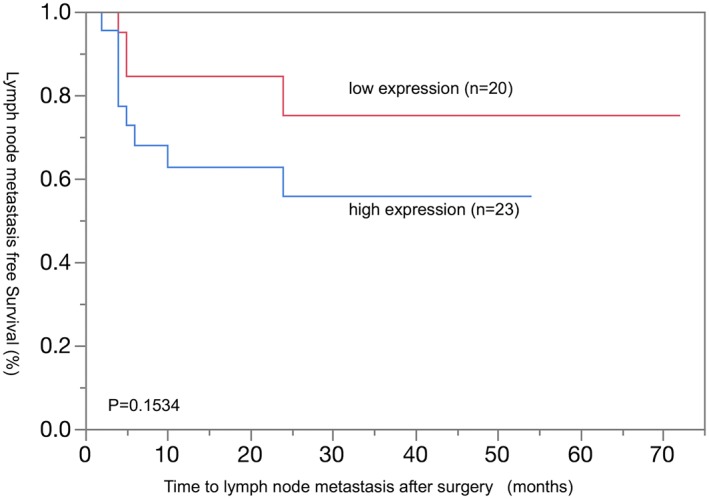
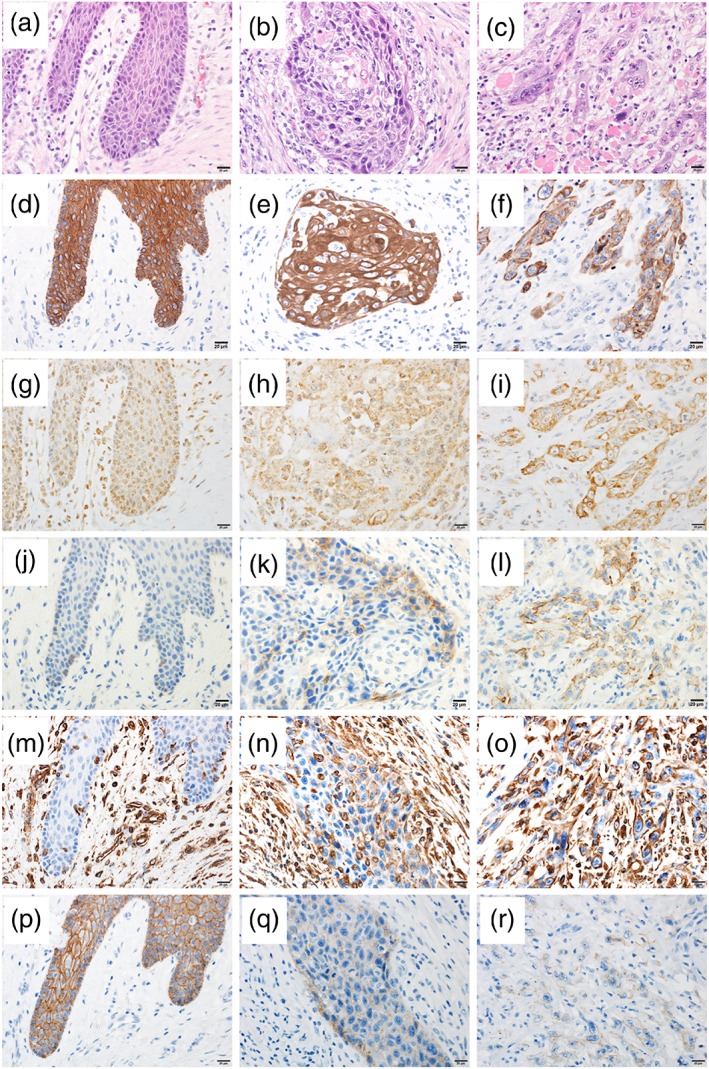
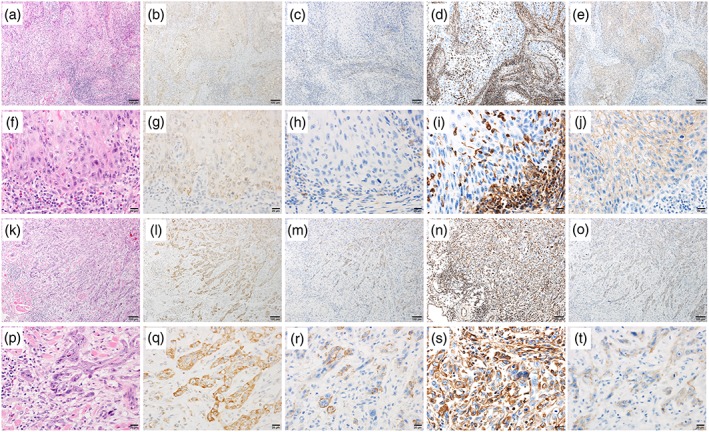
Regulator of G-protein signaling (RGS) 5 acts as a GTPase-activating protein to negatively regulate G-protein signaling. RGS5 is reportedly related to the invasion and metastasis of cancers, such as nonsmall lung cancer and hepatocellular carcinoma. We examined RGS5 expression and its relationship with invasion in squamous cell carcinoma (SCC) of the tongue. For immunohistochemical analysis of RGS5, we used SCC tissues of the tongue obtained from 43 patients. We examined the relationship between RGS5 expression in the deepest point of invasion and clinicopathological features. Because the invasion and metastasis of cancers are related to epithelial-mesenchymal transition (EMT), we carried out staining for N-cadherin, vimentin, and E-cadherin to examine the relationship between EMT and RGS5. RGS5 expression in the deepest point of invasion in SCC of the tongue was observed in 32 cases (75%). Immunohistochemical analysis revealed a significant correlation between RGS5 expression in the aggressive invasion pattern, invasion depth, and lymphovascular invasion. Kaplan-Meier analysis revealed that high RGS5 expression was associated with postoperative early lymph node metastasis. Further, a significant positive correlation was observed between RGS5 and N-cadherin (P = 0.0003) and vimentin (P < 0.0001). In contrast, E-cadherin and RGS5 or vimentin were significantly negatively correlated (P < 0.0001-0.005). The findings indicate that RGS5 expression is related to tumor invasion and EMT in SCC of the tongue and that RGS5 may predict postoperative early lymph node metastasis. Therefore, RGS5 may be a useful prognostic biomarker of the surgically resected SCC and a potential target of molecular therapy for treating SCC of the tongue.

Keywords: RGS5; immunohistochemical staining; oral cancer; tongue.


Conflict of interest statement

The authors have no conflict of interest.

Figures

Figure 1
Figure 1
Representative photomicrographs of squamous cell carcinoma of the tongue with three different invasion patterns in the invasive portions: (a) expansive type, (b) intermediate type, and (c) infiltrative type
Figure 2
Figure 2
Immunostaining of regulator of G‐protein signaling 5 in squamous cell carcinoma of the tongue. The staining intensity was graded into four levels: (a) Score 0: negative; (b) Score 1: weakly positive; (c) Score 2: moderately positive; and (d) Score 3: strongly positive
Figure 3
Figure 3
Immunostaining of N‐cadherin, vimentin, and E‐cadherin in squamous cell carcinoma of the tongue. The staining intensity of N‐cadherin was graded into four levels: (a) Score 0: negative; (b) Score 1: weakly positive; (c) Score 2: moderately positive; and (d) Score 3: strongly positive. The staining intensity of vimentin was graded into four levels: (e) Score 0: negative; (f) Score 1: weakly positive; (g) Score 2: moderately positive; and (h) Score 3: strongly positive. The staining intensity of E‐cadherin was graded into four levels: (i) Score 0: negative; (j) Score 1: weakly positive; (k) Score 2: moderately positive; and (l) Score 3: strongly positive
Figure 4
Figure 4
Relationship between expression of regulator of G‐protein signaling 5 and time to lymph node metastasis after surgery
Figure 5
Figure 5
Representative photomicrographs of hematoxylin and eosin staining and staining for CK5/6, regulator of G‐protein signaling 5, N‐cadherin, vimentin, and E‐cadherin in squamous cell carcinoma of the tongue with different invasion patterns. (a), (b), and (c) show hematoxylin and eosin in the expansive, intermediate, and infiltrative types, respectively. (d), (e), and (f) show CK5/6 expression in the expansive, intermediate, and infiltrative types, respectively. (g), (h), and (i) show regulator of G‐protein signaling 5 expression in the expansive, intermediate, and infiltrative types, respectively. (j), (k), and (l) show N‐cadherin expression in the expansive, intermediate, and infiltrative types, respectively. (m), (n), and (o) show vimentin expression in the expansive, intermediate, and infiltrative types, respectively. (p), (q), and (r) show E‐cadherin expression in the expansive, intermediate, and infiltrative types, respectively
Figure 6
Figure 6
Representative photomicrographs of hematoxylin and eosin (H&E), CK5/6, regulator of G‐protein signaling (RGS) 5, N‐cadherin, vimentin, and E‐cadherin in squamous cell carcinoma of the tongue in noninvasive and invasive portions. (a), (b), (c), (d), and (e) show H&E, RGS5, N‐cadherin, vimentin, and E‐cadherin in noninvasive portions at 10× magnification. (f), (g), (h), (i), and (j) show H&E, RGS5, N‐cadherin, vimentin, and E‐cadherin in noninvasive portions at 40× magnification. (k), (l), (m), (n), and (o) show H&E, RGS5, N‐cadherin, vimentin, and E‐cadherin in invasive portions at 10× magnification. (p), (q), (r), (s), and (t) show H&E, RGS5, N‐cadherin, vimentin, and E‐cadherin in invasive portions at 40× magnification
Figure 7
Figure 7
Correlation among regulator of G‐protein signaling (RGS) 5, N‐cadherin, vimentin, and E‐cadherin expressions. (a), (b), (c), (d), and (e) show the expression relationships between RGS5 and N‐cadherin, RGS5 and vimentin, RGS5 and E‐cadherin, E‐cadherin and N‐cadherin, and E‐cadherin and vimentin, respectively. There was a significant positive correlation between RGS5 and N‐cadherin (a) and vimentin (b). In contrast, there was a significant negative correlation between E‐cadherin and RGS5 (c), N‐cadherin (d), and vimentin (e)

References

    1. Almangush, A. , Bello, I. O. , Coletta, R. D. , Makitie, A. A. , Makinen, L. K. , Kauppila, J. H. , … Salo, T. (2015). For early‐stage oral tongue cancer, depth of invasion and worst pattern of invasion are the strongest pathological predictors for locoregional recurrence and mortality. Virchows Archiv, 467(1), 39–46. 10.1007/s00428-015-1758-z - DOI - PubMed
    1. Brandwein‐Gensler, M. , Teixeira, M. S. , Lewis, C. M. , Lee, B. , Rolnitzky, L. , Hille, J. J. , … Wang, B. Y. (2005). Oral squamous cell carcinoma: Histologic risk assessment, but not margin status, is strongly predictive of local disease‐free and overall survival. The American Journal of Surgical Pathology, 29(2), 167–178. 10.1097/01.pas.0000149687.90710.21 - DOI - PubMed
    1. Chang, Y. C. , Nieh, S. , Chen, S. F. , Jao, S. W. , Lin, Y. L. , & Fu, E. (2010). Invasive pattern grading score designed as an independent prognostic indicator in oral squamous cell carcinoma. Histopathology, 57(2), 295–303. 10.1111/j.1365-2559.2010.03616.x - DOI - PubMed
    1. El‐Naggar, A. K. , Chan, J. K. C. , Grandis, J. R. , Takata, T. , & Slootweg, P. J. (2017). WHO classification of head and neck tumors (4th ed.) Lyon: IARC.
    1. Hu, M. , Chen, X. , Zhang, J. , Wang, D. , Fang, X. , Wang, X. , … Wang, Y. (2013). Over‐expression of regulator of G protein signaling 5 promotes tumor metastasis by inducing epithelial‐mesenchymal transition in hepatocellular carcinoma cells. Journal of Surgical Oncology, 108(3), 192–196. 10.1002/jso.23367 - DOI - PubMed

MeSH terms