. 2019 Mar 31:2019:5298792.
doi: 10.1155/2019/5298792. eCollection 2019.

Genetic Predisposition to Hepatocarcinogenesis in Inbred and Outbred Mouse Lines Selected for High or Low Inflammatory Response

Affiliations

Genetic Predisposition to Hepatocarcinogenesis in Inbred and Outbred Mouse Lines Selected for High or Low Inflammatory Response

Lilian Rego de Carvalho et al. J Immunol Res. .

Abstract

AIRmax and AIRmin mouse strains phenotypically selected for high and low acute inflammatory responsiveness (AIR) are, respectively, susceptible or resistant to developing hepatocellular carcinoma (HCC) induced by the chemical carcinogens urethane and diethylnitrosamine (DEN). Early production of TNF-α, IL-1β, and IL-6 in the liver after DEN treatment correlated with tumor development in AIRmax mice. Transcriptome analysis of livers from untreated AIRmax and AIRmin mice showed specific gene expression profiles in each line, which might play a role in their differential susceptibility to HCC. Linkage analysis with SNP markers in F2 (AIRmax×AIRmin) intercross mice revealed two quantitative trait loci (QTL) in chromosomes 2 and 9, which are significantly associated with the number and progression of urethane-induced liver tumors. An independent linkage analysis with an intercross population from A/J and C57BL/6J inbred mice mapped regions in chromosomes 1 and 7 associated with the progression of urethane-induced liver tumors, evidencing the heterogeneity of HCC genetic control.


Figures

Figure 1
Figure 1
Susceptibility to liver carcinogenesis in AIRmax and AIRmin male mice. N_2 represents the number of liver tumors with diameter ≥ 2 mm. Results are expressed as mean and standard error in groups of 10 mice.
Figure 2
Figure 2
Macroscopic aspect of the AIRmax male mouse liver at 34 weeks after DEN treatment (a). HE-stained histological section showing high-grade hepatocarcinoma with atypical hepatocytes arranged in macrotrabecules forming pseudoacini (b, 200x). AIRmax liver after urethane treatment (c); HE-stained section showing high-grade hepatocarcinoma, presence of steatosis, cellular pleomorphism, alteration of lobular architecture of the hepatic parenchyma, and intratumoral inflammatory infiltrate. Arrow indicates an aberrant mitosis (d, 1000x).
Figure 3
Figure 3
IL-6, IL-1β, and TNF-α levels in liver macerate supernatants of AIRmax and AIRmin mice treated with 25 mg/kg bw DEN (3 males and 3 females in each group). p < 0.05 treated vs. control; &p < 0.05 AIRmax vs. AIRmin; #p < 0.05 males vs. females.
Figure 4
Figure 4
Genome-wide interval mapping of urethane-induced liver tumors. Number of liver tumors with diameter > 2 mm (N_2) revealed two significant loci at chromosomes 2 and 9 and one suggestive locus at chromosome 5; the threshold values for significant linkage at p < 0.05 and p < 0.01 are LOD scores = 4.5 and 5.4, respectively, and for suggestive linkage at p < 0.1 is LOD score = 4.1.
Figure 5
Figure 5
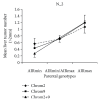
QTLs on chromosomes 2 and 9 modulate liver carcinogenesis susceptibility in F2 (AIRmax×AIRmin) mice. The graph shows the effects of the SNP genotypes located at the peak LOD score regions in chromosomes 2 and 9. Significance of differences between AIRmin- and AIRmax-associated SNP genotypes at Chrom2 #p = 0.026, Chrom9 &p = 0.0016, and Chrom2+9 p = 0.0137.
Figure 6
Figure 6
Genome-wide interval mapping of urethane-induced liver tumors; the threshold values for significant linkage at p < 0.05 and for suggestive linkage at p < 0.1 are LOD scores = 3.83 and 3.48, respectively.
Figure 7
Figure 7
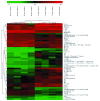
Heatmap of differentially expressed genes in normal livers from untreated AIRmax and AIRmin mice. The Mouse Gene 1.0 ST Array was used to identify sets of differentially expressed genes (p < 0.001). The Significance Analysis of Microarrays (SAM) using a 1.5-fold-change minimal difference revealed distinct gene expression profiles between AIRmax and AIRmin mice.

References

    1. Ferlay J., Soerjomataram I., Dikshit R., et al. Cancer incidence and mortality worldwide: sources, methods and major patterns in GLOBOCAN 2012. International Journal of Cancer. 2015;136(5):E359–E386. doi: 10.1002/ijc.29210. - DOI - PubMed
    1. Venook A. P., Papandreou C., Furuse J., de Guevara L. L. The incidence and epidemiology of hepatocellular carcinoma: a global and regional perspective. The Oncologist. 2010;15(Supplement 4):5–13. doi: 10.1634/theoncologist.2010-S4-05. - DOI - PubMed
    1. Montalto G., Cervello M., Giannitrapani L., Dantona F., Terranova A., Castagnetta L. A. Epidemiology, risk factors, and natural history of hepatocellular carcinoma. Annals of the New York Academy of Sciences. 2002;963:13–20. - PubMed
    1. Yeh S. H., Chen P. J. Gender disparity of hepatocellular carcinoma: the roles of sex hormones. Oncology. 2010;78(1):172–179. doi: 10.1159/000315247. - DOI - PubMed
    1. Ibanez O. M., Stiffel C., Ribeiro O. G., et al. Genetics of nonspecific immunity: I. bidirectional selective breeding of lines of mice endowed with maximal or minimal inflammatory responsiveness. European Journal of Immunology. 1992;22(10):2555–2563. doi: 10.1002/eji.1830221014. - DOI - PubMed

MeSH terms