. 2019 Jun 20;47(11):5792-5808.
doi: 10.1093/nar/gkz307.

HCF-2 inhibits cell proliferation and activates differentiation-gene expression programs

Affiliations

HCF-2 inhibits cell proliferation and activates differentiation-gene expression programs

Daria Gudkova et al. Nucleic Acids Res. .

Abstract

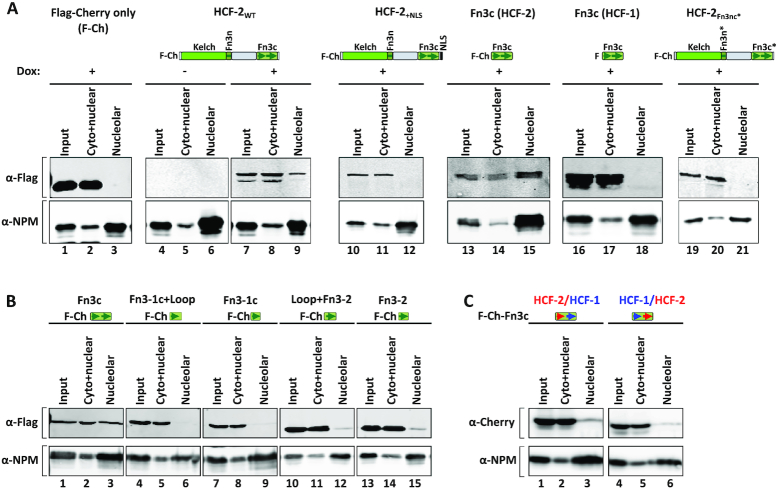
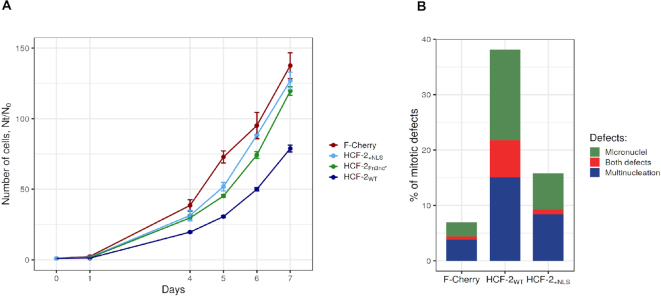
HCF-2 is a member of the host-cell-factor protein family, which arose in early vertebrate evolution as a result of gene duplication. Whereas its paralog, HCF-1, is known to act as a versatile chromatin-associated protein required for cell proliferation and differentiation, much less is known about HCF-2. Here, we show that HCF-2 is broadly present in human and mouse cells, and possesses activities distinct from HCF-1. Unlike HCF-1, which is excluded from nucleoli, HCF-2 is nucleolar-an activity conferred by one and a half C-terminal Fibronectin type 3 repeats and inhibited by the HCF-1 nuclear localization signal. Elevated HCF-2 synthesis in HEK-293 cells results in phenotypes reminiscent of HCF-1-depleted cells, including inhibition of cell proliferation and mitotic defects. Furthermore, increased HCF-2 levels in HEK-293 cells lead to inhibition of cell proliferation and metabolism gene-expression programs with parallel activation of differentiation and morphogenesis gene-expression programs. Thus, the HCF ancestor appears to have evolved into a small two-member protein family possessing contrasting nuclear versus nucleolar localization, and cell proliferation and differentiation functions.


Figures

Figure 1.
Figure 1.
HCF-2 conservation in vertebrates and cognate gene expression in mammalian cells. (A) Diagrams of human HCF-1, and human and mouse HCF-2. Percentage identity between the human HCF-1 and HCF-2 Kelch, Fn3n and Fn3c segments is given; NLS, nuclear localization signal. The Fn3n-to-Fn3c linker region in mHCF-2 used for antibody generation is indicated with a red bar. (B) Evolutionary tree of HCF-protein Kelch domains from 11 animal species inferred using the Minimum Evolution method (25). The optimal tree with the sum of branch length = 2.66193529 is shown. The percentage of replicate trees in which the associated taxa clustered together in the bootstrap test (500 replicates) (29) are shown next to the branches. The tree is drawn to scale, with branch lengths in the same units as those of the evolutionary distances used to infer the phylogenetic tree. Common name of species, presence of NLS and HCF-1PRO repeats are shown separately. n/a, not available. (C) RT-PCR of HCFC2 in the indicated cell lines of human (lanes 1–8) and mouse (lanes 9–10) origin. (D) Immunoblot of the indicated mouse cell line extracts probed with α-HCF-2 antibody described in Supplementary Figure S1.
Figure 2.
Figure 2.
HCF-2 fails to form a VIC with VP16FL (A), but addition of HCF-1 NLS sequence to the C-terminus of HCF-2 activates VIC formation with VP16FL (B). Immunopurified F-Cherry, F-Cherry-HCF-2WT or F-Cherry-HCF-2+NLS proteins were used for EMSA assay (see ‘Materials and Methods’ section). Lanes 1 and 4, probe alone with Oct-1 POU domain; lanes 2 and 5, Oct-1 POU domain and VP16ΔC; lanes 3 and 6, Oct-1 POU domain and VP16FL. (A) and (B) represent two different gels; models of VIC composition and formation are shown.
Figure 3.
Figure 3.
HCF-1 and HCF-2 display different subnuclear localization. (A) α-HCF-1 (top) and α-HCF-2 (bottom) immunoblot of protein complexes after immunoprecipitation from a MEF whole-cell extract with α-HCF-1 antibody (lane 1), α-HCF-2 antibody (lane 2) or non-immune IgG (lane 3). Lane 4, starting whole-cell lysate. (B) HEK-293 cells co-stained with mouse monoclonal α-HCF-1 (green) and rabbit polyclonal α-HCF-2 (red) antibodies. Left, nuclear staining with DAPI (blue); right, merge of individual HCF-1 and HCF-2 signals. (C) Co-immunostaining of HEK-293 cells with α-NPM antibody (red) and either polyclonal rabbit α-HCF-1 antibody (green, upper panels) or α-HCF-2 antibody (green, lower panels). Left panels, nuclear staining with DAPI (blue). Right, merge of NPM and HCF signals. (D) Immunoblot of samples after nucleolar fractionation of HEK-293 cells with HCF-1, HCF-2, and NPM antibodies as indicated. Lanes 1 and 4, starting whole-cell lysate; lanes 2 and 5, cytoplasmic and non-nucleolar fraction; lanes 3 and 6, nucleolar fraction.
Figure 4.
Figure 4.
HCF-2 is localized in the fibrillar center of nucleolar compartment. (A) Diagram of mammalian nucleolus with fibrillar centers (FC, red) surrounded by dense fibrillar component (DFC, blue) and further encircled by the granular component (GC, green). (B) Co-immunostaining of HeLa cells with α-HCF-2 antibody (green) and (left to right) antibodies for markers for the different subnucleolar regions (red): RPA194 (FC), NCL (DFC) and NPM (GC). Upper panels, nuclear staining with DAPI (blue). Bottom panels, enlargement of one cell with merge of HCF-2 and nucleolar maker signals is shown. Dashed line denotes the nuclear area.
Figure 5.
Figure 5.
Fn3c facilitates HCF-2 but not HCF-1 nucleolar localization. (A) F-Cherry-only (F-Ch), F-Cherry-HCF-2WT, F-Cherry-HCF-2+NLS, F-Cherry-HCF-2Fn3c, F-HCF-1Fn3c or F-Cherry-HCF-2Fn3nc* (see respective protein structure models on top) synthesis in HEK-293 T-REx cells was induced with doxycycline (1 μM for 24 h) and samples were subjected to nucleolar fractionation. Induction of recombinant protein synthesis is shown for F-Cherry-HCF-2WT (–, without doxycycline; +, with doxycycline). Presence or absence of recombinant HCF proteins was analyzed with α-Flag antibody (upper panels), and the quality of nucleolar purification assayed with the α-NPM antibody (lower panels). (B) Both Fn3c type repeats facilitate nucleolar localization of HCF-2. HEK-293 cells were transiently transfected with plasmids encoding F-Cherry-HCF-2Fn3c truncations and 24 h later collected for nucleolar fractionation. Presence or absence of recombinant F-Cherry-HCF-2Fn3nc truncations was analyzed with α-Flag antibody (upper panels), and the quality of nucleolar purification assayed with the α-NPM antibody (lower panels). (C) As in (B), but with plasmids encoding hybrid HCF-1 and HCF-2 F-Cherry-Fn3c sequences. HCF-2/HCF-1, Fn3–1cHCF-2/Fn3–2HCF-1 hybrid; HCF-1/HCF-2, Fn3–1cHCF-1/Fn3–2HCF-2.
Figure 6.
Figure 6.
Ectopic HCF-2 synthesis affects cell proliferation (A) and promotes mitotic defects (B). (A) Growth curves of HEK-293 T-REx cells with induced F-Cherry, F-Cherry-HCF-2WT, F-Cherry-HCF-2+NLS or F-Cherry-HCF-2Fn3nc* synthesis during 7 days after doxycycline addition at day 0. (B) Percentage of cells with mitotic defects (micronuclei, green; multinucleation, blue; or both, red) in F-Cherry, F-Cherry-HCF-2WT and F-Cherry-HCF-2+NLS containing cells 72 h after doxycycline induction.
Figure 7.
Figure 7.
Induced HCF-2 synthesis leads to up-regulation of development-associated genes and down-regulation of metabolic genes. (A) Normalized counts of 7175 differentially expressed genes (see text, and ‘Materials and Methods’ section) were used to group genes into four clusters (I–IV, right) by expression profiles with PAM algorithm. The scaled and centered mean of the two replicates of each timepoint/condition is shown in the heat-map, with relative abundance of transcript per gene (Z-score) color-coded as shown in color scale. Left, number of genes per cluster. (B) Silhouette widths of each PAM-generated gene cluster. Red line, average for all clusters Silhouette width; fractional numbers, average Silhouette width for each individual cluster. (C) Scatter plot of log2 (Fold change) of transcript abundance at days 2, 4 and 6 with respect to day 1. Genes are shown in the same order as in the heat-map.
Figure 8.
Figure 8.
REVIGO display of GO terms associated with genes enriched in (A) cluster III (up-regulated in the HCF-2WT sample) and (B) cluster IV (down-regulated in the HCF-2WT sample). List of GO-terms generated by cluster Profiler (see Supplementary Table S3) and selected for a P value <10−06 for cluster III and <10−05 for cluster IV was analyzed using the REVIGO tool with an allowed similarity parameter of 0.7. GO-term bubbles are colored with respect to P values as indicated in the associated color scales, bubble size indicates the frequency of the GO term in the underlying GOA database. (C and D) Selected GSEA enrichment plots for Hallmark gene sets of differentially expressed genes of day 1 and 6 of the HCF-2WT-samples for (C) down-regulated and (D) up-regulated pathways. Only the hallmarks most relevant to observed phenotype are shown (for more details of GSEA Hallmark sets see Supplementary Table S4 and Supplementary Figure S9).
Figure 9.
Figure 9.
(A) Illustration of the different properties of human HCF-1 and HCF-2 proteins (see text for details). (B) Structural representation of HCF protein structures in worm, fly, chimera, fish, mouse and human. For the domain descriptions see text and Figure 1A legend. Inverted arrow head represents a Taspase 1 cleavage site in fly HCF; black triangles in chimera HCF-1 (one) and HCF-2 (two) indicate degenerate HCF-1PRO repeats. The intensity of the blue and red colors labeling the Basic and Acidic regions indicates relative basic and acidic residue abundance: human, mouse, fish HCF-1 > chimera HCF-1 and HCF-2 > Drosophila HCF.

References

    1. Zhang J. Evolution by gene duplication: an update. Trends Ecol. Evol. 2003; 18:292–298.
    1. Conant G.C., Wolfe K.H.. Turning a hobby into a job: how duplicated genes find new functions. Nat. Rev. Genet. 2008; 12:938–950. - PubMed
    1. Taylor J.S., Raes J.. Duplication and divergence: the evolution of new genes and old ideas. Annu. Rev. Genet. 2004; 38:615–643. - PubMed
    1. Cao L., Peng B., Yao L., Zhang X., Sun K., Yang X., Yu L.. The ancient function of RB-E2F Pathway: insights from its evolutionary history. Biol. Direct. 2010; 5:55. - PMC - PubMed
    1. Iaquinta P., Lees J.A.. Life and death decisions by the E2F transcription factors. Curr. Opin. Cell Biol. 2007; 19:649–657. - PMC - PubMed

Publication types

MeSH terms