Review
. 2019 Jul;52(3):816-846.
doi: 10.1002/jaba.573. Epub 2019 May 3.

Resurgence as Choice: Implications for promoting durable behavior change

Affiliations
Review

Resurgence as Choice: Implications for promoting durable behavior change

Brian D Greer et al. J Appl Behav Anal. 2019 Jul.

Abstract

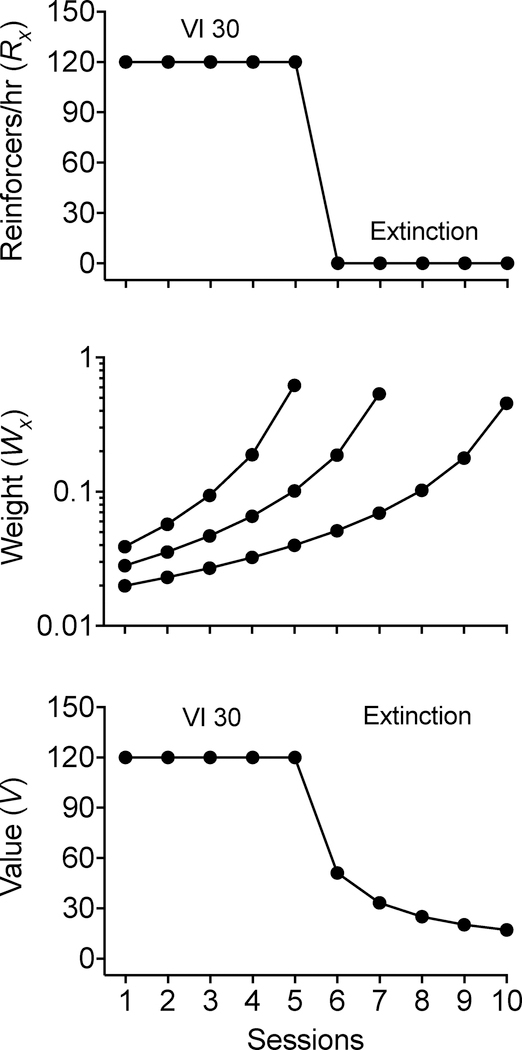
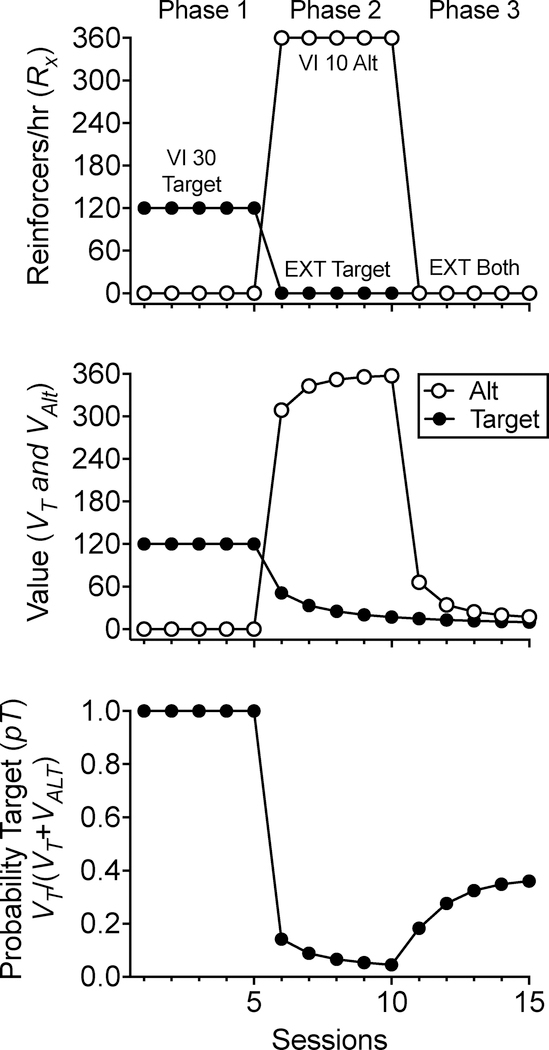
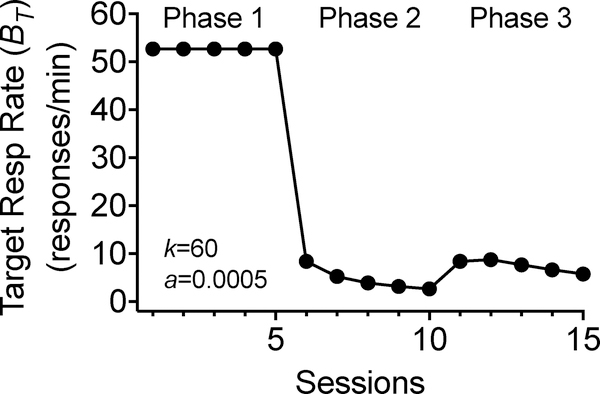
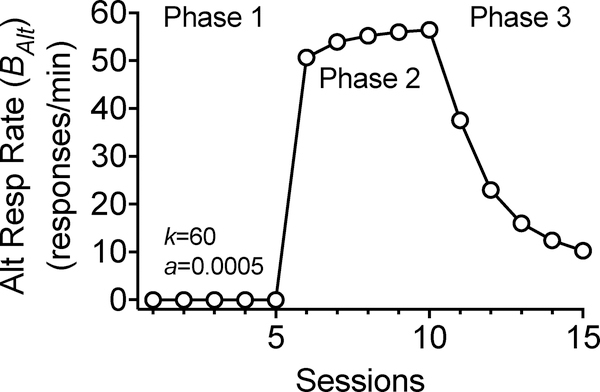
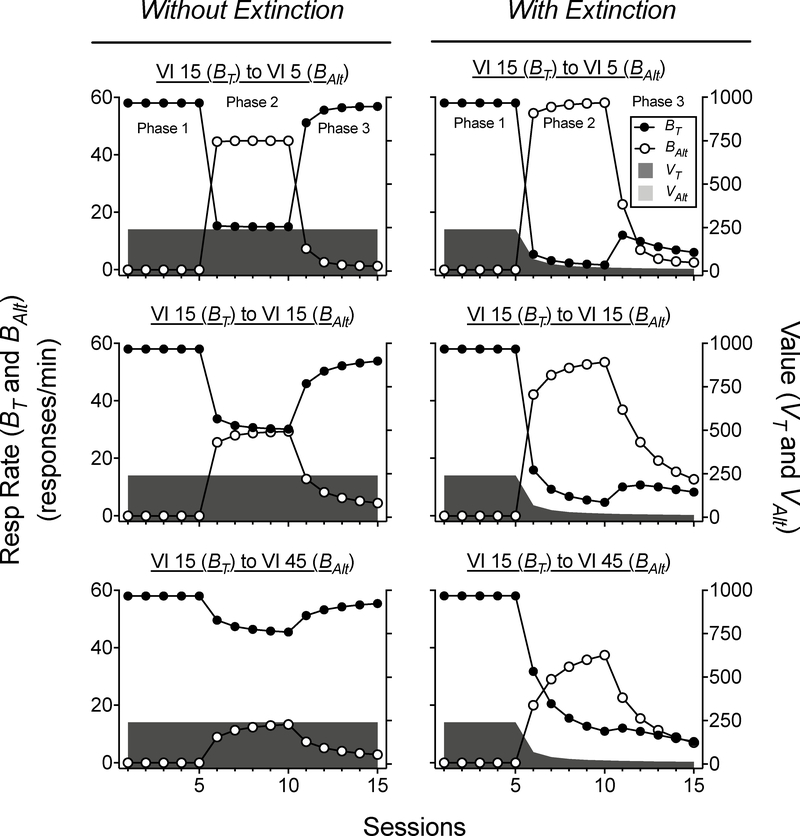
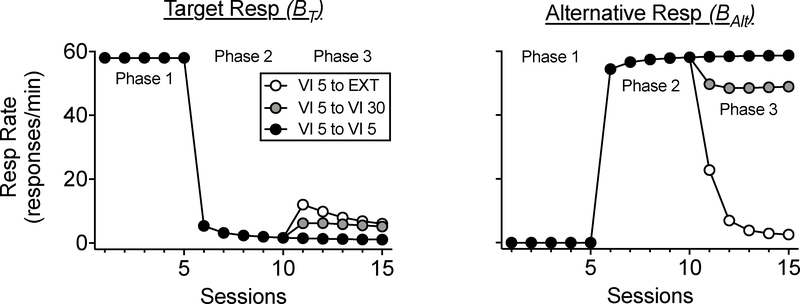
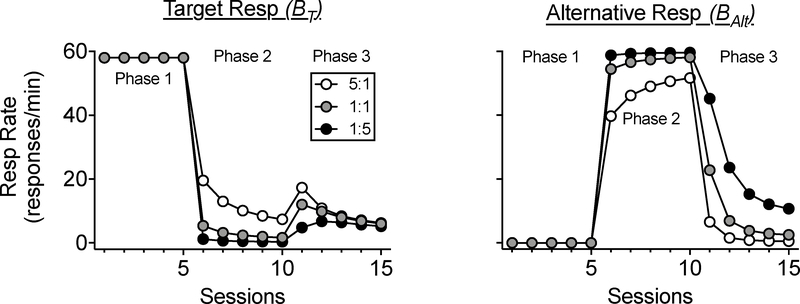
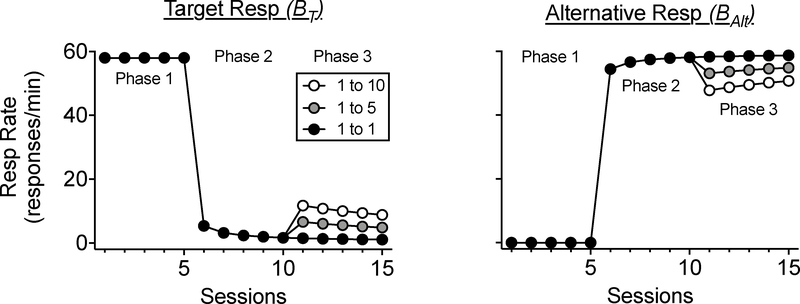
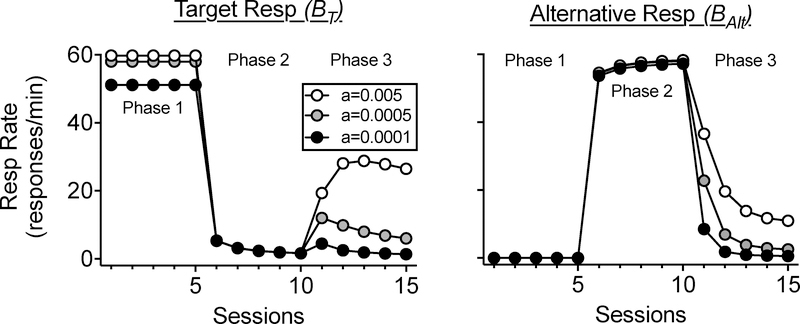
Resurgence is an increase in a previously suppressed behavior resulting from a worsening in reinforcement conditions for current behavior. Resurgence is often observed following successful treatment of problem behavior with differential reinforcement when reinforcement for an alternative behavior is subsequently omitted or reduced. The efficacy of differential reinforcement has long been conceptualized in terms of quantitative models of choice between concurrent operants (i.e., the matching law). Here, we provide an overview of a novel quantitative model of resurgence called Resurgence as Choice (RaC), which suggests that resurgence results from these same basic choice processes. We review the failures of the only other quantitative model of resurgence (i.e., Behavioral Momentum Theory) and discuss its shortcomings with respect to the limited range of circumstances about which it makes predictions in applied settings. Finally, we describe how RaC overcomes these shortcomings and discuss implications of the model for promoting durable behavior change.

Keywords: choice; differential reinforcement; problem behavior; relapse; resurgence.


Figures

Figure 1.
Figure 1.
A record of reinforcement rates across baseline (i.e., VI 30 s) and extinction conditions (top panel), examples of weighting functions generated by the Temporal Weighting Rule for Sessions 5, 7, and 10 (middle panel), and the value of the response obtained by applying weighting functions, like those in the middle panel, to the reinforcement rates across sessions in the top panel.
Figure 2.
Figure 2.
Changes in value (middle panel) and response probability (bottom panel) as a function of changes in reinforcement rate (top panel) of target and alternative responding across three phases of a resurgence sequence. Increases in the probability of target responding when transitioning from Phase 2 to Phase 3 drive the resurgence effect.
Figure 3.
Figure 3.
Target response rate across three phases of a resurgence sequence in which reinforcers are provided for target responding in Phase 1, an alternative response in Phase 2, and neither response in Phase 3. Increases in target responding when transitioning from Phase 2 to Phase 3 constitute resurgence.
Figure 4.
Figure 4.
Alternative response rate across three phases of a resurgence sequence in which reinforcers are provided for target responding in Phase 1, an alternative response in Phase 2, and neither response in Phase 3.
Figure 5.
Figure 5.
Target and alternative response rates across three phases. Shaded areas correspond to values of the target and the alternative responses. Panels in the left column simulate different reinforcement schedules in Phase 2 for the alternative response when extinction is not programmed for target responding, whereas panels in the right column simulate these same conditions in Phase 2 when extinction is programmed for target responding (i.e., a typical resurgence sequence).
Figure 6.
Figure 6.
Target (left panel) and alternative (right panel) response rates when Phase 3 constitutes a downshift in the rate of alternative reinforcement programmed in Phase 2. Lighter data points simulate greater downshifts in rate of alternative reinforcement.
Figure 7.
Figure 7.
Target (left panel) and alternative (right panel) response rates when responding is biased toward the target (white data points), the alternative (black data points), or neither response (grey data points).
Figure 8.
Figure 8.
Target (left panel) and alternative (right panel) response rates when there is no shift (black data points), an intermediate shift (grey data points), or a large shift (white data points) in bias toward the target behavior in Phase 3 (e.g., an increase in effort of the alternative behavior).
Figure 9.
Figure 9.
Target (left panel) and alternative (right panel) response rates under various conditions of motivation (i.e., the a parameter). Lighter data points simulate greater motivation.

References

    1. Baer DM, Wolf MM, & Risley TR (1968). Some current dimensions of applied behavior analysis. Journal of Applied Behavior Analysis, 1, 91–97. doi: 10.1901/jaba.1968.1-91 - DOI - PMC - PubMed
    1. Baum WM (1974). On two types of deviation from the matching law: Bias and undermatching. Journal of the Experimental Analysis of Behavior, 22, 231–242. doi: 10.1901/jeab.1974.22-231 - DOI - PMC - PubMed
    1. Baum WM, & Rachlin HC (1969). Choice as time allocation. Journal of the Experimental Analysis of Behavior, 12, 861–874. doi: 10.1901/jeab.1969.12-861 - DOI - PMC - PubMed
    1. Bouton ME (2010). The multiple forms of “context” in associative learning theory In Mesquita B, Barrett LF, & Smith ER (Eds.), The mind in context (pp. 233–258). New York, NY: Guilford Press.
    1. Bouton ME (2014). Why behavior change is difficult to sustain. Preventive Medicine, 68, 29–36. doi: 10.1016/j.ypmed.2014.06.010 - DOI - PMC - PubMed

Publication types