. 2019 Nov;234(11):20829-20846.
doi: 10.1002/jcp.28688. Epub 2019 May 2.

GATA-1 isoforms differently contribute to the production and compartmentation of reactive oxygen species in the myeloid leukemia cell line K562

Affiliations

GATA-1 isoforms differently contribute to the production and compartmentation of reactive oxygen species in the myeloid leukemia cell line K562

Patrizia Riccio et al. J Cell Physiol. 2019 Nov.

Abstract

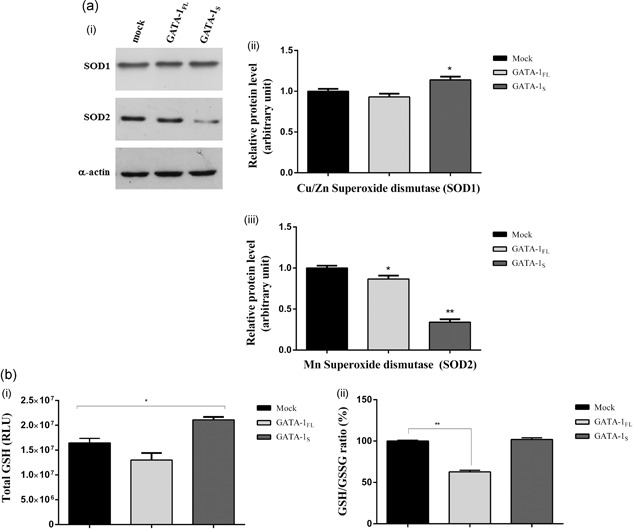
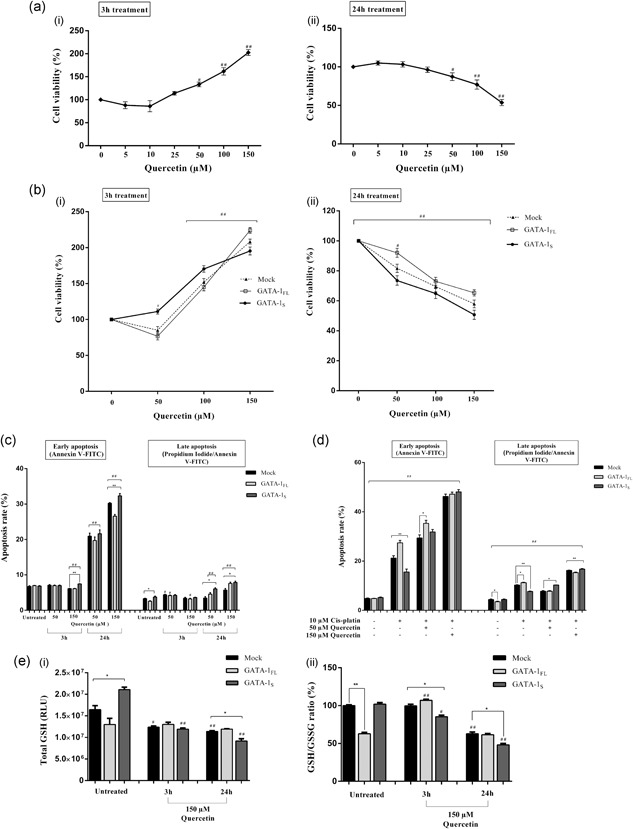
Maintenance of a balanced expression of the two isoforms of the transcription factor GATA-1, the full-length protein (GATA-1FL ) and a shorter isoform (GATA-1 S ), contributes to control hematopoiesis, whereas their dysregulation can alter the differentiation/proliferation potential of hematopoietic precursors thereby eventually leading to a variety of hematopoietic disorders. Although it is well established that these isoforms play opposite roles in these remarkable processes, most of the molecular pathways involved remain unknown. Here, we demonstrate that GATA-1FL and GATA-1S are able to differently influence intracellular redox states and reactive oxygen species (ROS) compartmentation in the erythroleukemic K562 cell line, thus shedding novel mechanistic insights into the processes of cell proliferation and apoptosis resistance in myeloid precursors. Furthermore, given the role played by ROS signaling as a strategy to escape apoptosis and evade cell-mediated immunity in myeloid cells, this study highlights a mechanism through which aberrant expression of GATA-1 isoforms could play a role in the leukemogenic process.

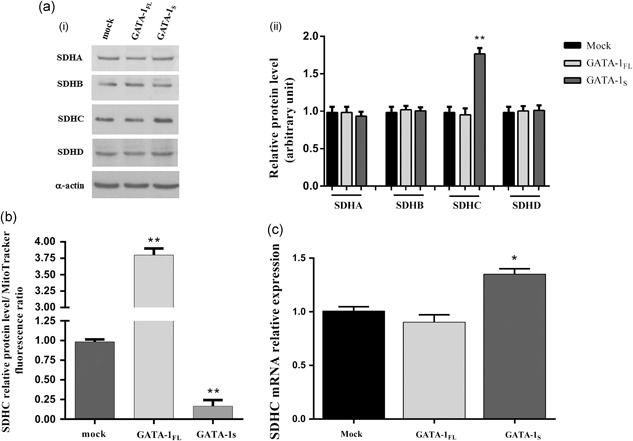
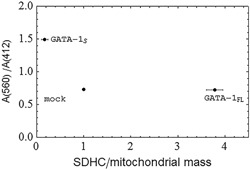
Keywords: GATA-1; mitochondria remodeling; myeloid leukemia; oxidative stress; succinate dehydrogenase subunit C (SDHC).


Figures

Figure 1
Figure 1
Absorbance spectra of transfected cells with expression vectors for GATA‐1FL or GATA‐1S. (a) Spectra of the light absorbance from K562 living cells which were normalized to the culture medium. Spectrum wavelengths (nm) are represented on the abscissa and the relative intensity is plotted on the ordinate scale. The figure shows representative results of one of at least three independent experiments. (b) Western blot analysis of the expression levels of GATA‐1 isoforms in total protein lysates from K562 cells transiently transfected with either FLAG‐tagged GATA‐1FL (48 kD), GATA‐1S (38 kD) isoforms or empty vector (mock) [Color figure can be viewed at wileyonlinelibrary.com]
Figure 2
Figure 2
Evaluation of ROS production in K562 cells overexpressing GATA‐1FL and GATA‐1S isoforms. (a) Cytoplasmatic ROS levels detected by flow cytometry analysis in cells overexpressing GATA‐1 isoforms and in mock control after CellRox staining. (b) Mitochondrial superoxide levels detected by flow cytometry analysis in cells overexpressing GATA‐1 isoforms and in mock control stained with MitoSOX red mitochondrial superoxide reagent. (c) Total mitochondrial mass detected by flow cytometry analysis in cells overexpressing GATA‐1 isoforms and in mock cells stained with MitoTracker green FM reagent. (d) Mitochondrial superoxide/mitochondrial mass ratio in cells overexpressing GATA‐1 isoforms and in mock control. All data are presented as the means ± SD (n = 3 in each group). Statistical analysis was performed by one‐way ANOVA, followed by Dunnett's multiple comparison test where appropriate. Differences were considered significant when p < 0.05 and highly significant when p < 0.0001. *p < 0.05; **p < 0.0001, versus mock control. (e) Fluorescent microscopy images of cells overexpressing GATA‐1 isoforms and mock cells. (i) bright field images; (ii) fluorescence images of K562 stained with MitoSox red mitochondrial dye; (iii) fluorescence images of K562 stained with MitoTracker green FM dye; (iv) merged images; (v) nuclei stained with 4′,6′‐diamidino‐2‐phenylindole (DAPI). All data shown are representative of three independent experiments. ANOVA: analysis of variance; ROS: reactive oxygen species; SD: standard deviation [Color figure can be viewed at wileyonlinelibrary.com]
Figure 3
Figure 3
Changes in mitochondrial DNA contents and in the levels of mitochondrial dynamics‐related proteins. (a) Real‐time PCR quantitative analysis of mitochondrial DNA (mtDNA) content relatively to the nuclear DNA (chrDNA) in K562 cells overexpressing GATA‐1 isoforms. Data are presented as fold‐changes relative to the mock control. (b) (i) Western blot analysis of VDAC1 expression levels in total protein lysates from mock control and from cells overexpressing GATA‐1FL and GATA‐1S, respectively. The figure shows representative results of three independent experiments; (ii) densitometric analysis of western blot results. (c) (i) Western blot analysis of dynamin‐related protein 1 (Drp1) and mitofusin 2 (Mfn2) expression levels in total protein lysates from mock control and from cells overexpressing GATA‐1 isoforms. Representative results of three independent experiments are shown; (ii) densitometric analysis of western blot results. For all western blotting data, band intensities from three independent experiments were quantified and normalized to α‐actin used as a loading control. All data were analyzed by one‐way ANOVA, followed by Dunnett's multiple comparison test, where appropriate. Differences were considered significant when p < 0.05 and highly significant when p < 0.0001. *p < 0.05; **p < 0.0001, versus mock control. ANOVA: analysis of variance
Figure 4
Figure 4
Flow cytometric analysis of cell viability and apoptosis rate in K562 cells overexpressing GATA‐1 isoforms. (a) Cell viability assessed by the MTT assay in mock control and in GATA‐1 overexpressing K562 cells at 24, 48, and 72 hr after transfection. (b) Early apoptosis rate detected with Annexin V staining in mock control and in K562 cells overexpressing GATA‐1 isoforms 48 hr after transfection. (c) Late apoptosis rate detected with Annexin V/propidium iodide staining in mock control and in K562 cells overexpressing GATA‐1 isoforms 48 hr after transfection. Apoptosis was evaluated in untreated cells and in cells treated for 16 hr with 10 and 20 μM cisplatin, respectively. (d) Cytoplasmatic ROS levels detected by flow cytometry analysis in K562 cells stained with CellRox dye after 10 and 20 μM cisplatin exposure. Menadione treatment (10 μM) was used as a positive control for cytoplasmatic ROS production. All data shown represent the mean ± SD of three independent experiments. Statistical analysis was performed by one‐way ANOVA, followed by Dunnett's multiple comparison test where appropriate. Differences were considered significant when p < 0.05 and highly significant when p < 0.0001. # p < 0.05, ## p < 0.0001 versus untreated control group, *p < 0.05, **p < 0.0001 versus mock control. ANOVA: analysis of variance; ROS: reactive oxygen species; SD: standard deviation
Figure 5
Figure 5
Evaluation of the antioxidant capacity in cells expressing GATA‐1 isoforms. (a) (i) Western blot analysis of the expression levels of Cu/ZnSOD (SOD1) and MnSOD (SOD2) in total protein lysates from mock control and from cells overexpressing GATA‐1FL and GATA‐1S. Each blotting is representative of three independent experiments; (ii,iii) Densitometric analysis of western blot results. Band intensities were quantified and normalized to α‐actin used as loading control. Data are presented as fold‐changes relative to the mock control. Statistical analysis was performed by one‐way ANOVA, followed by Dunnett's multiple comparison test, where appropriate. Differences were considered significant when p < 0.05 and highly significant when p < 0.0001. *p < 0.05; **p < 0.0001, versus mock control. (b) (i) Total glutathione levels (GSH+GSSG) determined in K562 cells 48 hr after transfection with expression vectors for GATA‐1 isoforms or with empty vector (mock). Results represent the net luminescence (as relative luminescence units, RLU) after background subtraction. The mean ± SD of three independent experiments were plotted on the graph; (ii) relative GSH/GSSG ratio for mock control or GATA‐1FL and GATA‐1S cells were obtained using the following formula: (Net transfected cells total glutathione RLU − Net transfected cells GSSG RLU)/(Net transfected cells GSSG RLU/2). Mean ± SD of three independent experiments were plotted on the graph as a relative percentage versus mock control cells. Statistical analysis was performed by one‐way ANOVA, followed by Dunnett's multiple comparison test, where appropriate. Differences were considered significant when p < 0.05 and highly significant when p < 0.0001. *p < 0.05, **p < 0.0001 versus mock control. ANOVA: analysis of variance; GSH: glutathione; GSSG: oxidized glutathione; RLU: relative luminescence units; SD: standard deviation
Figure 6
Figure 6
Evaluation of differential response to quercetin treatment in cells expressing GATA‐1 isoforms. (a) Time‐course and dose‐response to 5, 10, 25, 50, 100, 150 μM of quercetin exposure in K562 cells. Cell viability was assessed by the MTT assay after 3 hr (i) and 24 hr exposure (ii). (b) Cell viability after exposure to 50, 100, and 150 μM quercetin for 3 hr (i) and 24 hr (ii) in mock control and in cells overexpressing GATA‐1 isoforms 48 hr after transfection. (c) Early and late apoptosis rate in mock control and in cells overexpressing GATA‐1 isoforms. Forty‐eight hours after transfection, cells were treated for 3 hr and 24 hr with 50 and 150 μM quercetin or with vehicle control (DMSO + PBS); (d) Early and late apoptosis rate in mock control and in cells overexpressing GATA‐1 isoforms after co‐treatment with quercetin and cisplatin. The untreated control group was incubated with vehicle control (DMSO+PBS) under the same conditions. All data represent the mean ± SD of three independent experiments. (e) (i) Total glutathione levels (GSH+GSSG) detected after exposure to 150 μM quercetin or to vehicle control (DMSO+PBS) for 3 hr and 24 hr in K562 cells 48 hr after transfection. Results represent the net luminescence (in RLU) after background subtraction and the mean ± SD of three independent experiments were plotted on the graph; (ii) relative GSH/GSSG ratio for mock control or GATA‐1FL and GATA‐1S cells treated for 3 hr and 24 hr with 150 μM quercetin or vehicle control (DMSO+PBS). Results were obtained using the following formula: (Net transfected cells total glutathione RLU − Net transfected cells GSSG RLU)/(Net transfected cells GSSG RLU/2). Mean ± SD of three independent experiments were plotted on the graph as relative percentage versus mock of the untreated control group. All data were analyzed for statistical significance by one‐way ANOVA, followed by Dunnett's multiple comparison test where appropriate. Differences were considered significant when p < 0.05 and highly significant when p < 0.0001. # p < 0.05, ## p < 0.0001 versus untreated control group, *p < 0.05, ** p < 0.0001 versus mock control. ANOVA: analysis of variance; DMSO: dimethyl sulfoxide; GSH: glutathione; GSSG: oxidized glutathione; PBS: phosphate‐buffered saline; RLU: relative luminescence units; SD: standard deviation
Figure 7
Figure 7
Evaluation of the expression levels of SDH subunits in K562 cells overexpressing GATA‐1 isoforms. (a) Protein levels of SDH complex detected by western blotting in total protein lysates from mock control and from cells overexpressing GATA‐1FL and GATA‐1S, respectively, showing increased levels of SDHC in GATA‐1S cells. (i) Representative western blotting of three independent experiments is shown for each SDH subunit and for α‐actin used as loading control; (ii) densitometric analysis of western blot results. Band intensities from three independent experiments were quantified and normalized to α‐actin. (b) SDHC/mitochondrial mass ratio in mock control and in cells overexpressing GATA‐1 isoforms. (c) Real‐time RT‐PCR quantitative analysis of SDHC mRNA levels in mock control and in cells overexpressing GATA‐1 isoforms. SDHC expression levels were normalized against GAPDH. All data represent the mean ± SD of three independent experiments. Statistical analysis was performed by one‐way ANOVA, followed by Dunnett's multiple comparisons test, where appropriate. Differences were considered significant when p < 0.05 and highly significant when p < 0.0001. # p < 0.05, ## p < 0.0001 versus untreated control group, *p  < 0.05, **p < 0.0001 versus mock control. ANOVA: analysis of variance; SD: standard deviation; SDHC: succinate dehydrogenase complex
Figure 8
Figure 8
Evaluation of the redox state of cytochrome b‐560 with respect to SDHC levels in K562 cells overexpressing GATA‐1 isoforms. The ratio of the integrated area A (560) under the absorbance dip at 560 nm to the integrated area A (412) under the absorbance peak at 412 nm versus the SDHC levels normalized to the mitochondrial mass. The integrated spectral data are obtained from the absorbance spectra of cells transfected with expression vectors for GATA‐1FL or GATA‐1S, respectively, and with mock control. The positional error bars are the standard deviation of the means (n = 3) of the measurements of the SDHC/mitochondrial mass ratio in cells overexpressing GATA‐1 isoforms. SDHC: succinate dehydrogenase complex
Figure 9
Figure 9
Evaluation of the expression levels of SDHC and GATA‐1 isoforms in a patient with AML. Protein levels of GATA‐1 and SDHC detected by western blotting in total protein lysates from bone marrow biopsies of a patient with AML at different stages of the disease and three healthy negative controls, showing prevalent expression of GATA‐1S isoform and elevated SDHC levels during the acute phase of the disease and their normalization at remission. Representative western blots are shown for GATA‐1, SDHC and α‐actin used as a loading control. AML: acute myeloid leukemia; SDHC: succinate dehydrogenase complex

Similar articles

Cited by

References

    1. Bardella, C. , Pollard, P. J. , & Tomlinson, I. (2011). SDH mutations in cancer. Biochimica et Biophysica Acta, 1807, 1432–1443. 10.1016/j.bbabio.2011.07.003 - DOI - PubMed
    1. Bellisola, G. , & Sorio, C. (2012). Infrared spectroscopy, and microscopy in cancer research and diagnosis. American Journal of Cancer Research, 2, 1–21. www.ajcr.us - PMC - PubMed
    1. Brand, M. D. (2016). Mitochondrial generation of superoxide and hydrogen peroxide as the source of mitochondrial redox signaling. Free Radicals Biology & Medicine, 100, 14–31. 10.1016/j.freeradbiomed.2016.04.001 - DOI - PubMed
    1. Bresnick, E. H. , Katsumura, H. R. , Lee, H. Y. , Johnson, K. D. , & Perkins, A. S. (2012). Master regulatory GATA transcriptional factors: Mechanistic principles and emerging links to hematological malignancies. Nucleic Acids Research, 40, 5819–5831. 10.1093/nar/gks281 - DOI - PMC - PubMed
    1. Burda, P. , Laslo, P. , & Stopka, T. (2010). The role of PU.1 and GATA‐1 transcription factors during normal and leukemogenic hematopoiesis. Leukemia, 24, 1249–1257. 10.1/leu.2010.104 - DOI - PubMed

Publication types

MeSH terms

LinkOut - more resources