. 2019 May 3;15(5):e1006986.
doi: 10.1371/journal.pcbi.1006986. eCollection 2019 May.

Enchained growth and cluster dislocation: A possible mechanism for microbiota homeostasis

Affiliations

Enchained growth and cluster dislocation: A possible mechanism for microbiota homeostasis

Florence Bansept et al. PLoS Comput Biol. .

Abstract

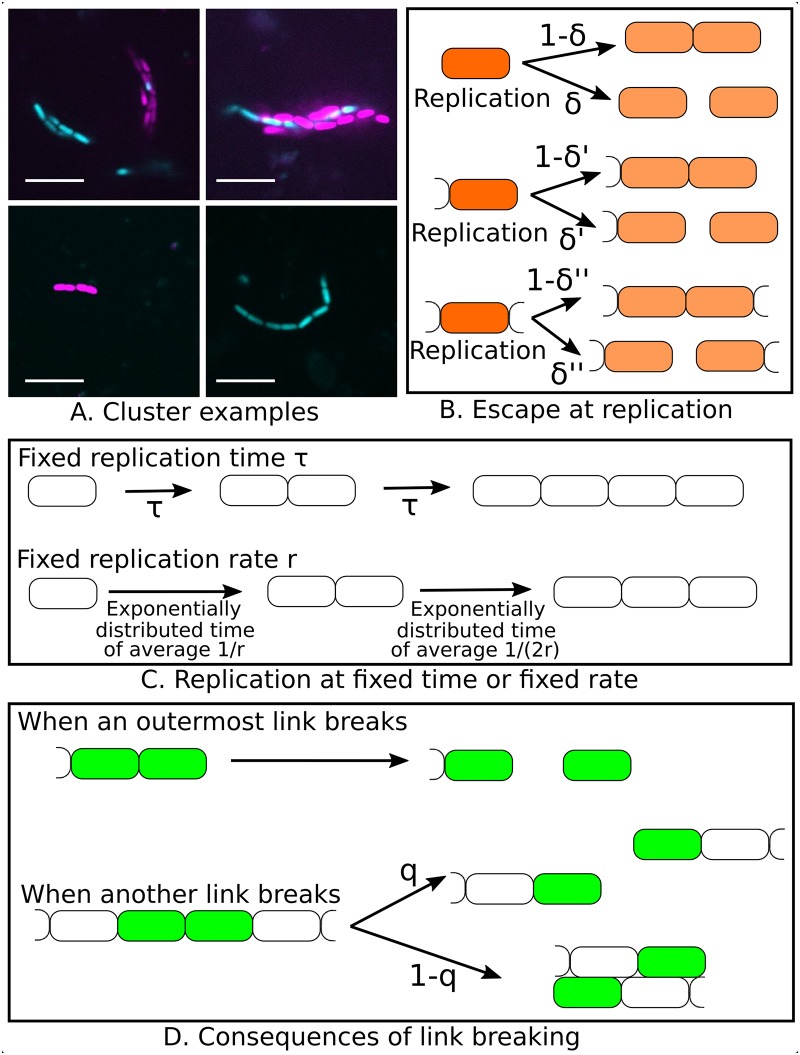
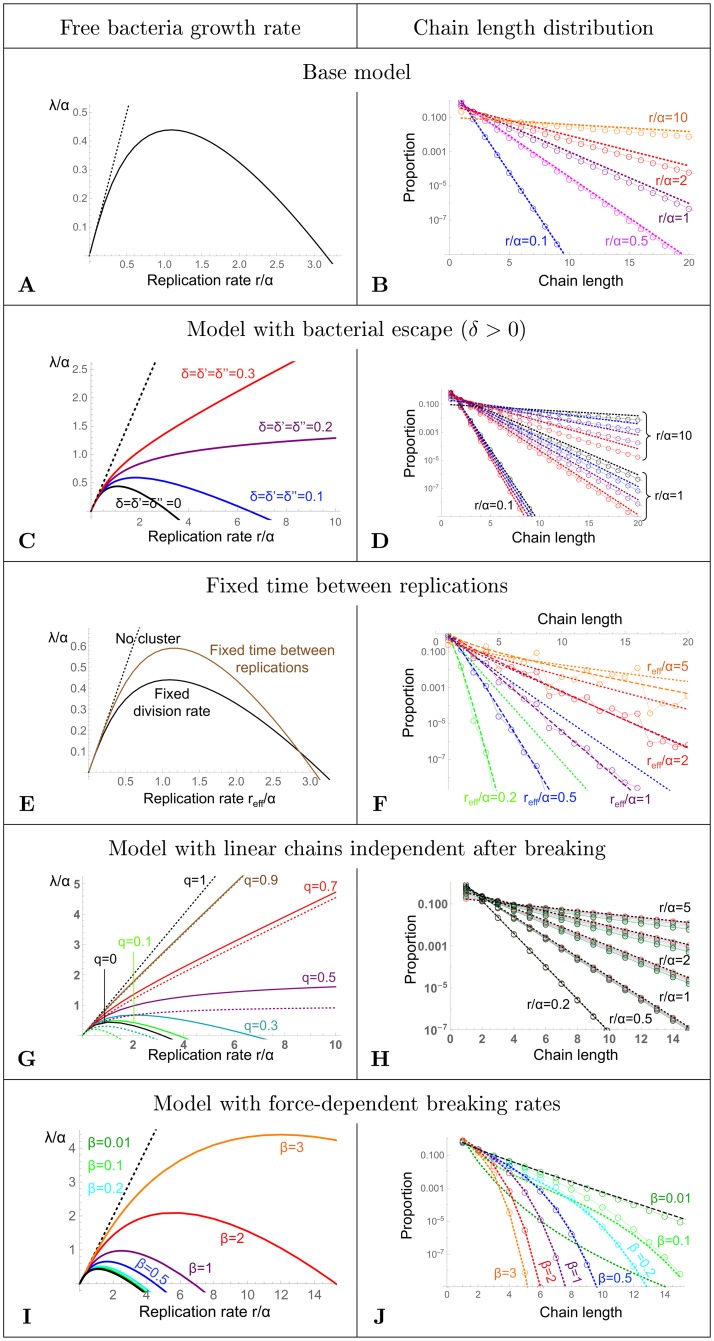
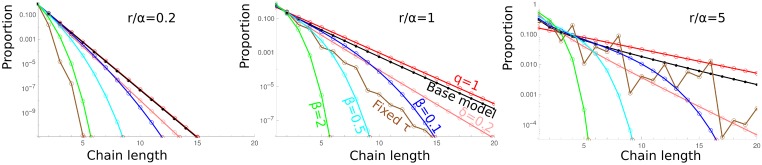
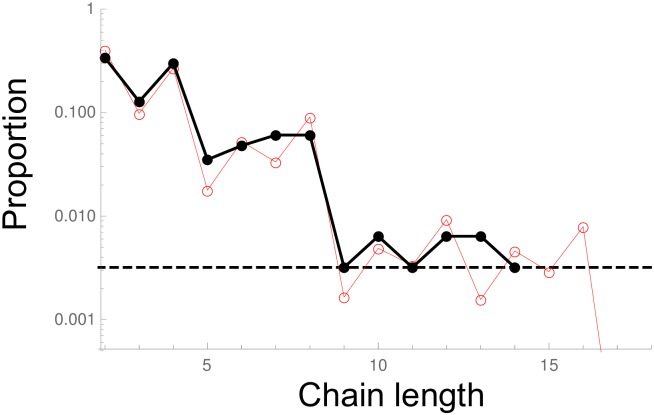
Immunoglobulin A is a class of antibodies produced by the adaptive immune system and secreted into the gut lumen to fight pathogenic bacteria. We recently demonstrated that the main physical effect of these antibodies is to enchain daughter bacteria, i.e. to cross-link bacteria into clusters as they divide, preventing them from interacting with epithelial cells, thus protecting the host. These links between bacteria may break over time. We study several models using analytical and numerical calculations. We obtain the resulting distribution of chain sizes, that we compare with experimental data. We study the rate of increase in the number of free bacteria as a function of the replication rate of bacteria. Our models show robustly that at higher replication rates, bacteria replicate before the link between daughter bacteria breaks, leading to growing cluster sizes. On the contrary at low growth rates two daughter bacteria have a high probability to break apart. Thus the gut could produce IgA against all the bacteria it has encountered, but the most affected bacteria would be the fast replicating ones, that are more likely to destabilize the microbiota. Linking the effect of the immune effectors (here the clustering) with a property directly relevant to the potential bacterial pathogeneicity (here the replication rate) could avoid to make complex decisions about which bacteria to produce effectors against.


Conflict of interest statement

The authors have declared that no competing interests exist.

Figures

Fig 1
Fig 1. Bacterial cluster modeling.
A. Representative experimental images of bacterial clusters in cecal content of vaccinated mouse at 5h post infection with isogenic GFP and mCherry expressing S. typhimurium (Experiments performed for [12]). The scale bar is 10μm. Top images: complex clusters made from bundles of linear clusters, which could be re-linked single chains (left) or formed from at least two independent clones (indicated by fluorescence, right). Bottom images: linear clusters which dynamics we aim to model. B. Potential bacterial escape at replication (in the base model, δ = δ′ = δ″ = 0). C. Fixed replication time or fixed replication rate (the latter is chosen for the base model). D. Consequences of link breaking. In the base model, q = 0.
Fig 2
Fig 2
Left panels A, C, E, G, I: Growth rate λ of the free bacteria as a function of the bacteria replication rate r, both in units of α. Numerical results (solid colored lines), and limit with no clusters (λ = r) (black dotted line). The base model is represented in black in all the left panels to ease comparison between models. Right panels B, D, F, H, J: Chain length distribution. Open circles linked by solid lines: numerical results. A, B: Base model, nmax = 40. B. dotted lines: approximation (5) (almost overlaid with the numerical results for r/α = 0.1). C, D: Model with bacterial escape. δ = δ′ = δ″ = 0 (green), 0.1 (blue), 0.2 (purple), 0.3 (red). c = c′ = 0, nmax = 40. D. dotted lines: approximation (9). E, F: Fixed time between replications. reff = log(2)/τ. nmax = 32. F. approximation (18) (dashed lines), numerical result in the base model (dotted lines). reff/α = 0.2 (green), 0.5 (blue), 1 (purple), 2 (red), 5 (orange). G, H: Model with linear chains independent after breaking. G. The dotted black line is the case q = 1, for which λ = r, like in the absence of clusters. The colored dotted lines are the analytical approximation (28). nmax = 200. H. The dotted black lines are the approximate distribution (26) for each r/α, which is the exact distribution for q = 1. The colours represent the same q values than for the left panel. All curves are almost overlaid for small r. nmax = 80. I,J: Model with force-dependent breaking rates. Each color represents a different β. Darker green: β = 0.01 (nmax = 20); green: β = 0.1 (nmax = 15); cyan: β = 0.2 (nmax = 15); blue: β = 0.5 (nmax = 15); purple: β = 1 (nmax = 15); red: β = 2 (nmax = 10); orange: β = 3 (nmax = 10). I. The black line is the numerical result for the base model, equivalent to β = 0. The curve for β = 0.01 (dark green) is almost overlaid with the curve for β = 0. J. Chain length distribution for r/α = 1. The colored dotted lines the analytical approximation (32), and the black dashed line the numerical result for the base model.
Fig 3
Fig 3. Comparison of the chain length distributions for the different models.
The base model is represented in black. For the case with bacterial escape when a bacterium replicates, one numerical value is represented (δ = δ′ = δ″) (pink), the lower this value, the closer to the base model. The model with fixed replication time is represented in brown (for this model we choose τ = log(2)/r). The model with linear chains independent after breaking (q > 0) is shown in red for q = 1, the most different from the base model. All intermediate q values are between the black and the red curves. The model with the force dependent breaking rate is represented for 3 values of β: 0.1 (blue), 0.5 (cyan), 2 (green). All the results are numerical, using nmax values as in Fig 2, except for q = 1 which is an exact analytical result.
Fig 4
Fig 4. Comparison with experiments.
Chain length distribution (proportions relative to the linear chains of length ≥ 2 are represented in log scale). The black dots and line are the experimental data. The horizontal dotted black line represents the case in which there is one chain of the given size. No chains longer than size 14 were detected in our experimental images. The red line and points are the numerical results for the model with fixed replication time. In this model, there is only one free parameter, reff/α = log(2)/(ατ), which fitted value is 4.1 (see appendix G in S1 Text for more details).

References

    1. Helander HF, Fändriks L. Surface area of the digestive tract—revisited. Scandinavian journal of gastroenterology. 2014;49(6):681–689. 10.3109/00365521.2014.898326 - DOI - PubMed
    1. Casteleyn C, Rekecki A, Van der Aa A, Simoens P, Van den Broeck W. Surface area assessment of the murine intestinal tract as a prerequisite for oral dose translation from mouse to man. Laboratory animals. 2010;44(3):176–183. 10.1258/la.2009.009112 - DOI - PubMed
    1. Sender R, Fuchs S, Milo R. Revised estimates for the number of human and bacteria cells in the body. PLoS biology. 2016;14(8):e1002533 10.1371/journal.pbio.1002533 - DOI - PMC - PubMed
    1. Stecher B, Hardt WD. The role of microbiota in infectious disease. Trends in microbiology. 2008;16(3):107–114. 10.1016/j.tim.2007.12.008 - DOI - PubMed
    1. Dishaw LJ, Cannon JP, Litman GW, Parker W. Immune-directed support of rich microbial communities in the gut has ancient roots. Developmental & Comparative Immunology. 2014;47(1):36–51. 10.1016/j.dci.2014.06.011 - DOI - PMC - PubMed

Publication types