. 2019 Dec 17;29(12):5166-5179.
doi: 10.1093/cercor/bhz055.

The Glutamine Transporter Slc38a1 Regulates GABAergic Neurotransmission and Synaptic Plasticity

Affiliations

The Glutamine Transporter Slc38a1 Regulates GABAergic Neurotransmission and Synaptic Plasticity

Tayyaba Qureshi et al. Cereb Cortex. .

Abstract

GABA signaling sustains fundamental brain functions, from nervous system development to the synchronization of population activity and synaptic plasticity. Despite these pivotal features, molecular determinants underscoring the rapid and cell-autonomous replenishment of the vesicular neurotransmitter GABA and its impact on synaptic plasticity remain elusive. Here, we show that genetic disruption of the glutamine transporter Slc38a1 in mice hampers GABA synthesis, modifies synaptic vesicle morphology in GABAergic presynapses and impairs critical period plasticity. We demonstrate that Slc38a1-mediated glutamine transport regulates vesicular GABA content, induces high-frequency membrane oscillations and shapes cortical processing and plasticity. Taken together, this work shows that Slc38a1 is not merely a transporter accumulating glutamine for metabolic purposes, but a key component regulating several neuronal functions.

Keywords: GABA; SAT1; SNAT1; Slc38; neurotransmitter replenishment.


Figures

Figure 1.
Figure 1.
Genetic inactivation of Slc38a1 using the binary Cre/LoxP system and its validation. (A) Schematic drawing of the targeting vector, wild-type allele (Slc38a1wt (Slc38a1+)), and targeted alleles (Slc38a1flox-Neo, Slc38a1flox, and Slc38a1null (Slc38a1-)). The Slc38a1 targeting vector contained a LoxP site (inserted into intron 4; white triangles), and a selection cassette (Neomycin) flanked by FRT-sites (black triangles) and a LoxP site (inserted into intron 8). After homologous recombination in ES cells (Slc38a1flox-Neo locus), ES cells were transected with Flp to excise the selection cassette (Slc38a1flox locus) prior to blastocyst injection. Upon expression of Cre recombinase, exons 5–8 were excised (Slc38a1 null), generating out of reading frame splicing transcript. The binding site for the 5-end Southern screening probe and the expected fragment sizes after KpnI digest are indicated. (B) Genotyping of ear biopsies of Slc38a1+/+, Slc38a1+/- (heterozygous) and Slc38a1/− mice by 3 pairs of probes gives the expected amplified fragments (see Supplementary Experimental Procedures). (C) Southern blot analysis of DNA isolated from liver of Slc38a1+/+, Slc38a1+/−, and Slc38a1/− mice. DNA was digested with KpnI followed by hybridization with the 5-probe to give the expected fragments for Slc38a1WT (20.2 kb) and Slc38a1Null (15.7 kb). (D) Expression of Slc38a1 protein in brain lysates of Slc38a1+/+, Slc38a1+/−, and Slc38a1/− mice was investigated. No protein expression is detected in lysates from Slc38a1/− mice, while Slc38a1+/- mice show reduced staining for Slc38a1 protein compared to Slc38a1+/+ mice. β-actin was used as loading control. E) Expression of Slc38a1 protein was investigated by immunostaining of free-floating brain sections for Slc38a1. In the hippocampus, Slc38a1 immunoreactivity accumulates in scattered interneuron-like cells in the CA1 and dentate area of Slc38a1+/+ mice. Such staining is abolished in sections from Slc38a1/− mice. G, granulare; LM, lacunosum-moleculare; M, moleculare; P, pyramidale; R, Radiatum. Insets: P, pyramidal cells; I, interneuron-like cell. Scale: 100 μm.
Figure 2.
Figure 2.
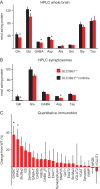
Slc38a1 inactivation reduces selectively levels of amino acids (AA) and increases levels of proteins sustaining GABA transmission. (A) The concentration of AAs in forebrains of Slc38a1/− (red) and Slc38a1+/+ (black) mice (n = 5 in each group) were investigated by HPLC. Significant reduction in the levels of glutamine (Gln), glutamate (Glu), GABA and aspartate (Asp) was detected upon Slc38a1 inactivation. The levels of some other AAs, such as alanine (Ala), serine (Ser), glycine (Gly) or taurine (Tau), were not altered. (B) Synaptosomes were made from brains of Slc38a1/− (red) and Slc38a1+/+ (black) mice and their content of AAs was measured by HPLC: Glutamine and aspartate are significantly reduced. Glutamate and GABA are sub-significantly reduced, while there is no difference in the concentrations of taurine in Slc38a1/− compared to Slc38a1+/+. (C) Quantitative immunoblotting of total brain extracts from Slc38a1/− and Slc38a1+/+ mice shows significant up-regulation of GAD67 and PAG in Slc38a1/− mice compared to Slc38a1+/+ mice. Proteins associated with glutamatergic neurotransmission, such as NR2B and VGLUT1, are not increased. GAD67, Glutamic acid decarboxylate (GAD) 67 kDa; PAG, (kidney) Phosphate-activated glutaminase; Slc38a2, Slc38 family member 2: The System A transporter 2 (SAT2/SNAT2); GS, Glutamine synthetase; GABA-T, GABA aminotransferase; GAD65, GAD 65 kDa; Rab3a, The RAS-related protein 3 A; GABAAR, GABAA receptor; EAAT3, Excitatory amino acid transporter (EAAT) 3 (Slc1a1); EAAT1 (Slc1a3); SNAP25, Synaptosomal-associated protein 25; GAT1, GABA transporter 1 (Slc6a1); EAAT2 (Slc1a2); Slc38a3, Slc38 family member 3: The System N transporter 1 (SN1/SNAT3); VGLUT2, Vesicular glutamate transporter (VGLUT) 2 (Slc17a6); VGAT, Vesicular GABA transporter (Slc32); VAMP, Vesicle- associated membrane protein; NR2B, NR2B subunit of NMDA receptor; VGLUT1 (Slc17a7). Red and black bars in A and B: Slx38a1/− and Slx38a1+/+, respectively. Data are mean ± SD values. Asterisk: different from control; P < 0.007 (A,C: unpaired Student’s t-test, B: Mann–Whitney test).
Figure 3.
Figure 3.
Slc38a1 inactivation alters synaptic vesicle morphology and GABAergic vesicular load. Pieces of hippocampal CA1 from Slc38a1+/+ and Slc38a1/− mice were dissected out, embedded in resins and examined by immunogold electron microscopy. (AB) Two electron micrographs (from Slc38a1+/+ and Slc38a1/− mice, respectively) showing putative GABAergic nerve terminals making symmetric synapses onto pyramidal cell dendrites and stained for glutamine. Arrow heads demark synapses. (C) In GABAergic nerve terminals of the stratum radiatum, the immunoreactivities for glutamine and glutamate are significantly reduced while GABA levels are sustained in Slc38a1/− mice compared to Slc38a1+/+ mice. (D) Immunoreactivities for glutamine or glutamate in neighboring glutamatergic nerve terminals are not reduced upon deletion of Slc38a1. (E) The density of synaptic vesicles in putative GABAergic nerve terminals is increased in Slc38a1/− mice compared to Slc38a1+/+ mice. Such change in synaptic vesicle density is not seen in adjacent glutamatergic nerve terminals. (F) The circumference of synaptic vesicles in GABAergic and glutamatergic nerve terminals was measured. GABA+ synaptic vesicles had a small but significant reduction in the circumference in Slc38a1/− mice. The circumference of synaptic vesicles in glutamatergic nerve terminals withstood any changes upon genetic inactivation of Slc38a1. (G) The vesicular concentration of GABA and glutamate was assessed by measuring immunogold labeling of synaptic vesicles. Vesicular GABA is reduced in Slc38a1 knock-out mice compared to the wild type mice. No significant changes were detected for the vesicular glutamate concentration. (H) There is no significant change in the size of the postsynaptic density (PSD) at GABAergic synapses in Slc38a1/− mice compared to Slc38a1+/+ mice. Structures or staining related to GABAergic or glutamatergic synapses are shown in red and blue, respectively, while the black bars represent the corresponding structures or staining in wt mice. The numbers written on the bars indicate the number of structures analyzed. In E-H the percentage ratio between data obtained in Slc38a1/− and Slc38a1+/+ are shown. m, miotchondria; T, terminal. Asterisk: different from control; P < 0.007, unpaired Student’s t-test.
Figure 4.
Figure 4.
Normal hippocampal excitatory transmission and synaptic plasticity prevail in Slc38a1/− mice. Excitatory transmission and short- and long-term synaptic plasticity were investigated at hippocampal CA3-to-CA1 synapses. (A) There are no changes in stimulation strengths necessary to elicit a fiber volley of given amplitudes (0.5, 1.0 and 1.5 mV) in Slc38a1/− mice compared to wild type mice suggesting no difference in fiber density/number of afferents. (B) Field excitatory post-synaptic potential (fEPSP) amplitudes as a function of the same 3 fiber volley amplitudes are equal in the 2 genotypes suggesting normal excitatory synaptic transmission. (C) The fEPSP amplitudes necessary to elicit a just detectable population spike (1) and a population spike of 2 mV (2) are not altered suggesting no impact on pyramidal cell excitability. (D) No significant changes were detected in the paired-pulse facilitation (PPF) ratio in the 2 genotypes at an interstimulus interval of 50 ms. (E) Top row; each trace is the mean of 5 consecutive synaptic responses in stratum radiatum elicited by different stimulation strengths in slices from Slc38a1+/+ (left) and Slc38a1/− (right) mice. The prevolleys preceding the fEPSPs are indicated by circles. Bottom row; recordings from stratum pyramidale elicited by paired-pulse stimulation (50 ms interstimulus interval). Arrowheads indicate the population spike thresholds. (F) Normalized and pooled fEPSP slope measurements during the initial 30 seconds of 20 Hz stimulation in stratum radiatum in slices from Slc38a1+/+ and Slc38a1/− mice. Vertical bars indicate S.E.M. Subtractions of the values obtained in Slc38a1+/+ mice from those obtained in Slc38a1/− mice are represented by the black, open symbols. The inset graph shows a the time point of the maximum magnitude of the initial frequency facilitation (as indicated by an arrow in the figure), b time point to the transition point between the initial frequency facilitation and the delayed response enhancement (DRE), c time needed to reach the peak of the DRE. (G) Normalized, pooled and superimposed extracellular fEPSP slopes evoked at CA3–to-CA1 synapses in slices from Slc38a1+/+ and Slc38a1/− mice. Tetanized pathways are shown with circles and untetanized control pathways are shown with squares. Arrowhead indicates time point of tetanic stimulation. D, F and G suggest no major differences between the genotypes in some forms of short-term and long-term synaptic plasticity. Data are shown as mean ± standard error of mean (S.E.M). Experiments are shown with open symbols for Slc38a1+/+ mice and red, filled symbols for Slc38a1/−. None of the comparisons between the genotypes were statistically significant (P < 0.05).
Figure 5.
Figure 5.
Glutamine induces high-frequency membrane oscillations in neocortical and hippocampal fast-spiking (FS) cells. (A) FS cells in CA1 stratum radiatum express the system A transporter Slc38a1. (B) Glutamine induces membrane depolarization of FS interneurons (upper panel) and generates an inward current (bottom panel; clamped at −70 mV), which are reversed upon wash-out. Red and blue dashed lines indicate resting membrane potentials at the start and end of current clamp recordings, respectively. (C) Current – voltage relationship of SAT-mediated currents. Open squares refer to superfusion in control, while filled circles in the presence of glutamine (6 min). Note the glutamine-induced outward rectification. *p < 0.05 vs. control (Student’s t-test, n = 6). The reversal potential, conferring to the cross at the abscissa, did not change. (D) Representative current clamp record shows membrane potential oscillations induced by MeAIB and glutamine. Note that glutamine but not MeAIB alone depolarizes the recorded cell. E) Cultured FS-like cells were Slc38a1 immunoreactive at 12 days in vitro. Note Slc38a1 localization to varicose axon segments (E1). Scale bars = 30 μm (E), 4 μm (E1). (F) Glutamine-induced membrane potential depolarization is rapid in FS-like but less so in IR-like interneurons. 3-Mercaptopropionic acid (3-MPA) occludes this response. *P < 0.05 vs. baseline at 0 min (Student’s t-test). gray area denotes the 6-min period of glutamine superfusion. 3-MPA was applied for 16 h at 100 μM concentration. Data were expressed as means from n = 12–15 cells/condition. (G) Glutamine elicited a progressive increase in the frequency of membrane oscillations, which can transiently exceed 0 mV after glutamine application for 6 min with gradual repolarization upon wash-out. Vertical gray bars indicate the positions of high-resolution panels (a-d) in G1. Note the highly conserved time constant and amplitude of unitary Slc38a1-mediated conductance changes.
Figure 6.
Figure 6.
Slc38a1 inactivation alters population activity in vivo. (A) Examples of power spectra of LFP in Slc38a1/− (red) compared to Slc38a1+/+ control (black). The peak in the power spectrum of the local field potential was identified in the gamma range (30–90 Hz). (B) Gamma peak frequency was significantly lower in slc38a1/− mice (n = 10) compared to controls (n = 11) (Slc38a1/−: 37 ± 1 Hz, wt: 44 ± 1 Hz,. Linear mixed model, *pgenotype = 0.03). (C) Example waveforms of a broad-spiking putative excitatory unit (green) and narrow-spiking putative inhibitory unit (blue) (D) Spike waveform width plotted against peak-to-trough time for all units (n = 273) showing separate clustering of inhibitory units and excitatory units (filled circles: excitatory units; open circles: inhibitory units). Units were classified based on principal component analysis of waveform parameters. (E) Peristimulus histogram showing average firing rate of putative excitatory neurons in response to visual stimuli of both eyes. Stimulus onset at time 0 (gray line). (F) No difference in spontaneous firing rates of excitatory neurons between the genotypes (Slc38a1/−: 1.7 ± 0.4 spikes/s versus Slc38a1+/+: 2.1 ± 0.4 spikes/s). The spontaneous activity of inhibitory units recorded from Slc38a1/− mice is significantly higher than that of Slc38a1+/+ (Slc38a1/−: 3.1 ± 0.9 spikes/s versus Slc38a1+/+: 1.5 ± 0.4 spikes/s, generalized linear model, pgenotype:unit type = 0.04, comparisons of least square means, inhibitory units: Slc38a1/− vs. Slc38a1+/+: P = 0.009).
Figure 7.
Figure 7.
Altered ocular dominance plasticity in Slc38a1/− mice. Stimulus evoked firing rates of excitatory (A,B) and inhibitory (D,E) units in response to stimulation of contralateral (deprived) and ipsilateral (non-deprived) eyes with drifting gratings for slc38a1/− (red) and Slc38a1+/+ (black) animals exposed to 4 days monocular deprivation (MD) compared to untreated controls. For inhibitory units, Slc38a1/− had significantly higher contralateral eye evoked rates compared to Slc38a1+/+ (linear mixed model, pgenotype:unit type = 0.002; Comparison of least square means, pIN: ko vs. wt = 0.008). Contralateral bias was calculated based on responses to contralateral vs. ipsilateral eye (C/(C + I)), with higher score indicating greater relative response to contralateral eye. (C) For excitatory units, monocular deprivation led to a shift to lower contralateral bias, however, on group level, this shift was only significant for Slc38a1+/+ animals (Slc38a1/−: 0.495 ± 0.02, MD: 0.48 ± 0.02; Slc38a1+/+: 0.500 ± 0.012; MD: 0.43 ± 0.02, Linear mixed model, ptreatment = 0.04; pgenotype:treatment:unit type = 0.01; Comparison of least square means: pEX: ko vs. wt = 0.01; pEX,wt:control vs. MD = 0.004). F) For inhibitory units, monocular deprivation led to a shift towards higher contralateral bias in Slc38a1+/+ animals (0.45 ± 0.03, pIN: wt: Control vs. wt = 0.02), while no such shift took place in Slc38a1/− animals (control: Slc38a1/−: 0.50 ± 0.02; Slc38a1+/+:; MD: Slc38a1/−: 0.52 ± 0.04; Slc38a1+/+: 0.59 ± 0.07, pwt: IN: control vs. MD = 0.02).

References

    1. Bartho P, Hirase H, Monconduit L, Zugaro M, Harris KD, Buzsaki G. 2004. Characterization of neocortical principal cells and interneurons by network interactions and extracellular features. J Neurophysiol. 92(1):600–608. - PubMed
    1. Ben-Ari Y, Gaiarsa JL, Tyzio R, Khazipov R. 2007. GABA: a pioneer transmitter that excites immature neurons and generates primitive oscillations. Physiol Rev. 87(4):1215–1284. - PubMed
    1. Berghuis P, Dobszay MB, Sousa KM, Schulte G, Mager PP, Hartig W, Gorcs TJ, Zilberter Y, Ernfors P, Harkany T. 2004. Brain-derived neurotrophic factor controls functional differentiation and microcircuit formation of selectively isolated fast-spiking GABAergic interneurons. Eur J Neurosci. 20(5):1290–1306. - PubMed
    1. Biesemann C, Gronborg M, Luquet E, Wichert SP, Bernard V, Bungers SR, Cooper B, Varoqueaux F, Li L, Byrne JA, et al. . 2014. Proteomic screening of glutamatergic mouse brain synaptosomes isolated by fluorescence activated sorting. EMBO J. 33(2):157–170. - PMC - PubMed
    1. Bogen IL, Boulland JL, Mariussen E, Wright MS, Fonnum F, Kao HT, Walaas SI. 2006. Absence of synapsin I and II is accompanied by decreases in vesicular transport of specific neurotransmitters. J Neurochem. 96(5):1458–1466. - PubMed

Publication types

Substances