

Six1 regulates leukemia stem cell maintenance in acute myeloid leukemia
- PMID: 31050834
- PMCID: PMC6609858
- DOI: 10.1111/cas.14033
Six1 regulates leukemia stem cell maintenance in acute myeloid leukemia
Abstract
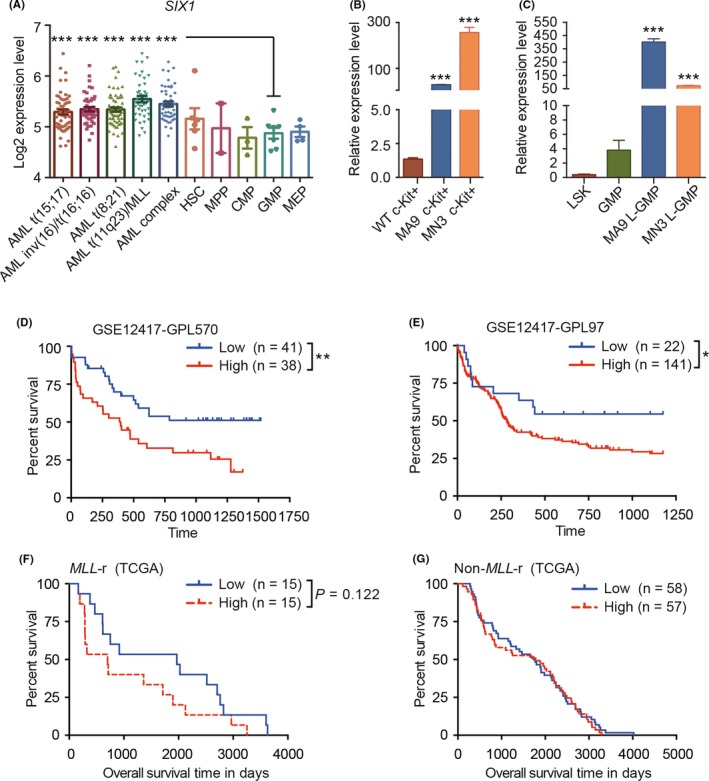
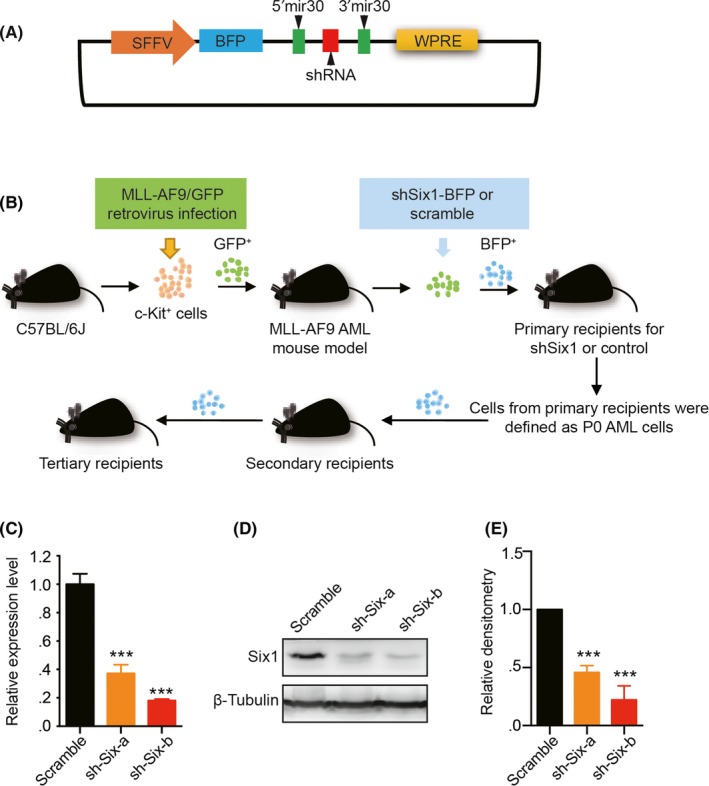
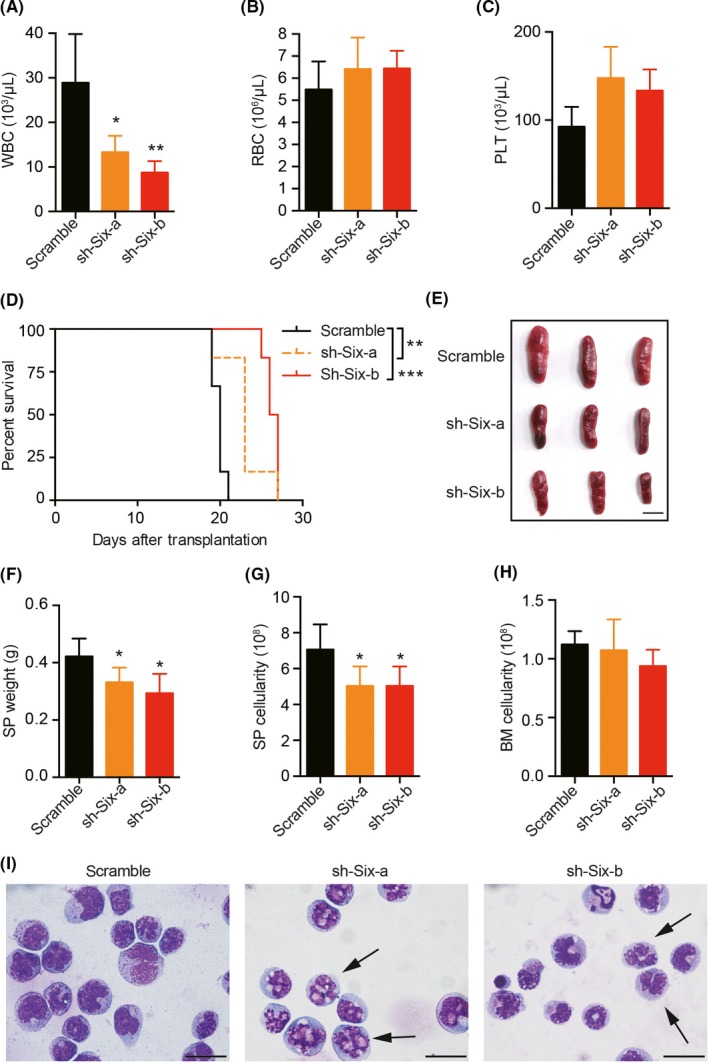
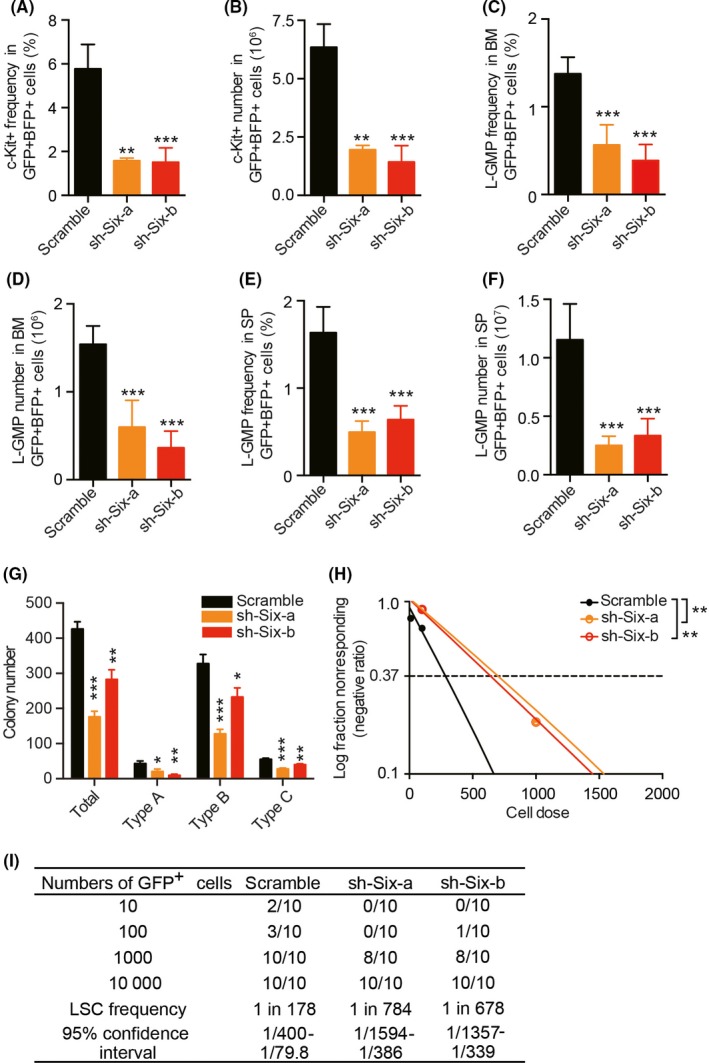
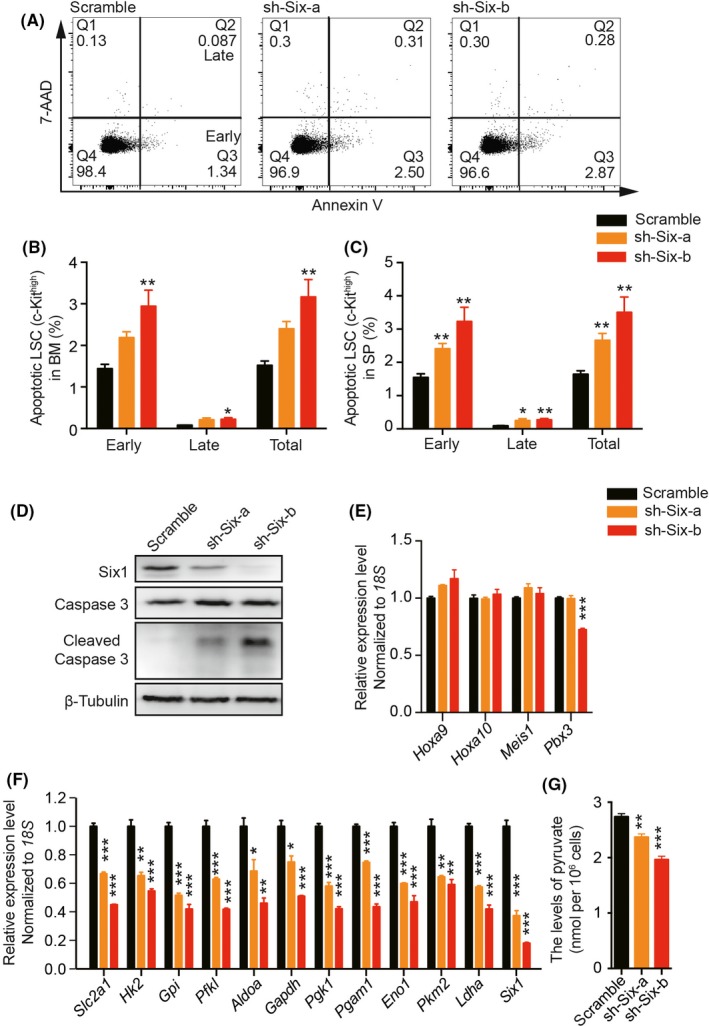
Molecular genetic changes in acute myeloid leukemia (AML) play crucial roles in leukemogenesis, including recurrent chromosome translocations, epigenetic/spliceosome mutations and transcription factor aberrations. Six1, a transcription factor of the Sine oculis homeobox (Six) family, has been shown to transform normal hematopoietic progenitors into leukemia in cooperation with Eya. However, the specific role and the underlying mechanism of Six1 in leukemia maintenance remain unexplored. Here, we showed increased expression of SIX1 in AML patients and murine leukemia stem cells (c-Kit+ cells, LSCs). Importantly, we also observed that a higher level of Six1 in human patients predicts a worse prognosis. Notably, knockdown of Six1 significantly prolonged the survival of MLL-AF9-induced AML mice with reduced peripheral infiltration and tumor burden. AML cells from Six1-knockdown (KD) mice displayed a significantly decreased number and function of LSC, as assessed by the immunophenotype, colony-forming ability and limiting dilution assay. Further analysis revealed the augmented apoptosis of LSC and decreased expression of glycolytic genes in Six1 KD mice. Overall, our data showed that Six1 is essential for the progression of MLL-AF9-induced AML via maintaining the pool of LSC.
Keywords: MLL-rearranged leukemia; Six1; acute myeloid leukemia; glycolysis; leukemia stem cell.
© 2019 The Authors. Cancer Science published by John Wiley & Sons Australia, Ltd on behalf of Japanese Cancer Association.
Figures
Similar articles
-
PBX3 is essential for leukemia stem cell maintenance in MLL-rearranged leukemia.Int J Cancer. 2017 Jul 15;141(2):324-335. doi: 10.1002/ijc.30739. Epub 2017 May 8. Int J Cancer. 2017. PMID: 28411381
-
SUV39H1 regulates the progression of MLL-AF9-induced acute myeloid leukemia.Oncogene. 2020 Dec;39(50):7239-7252. doi: 10.1038/s41388-020-01495-6. Epub 2020 Oct 9. Oncogene. 2020. PMID: 33037410 Free PMC article.
-
Installation of a cancer promoting WNT/SIX1 signaling axis by the oncofusion protein MLL-AF9.EBioMedicine. 2019 Jan;39:145-158. doi: 10.1016/j.ebiom.2018.11.039. Epub 2018 Dec 6. EBioMedicine. 2019. PMID: 30528456 Free PMC article.
-
Learning from mouse models of MLL fusion gene-driven acute leukemia.Biochim Biophys Acta Gene Regul Mech. 2020 Aug;1863(8):194550. doi: 10.1016/j.bbagrm.2020.194550. Epub 2020 Apr 19. Biochim Biophys Acta Gene Regul Mech. 2020. PMID: 32320749 Review.
-
Regulation of cancer stem cell properties by SIX1, a member of the PAX-SIX-EYA-DACH network.Adv Cancer Res. 2019;141:1-42. doi: 10.1016/bs.acr.2018.12.001. Epub 2019 Jan 16. Adv Cancer Res. 2019. PMID: 30691681 Review.
Cited by
-
The PAX-SIX-EYA-DACH network modulates GATA-FOG function in fly hematopoiesis and human erythropoiesis.Development. 2020 Jan 3;147(1):dev177022. doi: 10.1242/dev.177022. Development. 2020. PMID: 31806659 Free PMC article.
-
Transcriptional and epigenetic rewiring by the NUP98::KDM5A fusion oncoprotein directly activates CDK12.Nat Commun. 2025 May 19;16(1):4656. doi: 10.1038/s41467-025-59930-9. Nat Commun. 2025. PMID: 40389480 Free PMC article.
-
NKL Homeobox Genes NKX2-3 and NKX2-4 Deregulate Megakaryocytic-Erythroid Cell Differentiation in AML.Int J Mol Sci. 2021 Oct 22;22(21):11434. doi: 10.3390/ijms222111434. Int J Mol Sci. 2021. PMID: 34768865 Free PMC article.
-
miR-30e-5p regulates leukemia stem cell self-renewal through the Cyb561/ROS signaling pathway.Haematologica. 2024 Feb 1;109(2):411-421. doi: 10.3324/haematol.2023.282837. Haematologica. 2024. PMID: 37584287 Free PMC article.
-
KIF20A Promotes CRC Progression and the Warburg Effect through the C-Myc/HIF-1α Axis.Protein Pept Lett. 2024;31(2):107-115. doi: 10.2174/0109298665256238231120093150. Protein Pept Lett. 2024. PMID: 38037834
References
MeSH terms
Substances
Grants and funding
- 2016YFA0100600/Ministry of Science and Technology of the People's Republic of China
- 2017YFA0103402/Ministry of Science and Technology of the People's Republic of China
- 2018YFA0107801/Ministry of Science and Technology of the People's Republic of China
- 2016-I2M-1-017/Chinese Academy of Medical Sciences Innovation Fund for Medical Sciences
- 2017-I2M-3-015/Chinese Academy of Medical Sciences Innovation Fund for Medical Sciences
- 2017-I2M-3-018/Chinese Academy of Medical Sciences Innovation Fund for Medical Sciences
- 2018PT31003/Fundamental Research Funds for Central Universities
- 3332018199/Fundamental Research Funds for Central Universities
- 81629001/National Natural Science Foundation of China
- 81600136/National Natural Science Foundation of China
- 81670120/National Natural Science Foundation of China
- 81770105/National Natural Science Foundation of China
- 81421002/National Natural Science Foundation of China
- 17JCQNJC09800/Natural Science Foundation of Tianjin City
- 18ZXDBSY00070/Natural Science Foundation of Tianjin City
LinkOut - more resources
Full Text Sources
Medical
Research Materials
