. 2019 May 2;177(4):1022-1034.e6.
doi: 10.1016/j.cell.2019.04.014.

Trans Effects on Gene Expression Can Drive Omnigenic Inheritance

Affiliations

Trans Effects on Gene Expression Can Drive Omnigenic Inheritance

Xuanyao Liu et al. Cell. .

Abstract

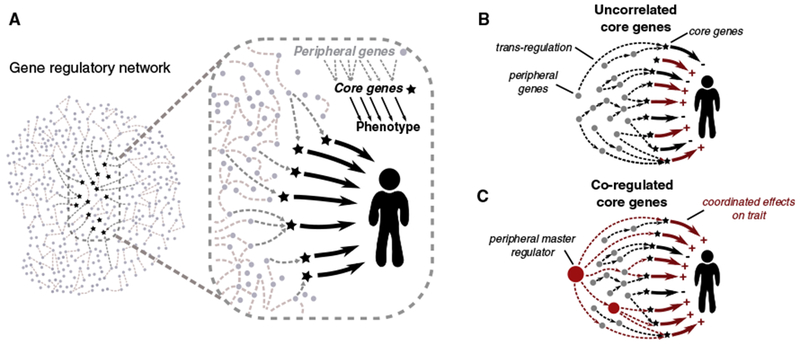
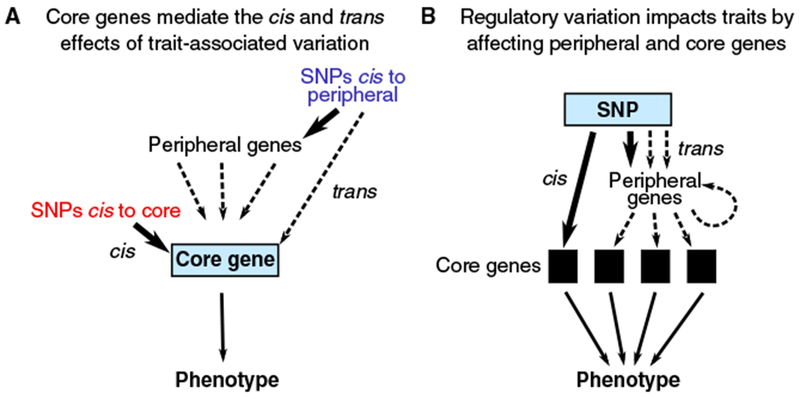
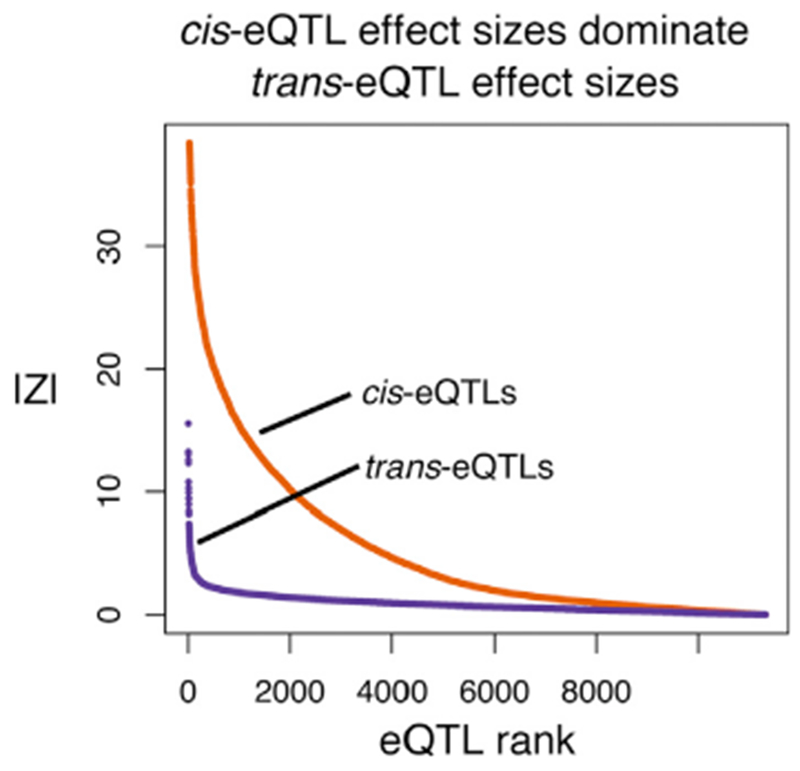
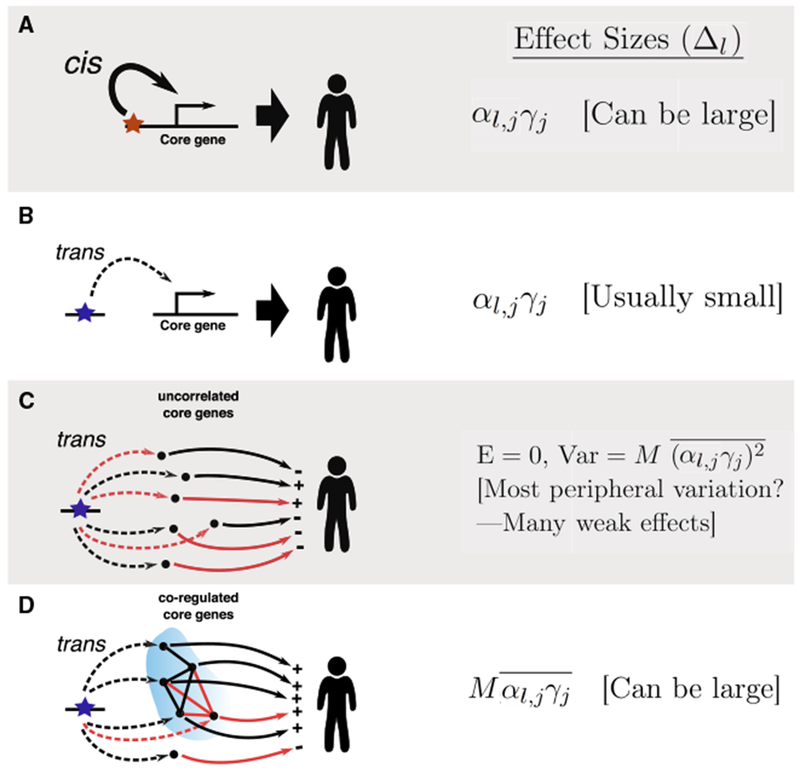
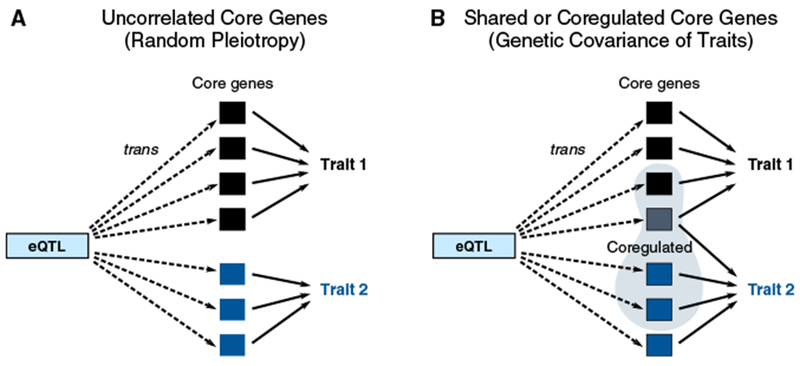
Early genome-wide association studies (GWASs) led to the surprising discovery that, for typical complex traits, most of the heritability is due to huge numbers of common variants with tiny effect sizes. Previously, we argued that new models are needed to understand these patterns. Here, we provide a formal model in which genetic contributions to complex traits are partitioned into direct effects from core genes and indirect effects from peripheral genes acting in trans. We propose that most heritability is driven by weak trans-eQTL SNPs, whose effects are mediated through peripheral genes to impact the expression of core genes. In particular, if the core genes for a trait tend to be co-regulated, then the effects of peripheral variation can be amplified such that nearly all of the genetic variance is driven by weak trans effects. Thus, our model proposes a framework for understanding key features of the architecture of complex traits.

Keywords: cis-eQTLs; complex traits; core genes; genetic architecture; heritability; omnigenic model; polygenic model; trans-eQTLs.


Conflict of interest statement

DECLARATION OF INTERESTS

The authors have no conflict of interest to declare.

Figures

Figure 1.
Figure 1.. Our Model Starts by Defining “Core” Genes as the Set of Genes that Exert Direct Effects on a Trait, i.e., Not Mediated through Regulation of Other Genes
(A) Core genes are embedded in gene regulatory networks; other expressed genes (i.e., peripheral genes) may affect core-gene expression through the network and thus affect the trait indirectly. (B) According to the model, most cis-regulatory variants for peripheral genes are also weak trans-QTLs for core genes, and the direction of effect varies across core genes. Thus, typical peripheral variants make tiny contributions to heritability, but because there are so many, they are responsible for most of the heritability. (C) Some peripheral genes drive coordinated regulation of multiple core genes with shared directional effects and can thus stand out as relatively strong GWAS hits. As discussed later in the paper, likely examples include KLF14 and IRX3/5 (Claussnitzer et al., 2015; Small et al., 2018).
Figure 2.
Figure 2.. Causal Pathways for Variants Affecting a Trait through Core Genes
By definition, only the core genes exert direct effects on the phenotype. We assume that they do so mainly through variation in expression levels. (A) cis- and trans-regulatory effects are funneled through core genes to affect the phenotype. (B) From the vantage point of a regulatory QTL SNP, effects fan out through cellular regulatory networks to affect one or more core genes.
Figure 3.
Figure 3.. Cumulative Distributions of Signal Sizes for the Strongest cis- and trans-eQTLs for Each Expressed Gene in Whole Blood (n = 913)
The signals are plotted as |Z| scores; note that Z2 is proportional to the genetic variance contributed by each SNP. To reduce the biasing effects of winner’s curse and the very different numbers of tests in cis and trans, we first identified the most significant cis and most significant trans signal for every gene in one dataset (Wright et al., 2014) and plot here the distribution of Z scores for those SNP-gene pairs in a replication dataset (Battle et al., 2014) (Key Resources Table).
Figure 4.
Figure 4.. Modeling Predicts that 70% to Nearly 100% of Heritability Is Driven by Weak Trans Effects
(A) In model 1, we assume that expression of core genes tends to be relatively independent. In this case, we predict that about 30% of heritability is in cis to the core genes. In model 2, we assume that core genes are often co-regulated, with coordinated directions of effects. In this case, for any given individual, the aggregated effects of peripheral variants are partially shared across core genes, while the directions of cis effects at core genes may be up, or down, independently across genes. This effectively transfers most of the heritability out to a large number of peripheral regulators. (B) Illustration of the fraction of genetic variance due to trans variance and covariance effects (Equation 3). Simplifications for plotting: Vj and |γj| constant across j. The different curves show different values of the “scaled correlation” E[sign(γjγk)•Cj,k]/VjVk. See also Figure S2.
Figure 5.
Figure 5.. Effect Sizes of Cis- and Trans-Regulatory Variants on a Trait
Here, the αs are eQTL effect sizes of SNPs on core genes, and the γs are effect sizes of core genes on the phenotype. (A and B) For a single core gene, cis-regulatory variants will tend to have larger effect sizes on the trait compared to trans variants, as cis-eQTLs tend to be much stronger than trans-eQTLs. (C) trans-acting variants that affect many core genes will usually, but not always, have small effect sizes on the trait if the directions of effects on core genes are uncorrelated. (D) trans-regulators can have large effects on a trait if they act on many core genes in a correlated manner. Black and red arrows indicate positive and negative effects, respectively. “+” and “-“ indicate the sign of αl,jγj for each core gene.
Figure 6.
Figure 6.. Pleiotropy and Genetic Correlation
(A) If the core genes for two traits are uncorrelated, then variants that are trans-eQTLs may affect both traits but with uncorrelated directions of effect. (B) If some of the core genes are shared between traits or expression of the core genes is genetically correlated, then this may lead to genetic covariance of the traits. Genetic covariance of the traits occurs if the directions of trans-regulation and effect sizes tend to line up between the two traits in a coordinated way (i.e., that sums of γj,Aγj,B for shared core genes, and γj,Aγk,BCj,k across pairs of core genes, are either substantially positive or negative overall).

Similar articles

Cited by

References

    1. Albert FW, Bloom JS, Siegel J, Day L, and Kruglyak L (2018). Genetics of trans-regulatory variation in gene expression. eLife 7, e35471. - PMC - PubMed
    1. Anttila V, Bulik-Sullivan B, Finucane HK, Walters RK, Bras J, Duncan L, Escott-Price V, Falcone GJ, Gormley P, Malik R, et al.; Brainstorm Consortium (2018). Analysis of shared heritability in common disorders of the brain. Science 360, eaap8757. - PMC - PubMed
    1. Ardlie KG, Deluca DS, Segrè AV, Sullivan TJ, Young TR, Gelfand ET, Trowbridge CA, Maller JB, Tukiainen T, Lek M, et al.; GTEx Consortium (2015). Human genomics. The Genotype-Tissue Expression (GTEx) pilot analysis: multitissue gene regulation in humans. Science 348, 648–660. - PMC - PubMed
    1. Barton NH, Etheridge AM, and Vèber A (2017). The infinitesimal model: Definition, derivation, and implications. Theor. Popul. Biol. 118, 50–73. - PubMed
    1. Bassik MC, Kampmann M, Lebbink RJ, Wang S, Hein MY, Poser I, Weibezahn J, Horlbeck MA, Chen S, Mann M, et al. (2013).A systematic mammalian genetic interaction map reveals pathways underlying ricin susceptibility. Cell 152, 909–922. - PMC - PubMed

Publication types