

The Molecular Basis for Apolipoprotein E4 as the Major Risk Factor for Late-Onset Alzheimer's Disease
- PMID: 31051176
- PMCID: PMC6556554
- DOI: 10.1016/j.jmb.2019.04.019
The Molecular Basis for Apolipoprotein E4 as the Major Risk Factor for Late-Onset Alzheimer's Disease
Abstract
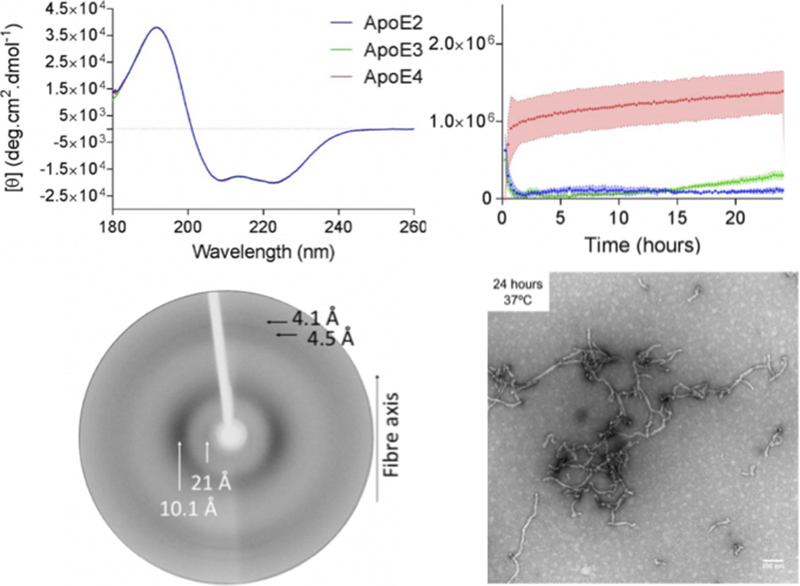
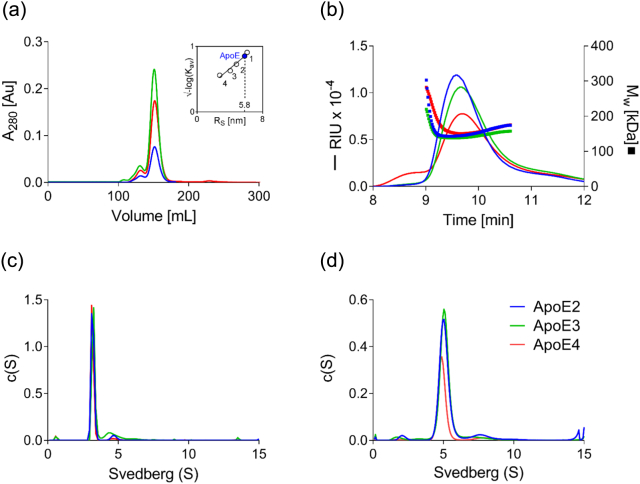
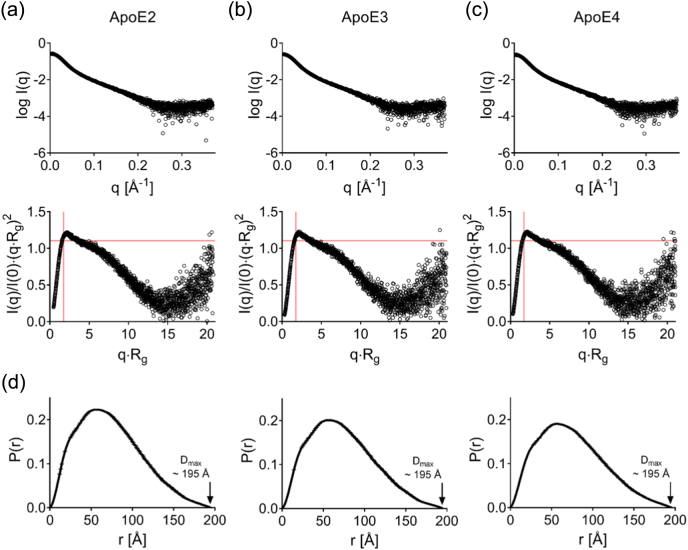
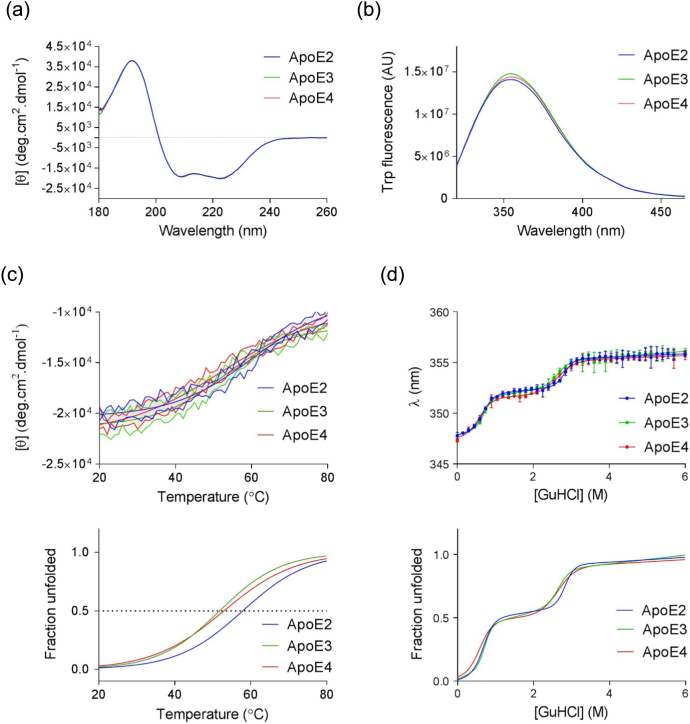
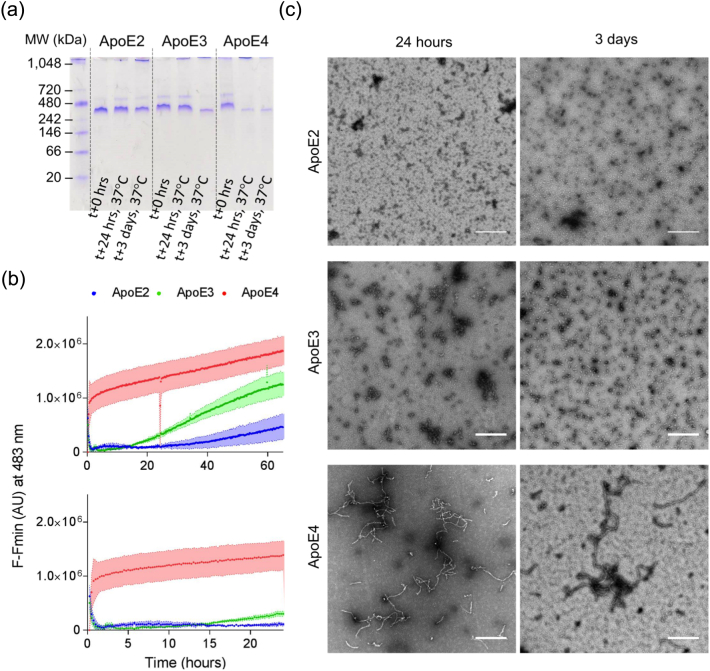
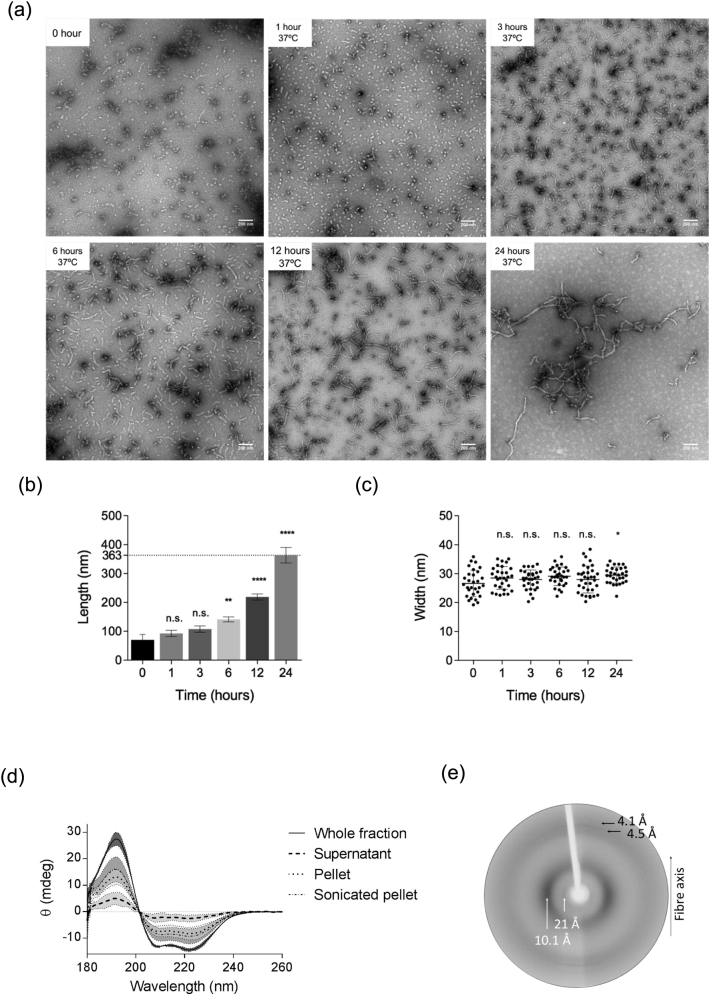
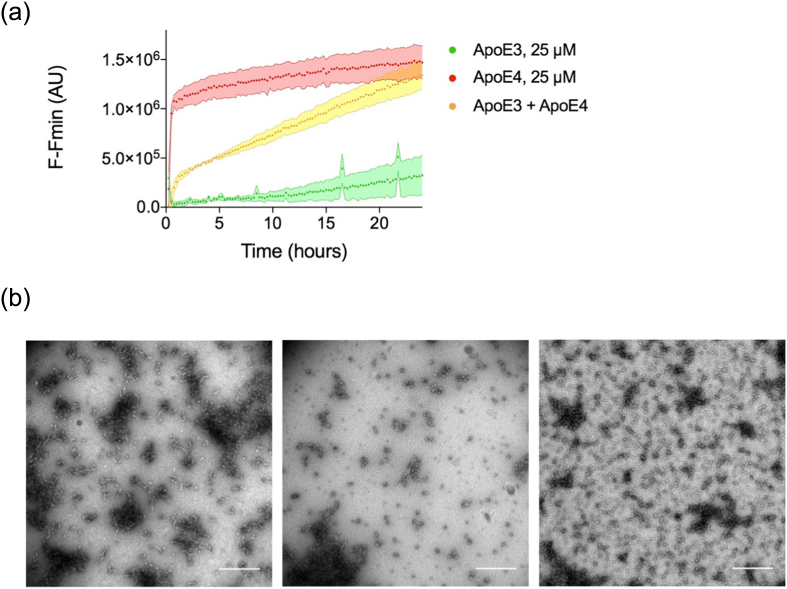
Apolipoprotein E4 (ApoE4) is one of three (E2, E3 and E4) human isoforms of an α-helical, 299-amino-acid protein. Homozygosity for the ε4 allele is the major genetic risk factor for developing late-onset Alzheimer's disease (AD). ApoE2, ApoE3 and ApoE4 differ at amino acid positions 112 and 158, and these sequence variations may confer conformational differences that underlie their participation in the risk of developing AD. Here, we compared the shape, oligomerization state, conformation and stability of ApoE isoforms using a range of complementary biophysical methods including small-angle x-ray scattering, analytical ultracentrifugation, circular dichroism, x-ray fiber diffraction and transmission electron microscopy We provide an in-depth and definitive study demonstrating that all three proteins are similar in stability and conformation. However, we show that ApoE4 has a propensity to polymerize to form wavy filaments, which do not share the characteristics of cross-β amyloid fibrils. Moreover, we provide evidence for the inhibition of ApoE4 fibril formation by ApoE3. This study shows that recombinant ApoE isoforms show no significant differences at the structural or conformational level. However, self-assembly of the ApoE4 isoform may play a role in pathogenesis, and these results open opportunities for uncovering new triggers for AD onset.
Keywords: Alzheimer's disease; alpha-helix; analytical ultracentrifugation; apolipoprotein E; small-angle x-ray scattering.
Copyright © 2019. Published by Elsevier Ltd.
Figures
Similar articles
-
Interaction of nascent ApoE2, ApoE3, and ApoE4 isoforms expressed in mammalian cells with amyloid peptide beta (1-40). Relevance to Alzheimer's disease.Biochemistry. 1997 Aug 26;36(34):10571-80. doi: 10.1021/bi9626362. Biochemistry. 1997. PMID: 9265639
-
Helical structure, stability, and dynamics in human apolipoprotein E3 and E4 by hydrogen exchange and mass spectrometry.Proc Natl Acad Sci U S A. 2017 Jan 31;114(5):968-973. doi: 10.1073/pnas.1617523114. Epub 2017 Jan 17. Proc Natl Acad Sci U S A. 2017. PMID: 28096372 Free PMC article.
-
Characterization of the binding of amyloid-beta peptide to cell culture-derived native apolipoprotein E2, E3, and E4 isoforms and to isoforms from human plasma.J Neurochem. 1997 Feb;68(2):721-5. doi: 10.1046/j.1471-4159.1997.68020721.x. J Neurochem. 1997. PMID: 9003062
-
Apolipoprotein E isoforms in Alzheimer's disease pathology and etiology.Microsc Res Tech. 2000 Aug 15;50(4):278-81. doi: 10.1002/1097-0029(20000815)50:4<278::AID-JEMT5>3.0.CO;2-T. Microsc Res Tech. 2000. PMID: 10936880 Review.
-
The interaction of amyloid-beta with ApoE.Subcell Biochem. 2005;38:255-72. doi: 10.1007/0-387-23226-5_13. Subcell Biochem. 2005. PMID: 15709483 Review.
Cited by
-
Effect of Periodontal Disease on Alzheimer's Disease: A Systematic Review.Cureus. 2023 Oct 1;15(10):e46311. doi: 10.7759/cureus.46311. eCollection 2023 Oct. Cureus. 2023. PMID: 37916259 Free PMC article. Review.
-
Lipoproteins in the Central Nervous System: From Biology to Pathobiology.Annu Rev Biochem. 2022 Jun 21;91:731-759. doi: 10.1146/annurev-biochem-032620-104801. Epub 2022 Mar 18. Annu Rev Biochem. 2022. PMID: 35303786 Free PMC article. Review.
-
ApoE4 Alters ABCA1 Membrane Trafficking in Astrocytes.J Neurosci. 2019 Nov 27;39(48):9611-9622. doi: 10.1523/JNEUROSCI.1400-19.2019. Epub 2019 Oct 22. J Neurosci. 2019. PMID: 31641056 Free PMC article.
-
Astrocytic APOE4 removal confers cerebrovascular protection despite increased cerebral amyloid angiopathy.Mol Neurodegener. 2023 Mar 16;18(1):17. doi: 10.1186/s13024-023-00610-x. Mol Neurodegener. 2023. PMID: 36922879 Free PMC article.
-
ApoE Lipidation as a Therapeutic Target in Alzheimer's Disease.Int J Mol Sci. 2020 Sep 1;21(17):6336. doi: 10.3390/ijms21176336. Int J Mol Sci. 2020. PMID: 32882843 Free PMC article. Review.
References
-
- Selkoe D.J. The molecular pathology of Alzheimer's disease. Neuron. 1991;6:487–498. - PubMed
-
- Rall S.C., Jr., Weisgraber K.H., Mahley R.W. Human apolipoprotein E. The complete amino acid sequence. J. Biol. Chem. 1982;257:4171–4178. - PubMed
-
- Uddin M.S., Kabir M.T., Al Mamun A., Abdel-Daim M.M., Barreto G.E., Ashraf G.M. APOE and Alzheimer's disease: evidence mounts that targeting APOE4 may Combat Alzheimer's pathogenesis. Mol. Neurobiol. 2019;56:2450–2465. - PubMed
-
- Dupont-Wallois L., Soulie C., Sergeant N., Wavrant-de Wrieze N., Chartier-Harlin M.C., Delacourte A. ApoE synthesis in human neuroblastoma cells. Neurobiol. Dis. 1997;4:356–364. - PubMed
Publication types
MeSH terms
Substances
Grants and funding
LinkOut - more resources
Full Text Sources
Medical
Miscellaneous
