

A randomized trial to assess beverage hydration index in healthy older adults
- PMID: 31051498
- PMCID: PMC6537935
- DOI: 10.1093/ajcn/nqz009
A randomized trial to assess beverage hydration index in healthy older adults
Abstract
Background: The beverage hydration index (BHI) is a composite measure of fluid balance after consuming a test beverage relative to water. BHI is a relatively new measure that has been explored in young, but not yet older, adults.
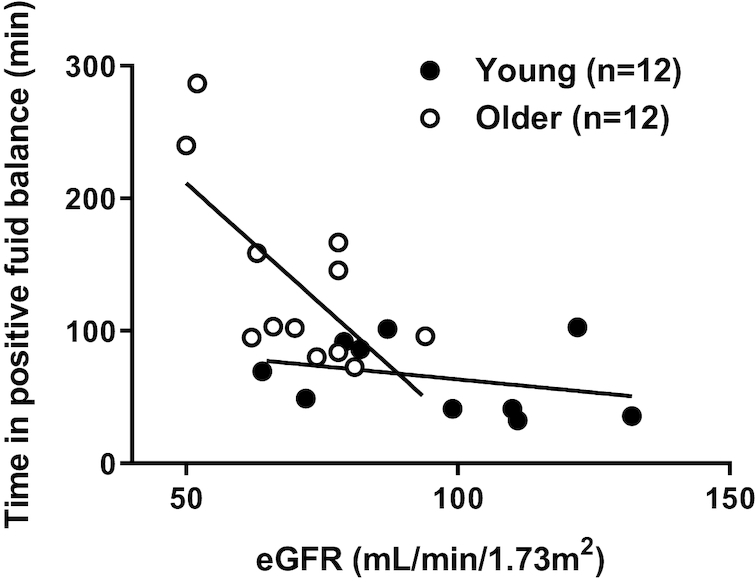
Objective: The aim of this study was to investigate potential differences in BHI between euhydrated younger and older adults after drinking 4 different commercial beverages. We hypothesized that 1) older subjects would remain in positive fluid balance longer than young subjects after ingestion of each test beverage due to decreased urinary excretion rates, 2) glucose (glu)- and amino acid (AA)-based hydration beverages with sodium would have a BHI greater than water in both groups, and 3) the traditional 2-h postingestion BHI may be inappropriate for older adults.
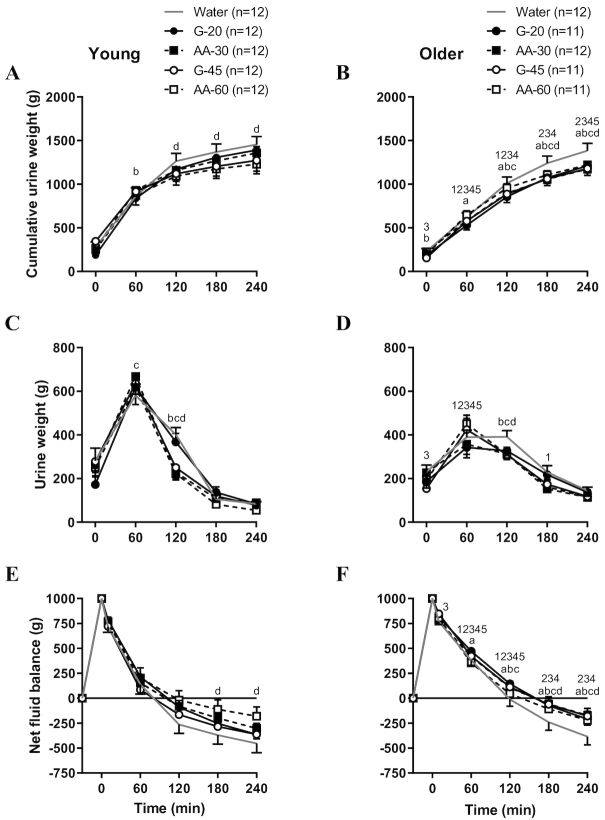
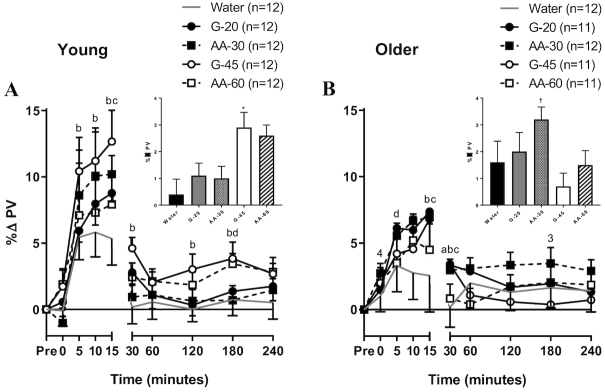
Methods: On 5 separate visits, 12 young (23 ± 3 yr, 7 M/5F) and 12 older (67 ± 6 yr, 5 M/7F) subjects consumed 1 L of distilled water, G-20 (6% CHO, 20 mmol/L Na+), G-45 (2.5% CHO, 45 mmol/L Na+), AA-30 (5 AAs, 30 mmol/L Na+), or AA-60 (8 AAs, 60 mmol/L Na+) over 30 min. Blood and urine samples were collected before ingestion and at 0, 60, 120, 180, and 240 min postingestion with additional venous blood sampling at 5, 10, 15, and 30 min postingestion.
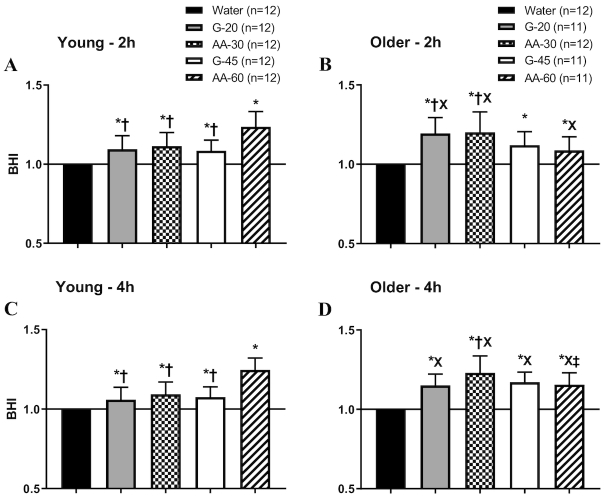
Results: In young subjects, BHI increased with increasing beverage Na+ concentration, and AA-60 had the highest BHI (AA-60 = 1.24 ± 0.10 compared with water = 1.00, P = 0.01). For older subjects, BHI was highest in AA-30 (AA-30; 1.20 ± 0.13 compared with water, P < 0.01) and was still in flux beyond 2 h in AA-60 (P < 0.05).
Conclusions: Beverage Na+ content progressively increased BHI in young adults independent of glucose or AA content. For older adults, the AA-30 beverage had the highest BHI. A 4-h BHI may be more appropriate for older adults due to attenuated urine excretion rates. This trial was registered at clinicaltrials.gov as NCT03559101.
Keywords: BHI; eGFR; healthy aging; net fluid balance; plasma volume.
Copyright © American Society for Nutrition 2019.
Figures
Similar articles
-
Age-related differences in water and sodium handling after commercial hydration beverage ingestion.J Appl Physiol (1985). 2019 Apr 1;126(4):1042-1048. doi: 10.1152/japplphysiol.01094.2018. Epub 2019 Feb 14. J Appl Physiol (1985). 2019. PMID: 30763158 Free PMC article.
-
A randomized trial to assess the potential of different beverages to affect hydration status: development of a beverage hydration index.Am J Clin Nutr. 2016 Mar;103(3):717-23. doi: 10.3945/ajcn.115.114769. Epub 2015 Dec 23. Am J Clin Nutr. 2016. PMID: 26702122 Clinical Trial.
-
Neither body mass nor sex influences beverage hydration index outcomes during randomized trial when comparing 3 commercial beverages.Am J Clin Nutr. 2018 Apr 1;107(4):544-549. doi: 10.1093/ajcn/nqy005. Am J Clin Nutr. 2018. PMID: 29635499 Clinical Trial.
-
Role of whole foods in promoting hydration after exercise in humans.J Am Coll Nutr. 2007 Oct;26(5 Suppl):592S-596S. doi: 10.1080/07315724.2007.10719664. J Am Coll Nutr. 2007. PMID: 17921471 Review.
-
Fluid and electrolyte balance in ultra-endurance sport.Sports Med. 2001;31(10):701-15. doi: 10.2165/00007256-200131100-00001. Sports Med. 2001. PMID: 11547892 Review.
Cited by
-
Compositional Aspects of Beverages Designed to Promote Hydration Before, During, and After Exercise: Concepts Revisited.Nutrients. 2023 Dec 20;16(1):17. doi: 10.3390/nu16010017. Nutrients. 2023. PMID: 38201848 Free PMC article. Review.
-
Impact of Nuun Electrolyte Tablets on Fluid Balance in Active Men and Women.Nutrients. 2020 Oct 2;12(10):3030. doi: 10.3390/nu12103030. Nutrients. 2020. PMID: 33023276 Free PMC article. Clinical Trial.
-
Randomized Trial to Assess the Safety and Tolerability of Daily Intake of an Allulose Amino Acid-Based Hydration Beverage in Men and Women.Nutrients. 2024 Jun 5;16(11):1766. doi: 10.3390/nu16111766. Nutrients. 2024. PMID: 38892699 Free PMC article. Clinical Trial.
-
Hydration Efficacy of a Milk Permeate-Based Oral Hydration Solution.Nutrients. 2020 May 21;12(5):1502. doi: 10.3390/nu12051502. Nutrients. 2020. PMID: 32455677 Free PMC article.
-
A randomised trial to assess fluid and electrolyte balance responses following ingestion of different beverages in young and older men.Eur J Appl Physiol. 2023 Oct;123(10):2331-2340. doi: 10.1007/s00421-023-05241-0. Epub 2023 Jun 9. Eur J Appl Physiol. 2023. PMID: 37294517 Free PMC article. Clinical Trial.
References
-
- Lakatta EG, Levy D. Arterial and cardiac aging: Major shareholders in cardiovascular disease enterprises: Part I: Aging arteries: A “set up” for vascular disease. Circulation. 2003;107(1):139–46. - PubMed
-
- Crowe MJ, Forsling ML, Rolls BJ, Phillips PA, Ledingham JG, Smith RF. Altered water excretion in healthy elderly men. Age Ageing. 1987;16(5):285–93. - PubMed
-
- Fish LC, Murphy DJ, Elahi D, Minaker KL. Renal sodium excretion in normal aging: Decreased excretion rates lead to delayed handling of sodium loads. Geriatr Nephrol Urol. 1994;4(3):145–51.
-
- Mack GW, Weseman CA, Langhans GW, Scherzer H, Gillen CM, Nadel ER. Body fluid balance in dehydrated healthy older men: Thirst and renal osmoregulation. J Appl Physiol. 1994;76(4):1615–23. - PubMed
-
- de Castro JM. Age-related changes in natural spontaneous fluid ingestion and thirst in humans. J Gerontol. 1992;47(5):P321–30. - PubMed
Publication types
MeSH terms
Substances
Associated data
Grants and funding
LinkOut - more resources
Full Text Sources
Medical
Research Materials
Miscellaneous
