Randomized Controlled Trial
. 2019 May 1;109(5):1239-1250.
doi: 10.1093/ajcn/nqy356.

Using metabolic profiling and gene expression analyses to explore molecular effects of replacing saturated fat with polyunsaturated fat-a randomized controlled dietary intervention study

Affiliations
Randomized Controlled Trial

Using metabolic profiling and gene expression analyses to explore molecular effects of replacing saturated fat with polyunsaturated fat-a randomized controlled dietary intervention study

Stine M Ulven et al. Am J Clin Nutr. .

Erratum in

Abstract

Background: Replacing dietary saturated fatty acids (SFAs) with polyunsaturated fatty acids (PUFA) reduces the plasma low-density lipoprotein (LDL) cholesterol and subsequently the risk of cardiovascular disease. However, beyond changes in LDL cholesterol, we lack a complete understanding of the physiologic alterations that occur when improving dietary fat quality.

Objectives: The aim of this study was to gain knowledge of metabolic alterations paralleling improvements in the fat quality of the diet.

Methods: We recently conducted an 8-wk, double-blind, randomized controlled trial replacing SFAs with PUFAs in healthy subjects with moderate hypercholesterolemia (n = 99). In the present substudy, we performed comprehensive metabolic profiling with multiple platforms (both nuclear magnetic resonance- and mass spectrometry-based technology) (n = 99), and analyzed peripheral blood mononuclear cell gene expression (n = 95) by quantitative real-time polymerase chain reaction.

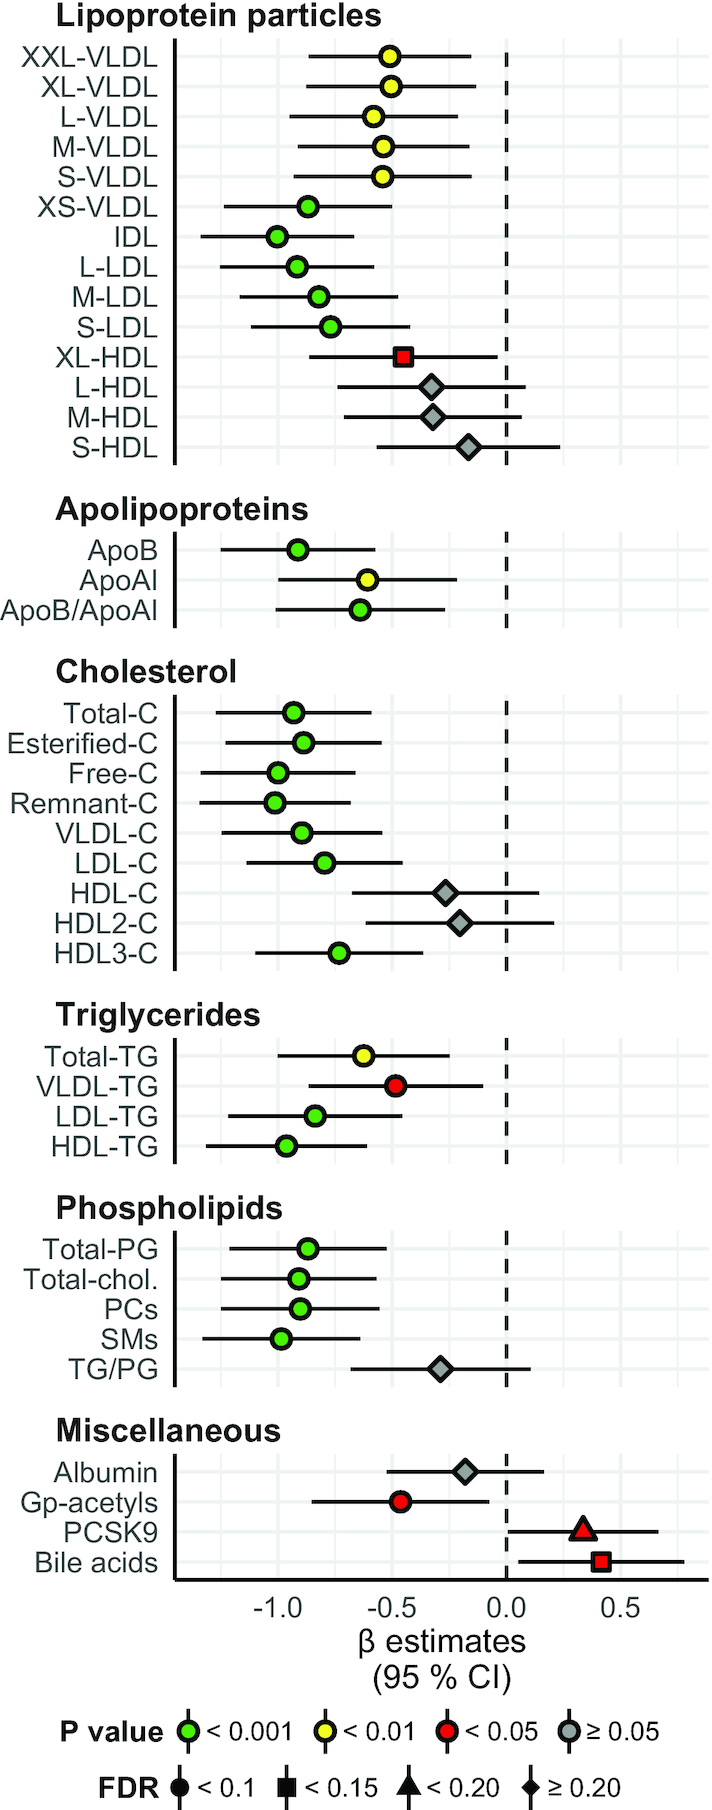
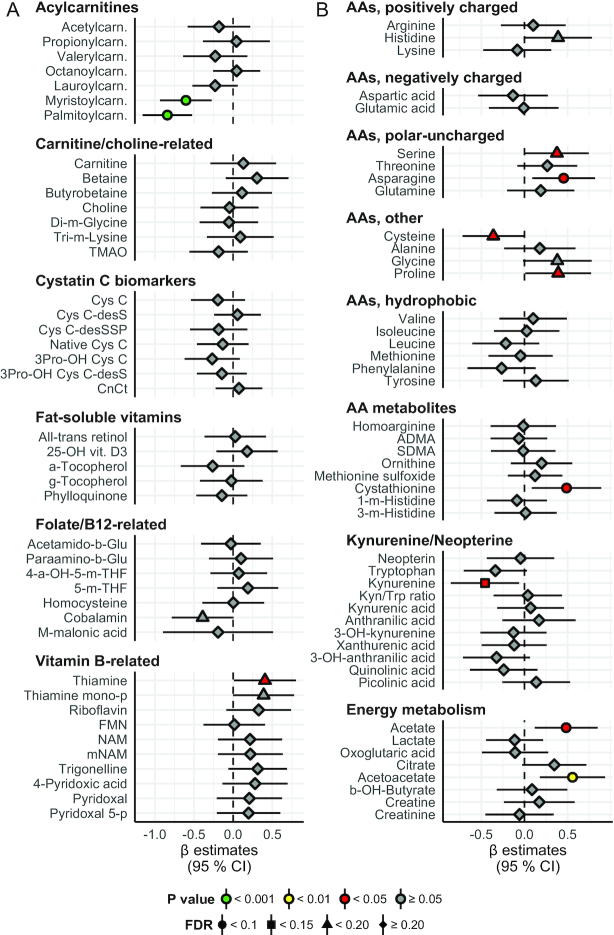
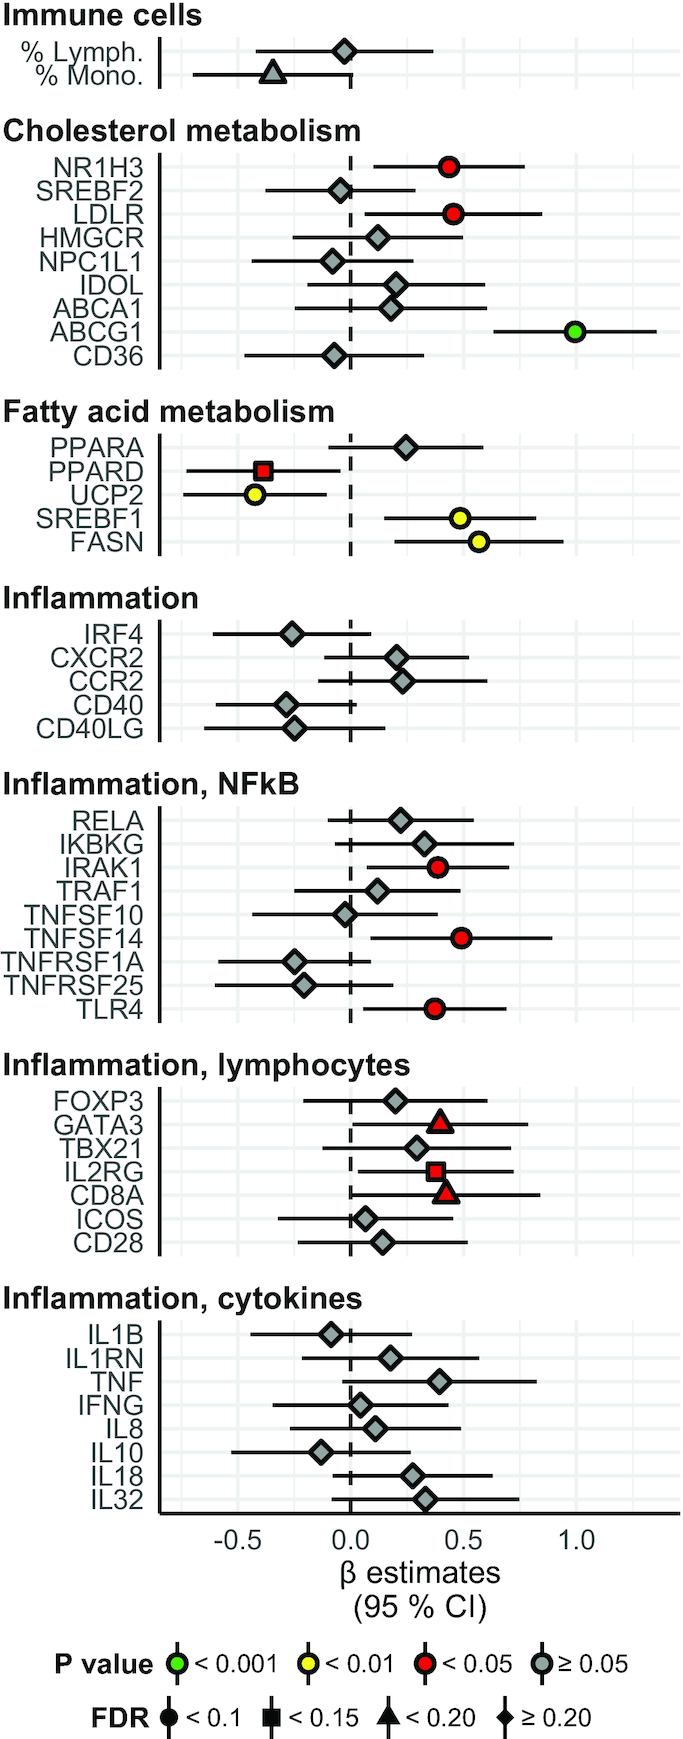
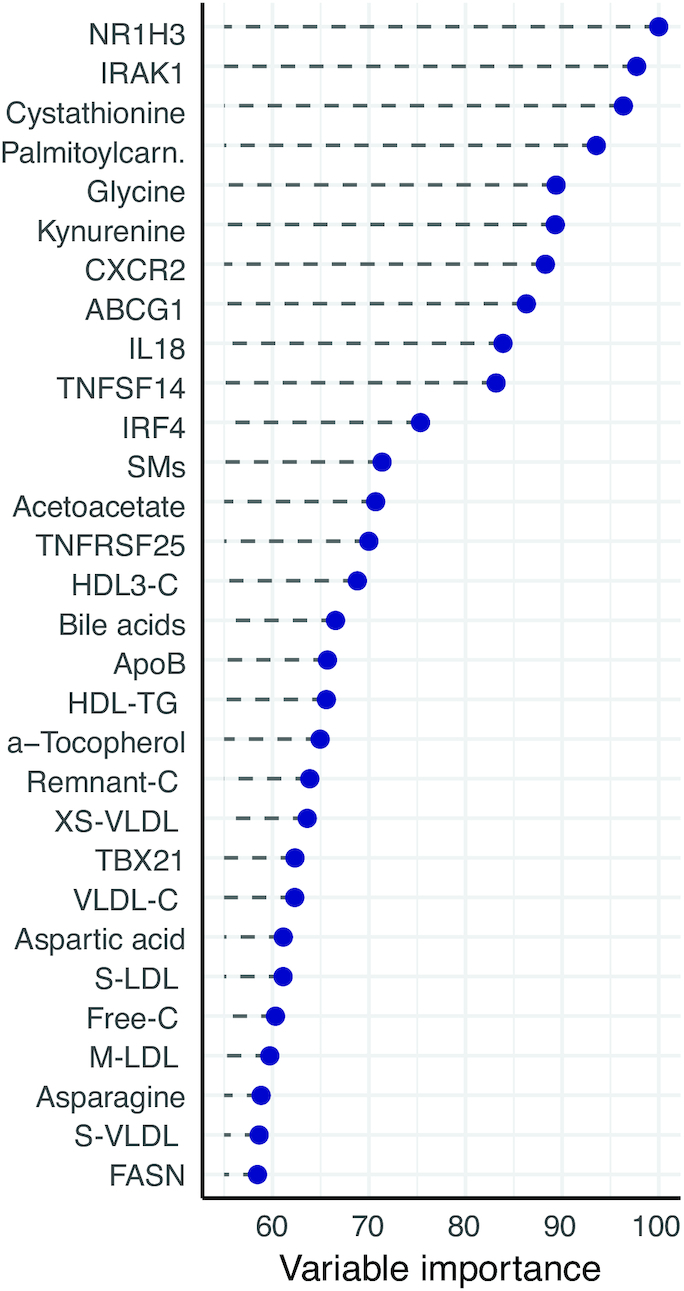
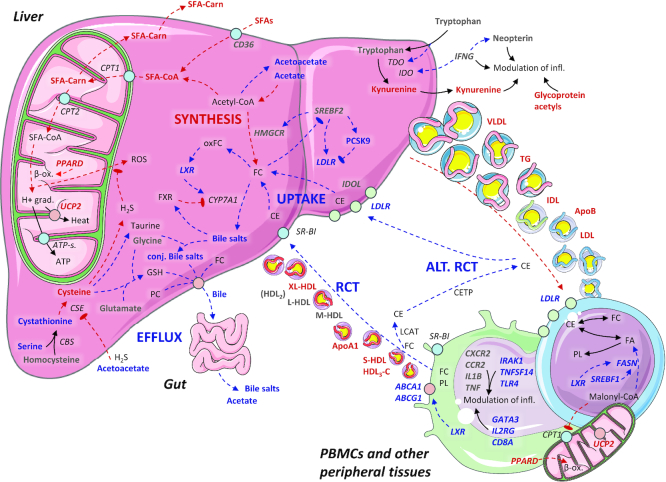
Results: A large number of lipoprotein subclasses, myristoylcarnitine and palmitoylcarnitine, and kynurenine were reduced when SFAs were replaced with PUFAs. In contrast, bile acids, proprotein convertase subtilisin/kexin type 9, acetate, and acetoacetate were increased by the intervention. Some amino acids were also altered by the intervention. The mRNA levels of LXRA and LDLR were increased, in addition to several liver X receptor α target genes and genes involved in inflammation, whereas the mRNA levels of UCP2 and PPARD were decreased in peripheral blood mononuclear cells after replacing SFAs with PUFAs. Partial least squares-discriminant analysis showed that the 30 most important variables that contributed to class separation spanned all classes of biomarkers, and was in accordance with the univariate analysis.

Conclusions: Applying metabolomics in randomized controlled dietary intervention trials has the potential to extend our knowledge of the biological and molecular effects of dietary fat quality. This study was registered at clinicaltrials.gov as NCT01679496.

Keywords: acylcarnitines; cardiovascular risk factors; fatty acids; gene expression; lipoprotein subclasses; metabolic profiling; nutrition; tryptophan.


Figures

FIGURE 1
FIGURE 1
Lipid particles, lipid species, bile acids, and other miscellaneous proteins: between-group differences in change from baseline to the end of the study. Concentration of lipoprotein particles, apolipoproteins, cholesterol, triglycerides, phospholipids, and miscellaneous factors in the Ex-diet group (symbols, n = 47) compared with the C-diet group (black dashed line, n = 52). Estimates on the right and left side of the zero line indicate an increase and decrease, respectively, in the Ex-diet group, compared with the C-diet group. Colors denote P value significance level, and shapes denote FDR q values, as indicated in the figure legend. The data are normalized (centered to mean = 0; scaled to SD = 1), adjusted for age, gender, intervention-related weight change, and baseline value, and presented as linear regression β coefficients. Error bars are 95% CIs for the estimates. Numeric data corresponding to this figure can be found in Supplemental Table 1; this includes the units of the variables and the number of nonmissing values per variable. Apo, apolipoprotein; C, cholesterol; Chol, choline; FDR, false discovery rate; Gp-acetyl, glycoprotein acetyl (mainly a1-acid glycoprotein); IDL, intermediate-density lipoprotein; L, large; M, medium; PC, phosphatidylcholine and other cholines; PCSK9, proprotein convertase subtilisin/kexin type 9; PG, phosphoglyceride; S, small; SM, sphingomyelin; TG, triglyceride; XL, very large; XS, very small; XXL, extremely large.
FIGURE 2
FIGURE 2
Metabolites and biomarkers: between-group differences in change from baseline to the end of the study. Concentration of acylcarnitines, carnitine, and choline-related metabolites, cystatin C biomarkers, fat-soluble vitamins, folate and B-12–related metabolites, vitamin B–related metabolites, amino acids, kynurenine and neopterin-related metabolites, and energy metabolites. Overall, the interpretation is as in Figure 1. Numeric data corresponding to this figure can be found in Supplemental Table 1; this includes the units of the variables and the number of nonmissing values per variable. a, alpha; ADMA, asymmetric dimethylarginine; b, benzoyl; Carn, carnitine; Cys, cystatin; desS/desSSP/3Pro/CnCt, various cystatin C isoforms; FMN, flavin mononucleotide; g, gamma; Glu, glutamate; Kyn, kynurenine; m, methyl; mNAM, N1-methylnicotinamide; NAM, nicotinamide; p, phosphate; SDMA, symmetric dimethylarginine; THF, tetrahydrofolate; TMAO, trimethylamine N-oxide; Trp, tryptophan; vit, vitamin.
FIGURE 3
FIGURE 3
Gene expression: between-group differences in change from baseline to the end of the study. Fold change in genes involved in cholesterol and fatty acid metabolism and inflammation, and percentage level of immune cells in blood. Overall the interpretation is as in Figure 1. Numeric data corresponding to this figure can be found in Supplemental Table 1; this includes the units of the variables and the number of nonmissing values per variable. ABCA1, ATP-binding cassette transporter A1; ABCG1, ATP-binding cassette transporter G1; CCR2, C-C chemokine receptor type 2; CD28, cluster of differentiation 28; CD36, cluster of differentiation 36; CD40, cluster of differentiation 40; CD40LG, CD40 ligand; CD8A, cluster of differentiation 8A; CXCR2, C-X-C motif chemokine receptor 2; FASN, fatty acid synthase; FOXP3, forkhead box P3; GATA3, GATA binding protein 3; HMGCR, HMG-CoA reductase (3-hydroxy-3-methyl-glutaryl-coenzyme A reductase); ICOS, inducible T-cell costimulator; IDOL, increased degradation of LDL receptor protein; IFNG, interferon γ; IKBKG, inhibitor of nuclear factor κB kinase subunit γ; IL1B, interleukin 1β; IL1RN, interleukin 1 receptor antagonist; IL2RG, interleukin-2 receptor subunit gamma; IRAK1, interleukin-1 receptor–associated kinase 1; IRF4, interferon regulatory factor 4; LDLR, low-density lipoprotein receptor; NPC1L1, Niemann-Pick C1-Like 1; NR1H3, nuclear receptor subfamily 1 group H member 3; PPARA, peroxisome proliferator–activated receptor α; PPARD, peroxisome proliferator–activated receptor δ; RELA, nuclear factor κB p65 subunit; SREBF1, sterol regulatory element–binding protein 1; SREBF2, sterol regulatory element–binding protein 2; TBX21, T-box transcription factor; TLR4, toll-like receptor 4; TNF, tumor necrosis factor; TNFSF10, tumor necrosis factor (ligand) superfamily, member 10; TNFSF14, tumor necrosis factor (ligand) superfamily, member 14; TNFRSF1A, tumor necrosis factor receptor superfamily member 1A; TNFRSF25, tumor necrosis factor receptor superfamily member 25; TRAF1, TNF receptor–associated factor 1; UCP2, mitochondrial uncoupling protein 2.
FIGURE 4
FIGURE 4
Cluster dendrogram. Clustering of all 173 variables displayed in Figures 1–3. We calculated Spearman's correlation and Euclidean distance, and performed hierarchic clustering (complete linkage). The resulting cluster dendrogram was cut into 10 clusters, and both tree branches and labels were colored according to cluster affiliation. Abbreviations as in Figures 1–3.
FIGURE 5
FIGURE 5
Variable importance. Estimated variable importance of the top 30 highest-ranked variables, determined from a partial least-squares discriminant analysis (PLS-DA) model. These variables are the most likely to contribute to the discriminatory ability of the PLS-DA model. All 173 variables have variable importance between 0 and 100. For elaborate description of the model, see Methods. Abbreviations as in Figures 1–3.
FIGURE 6
FIGURE 6
Graphical summary. Hypothetic physiologic changes that occur when replacing SFAs with PUFAs diet, as outlined in the Discussion. Annotations: bold grey, no difference; plain grey (nonbold), not measured; bold blue, increased/higher; bold red, reduced/lower; italics: gene names. Possible sequence of events: replacing SFAs with PUFAs changes the expression of LDLR, possibly via SREBP2 or other regulatory mechanisms. Higher expression of LDLR causes a higher hepatic uptake of apoB-containing lipoproteins, which reduces plasma lipoprotein subclasses, both apoB- and apoAI-containing types. This effect may be partially offset by higher expression of PCSK9. In PBMCs, controlled LXR activation may drive an increase in reverse cholesterol transport, which includes synthesis of fatty acids for efflux or to esterify free cholesterol to cholesteryl esters; normally, this would also correspond to an inhibition of β oxidation and modulation of inflammation-related gene expression. Higher hepatic cholesterol uptake both inhibits cholesterol synthesis, and activates cholesterol efflux to the gut. Cholesterol-derived oxysterols activate LXR, which activates the bile salt production. Other bile constituents are also produced, particularly from cysteine and other amino acids. Hepatic acetyl-CoA likely adjusts to a lower need for cholesterol synthesis, and directs energy surplus to production of primary ketone bodies. In addition, lower SFA influx requires less immediate neutralization via the β oxidation pathway, which could be reflected in lower hepatic oxidative stress. Abbreviations as in Figures 1–3.

References

    1. Pedersen JI, James PT, Brouwer IA, Clarke R, Elmadfa I, Katan MB, Kris-Etherton PM, Kromhout D, Margetts BM, Mensink RP et al. .. The importance of reducing SFA to limit CHD. Br J Nutr. 2011;106(7):961–3. - PubMed
    1. Mozaffarian D, Micha R, Wallace S. Effects on coronary heart disease of increasing polyunsaturated fat in place of saturated fat: a systematic review and meta-analysis of randomized controlled trials. PLoS Med. 2010;7(3):e1000252. - PMC - PubMed
    1. Jakobsen MU, O'Reilly EJ, Heitmann BL, Pereira MA, Balter K, Fraser GE, Goldbourt U, Hallmans G, Knekt P, Liu S et al. .. Major types of dietary fat and risk of coronary heart disease: a pooled analysis of 11 cohort studies. Am J Clin Nutr. 2009;89(5):1425–32. - PMC - PubMed
    1. Hegsted DM, Ausman LM, Johnson JA, Dallal GE. Dietary fat and serum lipids: an evaluation of the experimental data. Am J Clin Nutr. 1993;57(6):875–83. - PubMed
    1. Mensink RP, Katan MB. Effect of dietary fatty acids on serum lipids and lipoproteins. A meta-analysis of 27 trials. Arterioscler Thromb. 1992;12(8):911–9. - PubMed

Publication types

MeSH terms

Associated data