

A Two-stage Dynamic Undesirable Data Envelopment Analysis Model Focused on Media Reports and the Impact on Energy and Health Efficiency
- PMID: 31052235
- PMCID: PMC6539354
- DOI: 10.3390/ijerph16091535
A Two-stage Dynamic Undesirable Data Envelopment Analysis Model Focused on Media Reports and the Impact on Energy and Health Efficiency
Abstract
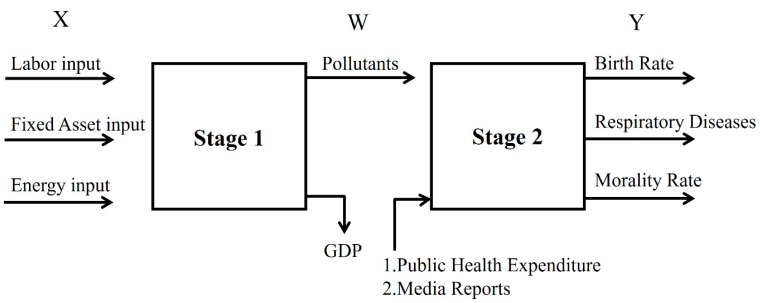
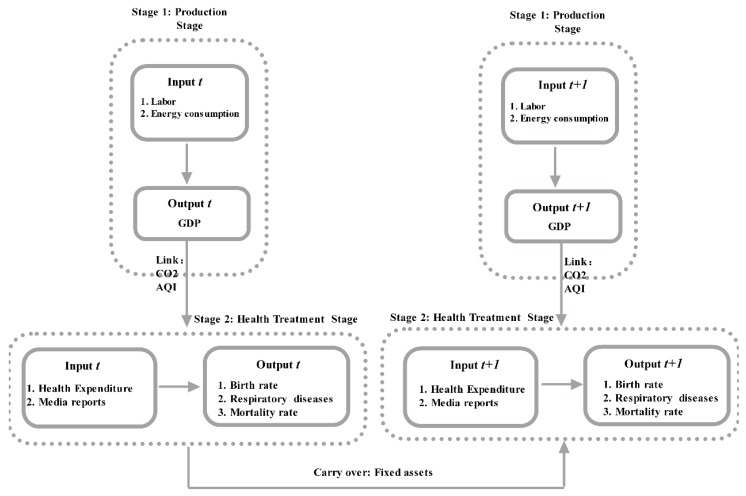
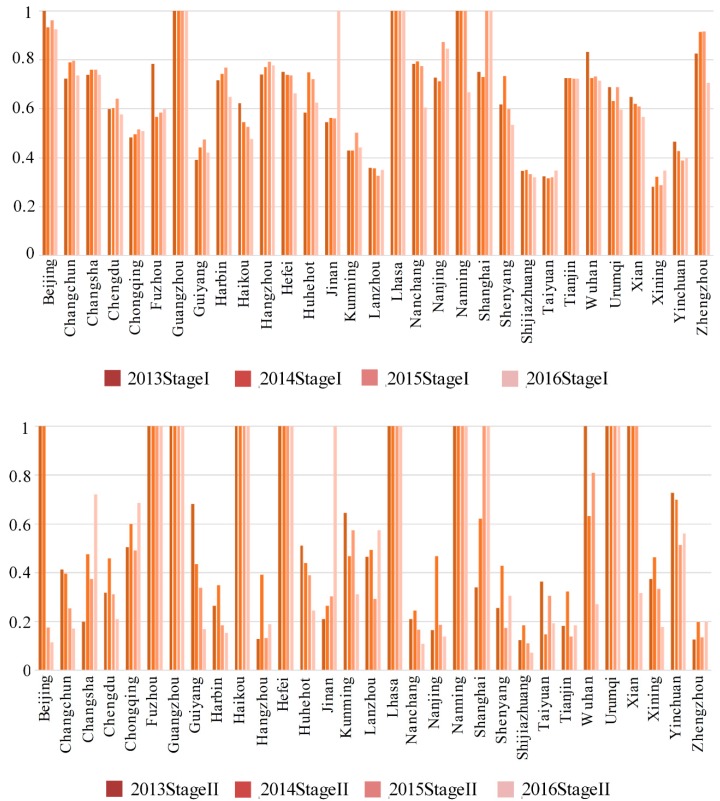
Past research on energy and environmental issues in China has generally focused on energy and environmental efficiencies with no models having included the public health associations or the role of the media. Therefore, to fill this research gap, this paper used a modified Undesirable Dynamic Network model to analyze the efficiency of China's energy, environment, health and media communications, from which it was found that the urban production efficiency stage was better than the health treatment stage, and that the energy efficiencies across the Chinese regions varied significantly, with only Beijing, Guangzhou, Lhasa and Nanning being found to have high efficiencies. Large urban gaps and low efficiencies were found for health expenditure, with the best performances being found in Fuzhou, Guangzhou, Haikou, Hefei, Nanning, and Urumqi. The regions with the best media communication efficiencies were Fuzhou, Guangzhou, Haikou, Hefei, Lhasa, Nanning and Urumqi, and the cities with the best respiratory disease efficiencies were Fuzhou, Guangzhou, Haikou, Lhasa, Nanning, Wuhan, Urumqi, Xian, and Yinchuan. Overall, significant efficiency improvements were needed in health expenditure and in particular in respiratory diseases as there were major differences across the country.
Keywords: Two-Stage Dynamic SBM model efficiency; energy efficiency; environmental efficiency; media; public health.
Conflict of interest statement
The authors declare no conflict of interest.
Figures
References
-
- National Bureau of Statistics of China China Statistical Yearbook. [(accessed on 1 December 2017)];2017 Available online: http://www.stats.gov.cn/
-
- International Energy Agency World Energy Statistics (2017), 2018 Edition. [(accessed on 8 April 2018)]; doi: 10.1111/j.1467-9701.1985.tb00423.x. Available online: - DOI
-
- Elliot A.J., Smith S., Dobney A., Thornes J., Smith G.E., Vardoulakis S. Monitoring the effect of air pollution episodes on health care consultations and ambulance call-outs in England during March/April 2014: A retrospective observational analysis. Environ. Pollut. 2016;214:903–911. doi: 10.1016/j.envpol.2016.04.026. - DOI - PubMed
-
- Hu J.L., Wang S.C. Total-factor energy efficiency of regions in China. Energy Policy. 2006;34:3206–3217. doi: 10.1016/j.enpol.2005.06.015. - DOI
-
- Song M.L., Zhang L.L., Liu W., Fisher R. Bootstrap-DEA analysis of BRICS’ energy efficiency based on small sample data. Appl. Energy. 2013;112:1049–1055. doi: 10.1016/j.apenergy.2013.02.064. - DOI
Publication types
MeSH terms
LinkOut - more resources
Full Text Sources
Miscellaneous
