

Active Fraction from Embryo Fish Extracts Induces Reversion of the Malignant Invasive Phenotype in Breast Cancer through Down-regulation of TCTP and Modulation of E-cadherin/β-catenin Pathway
- PMID: 31052313
- PMCID: PMC6539734
- DOI: 10.3390/ijms20092151
Active Fraction from Embryo Fish Extracts Induces Reversion of the Malignant Invasive Phenotype in Breast Cancer through Down-regulation of TCTP and Modulation of E-cadherin/β-catenin Pathway
Abstract
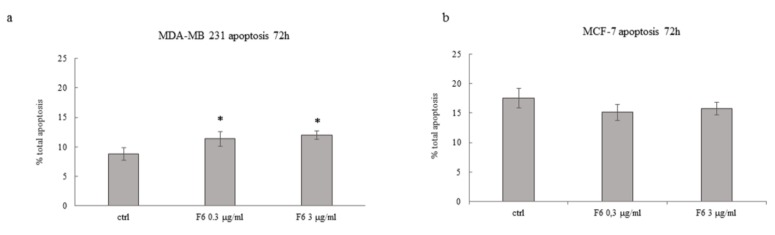
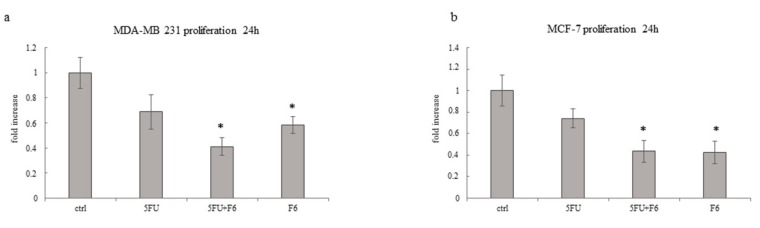
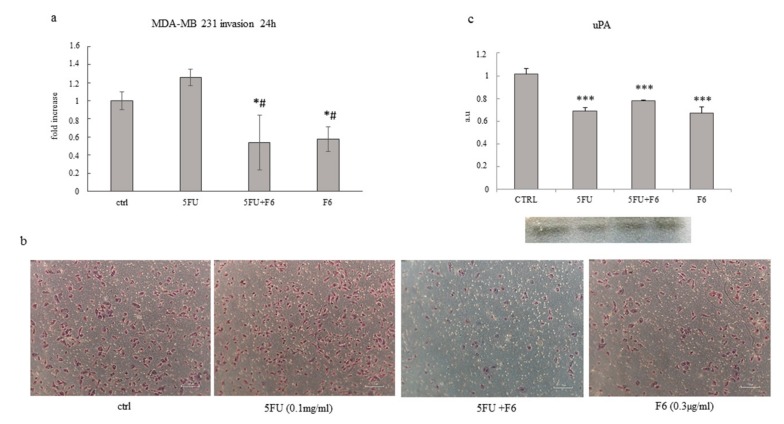
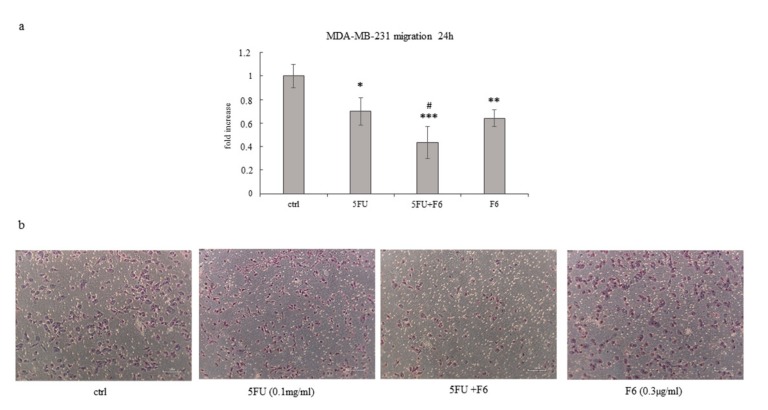
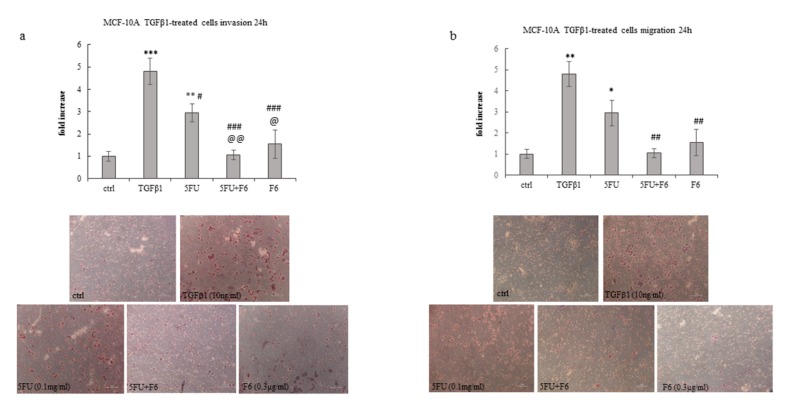
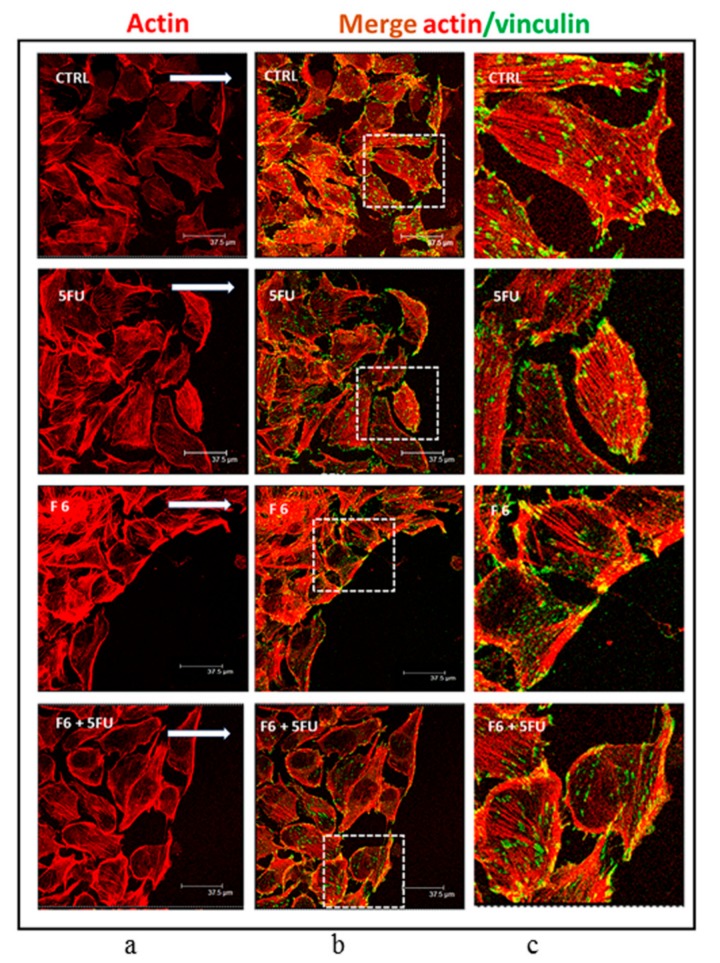
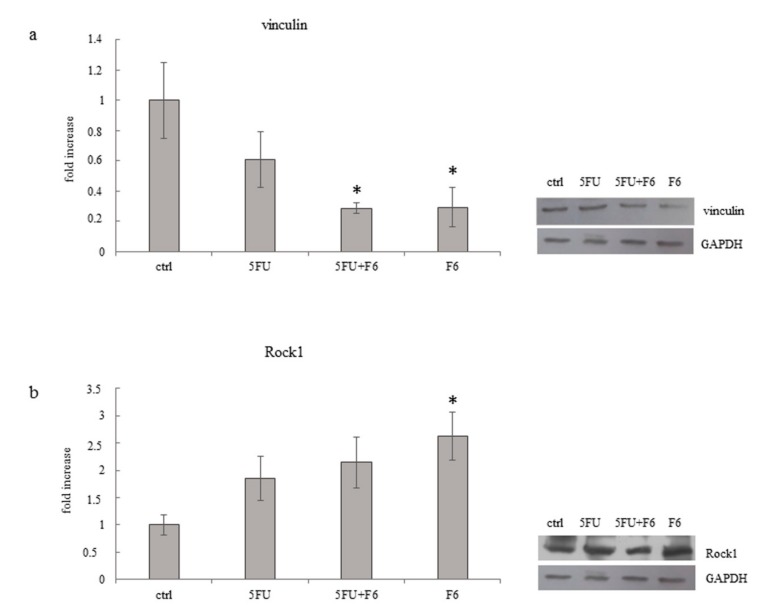
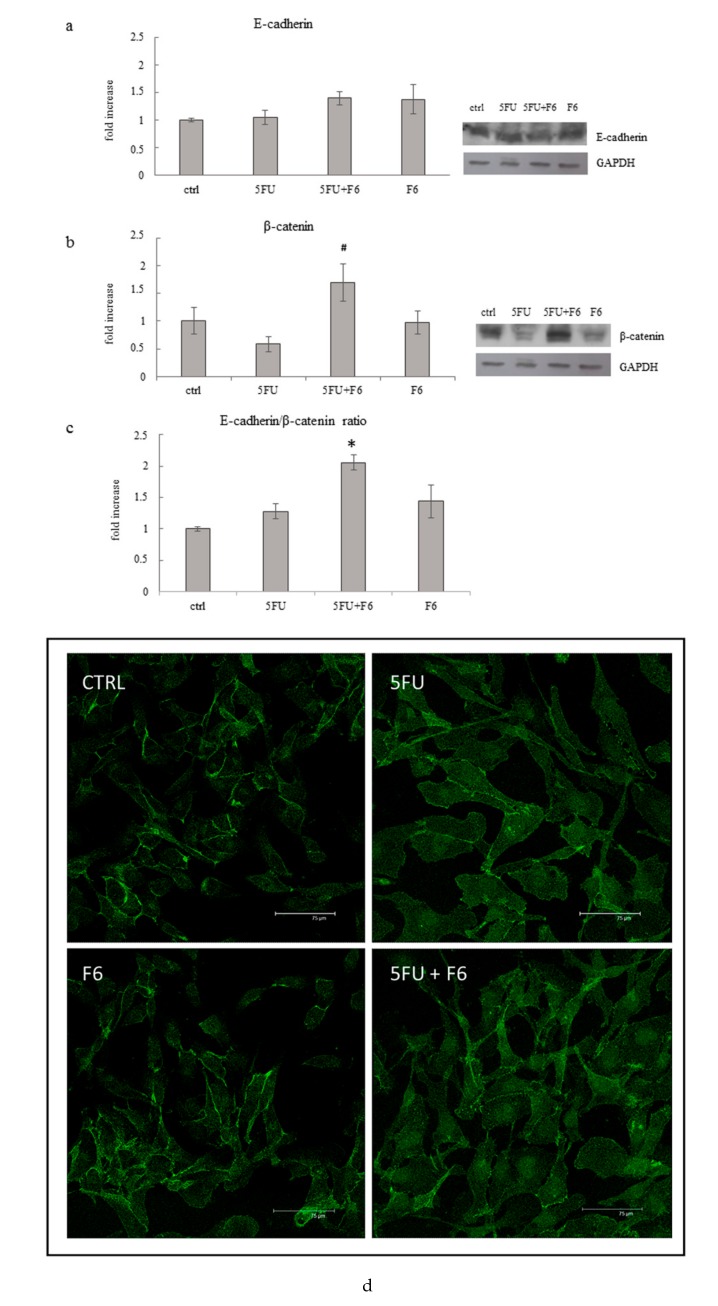
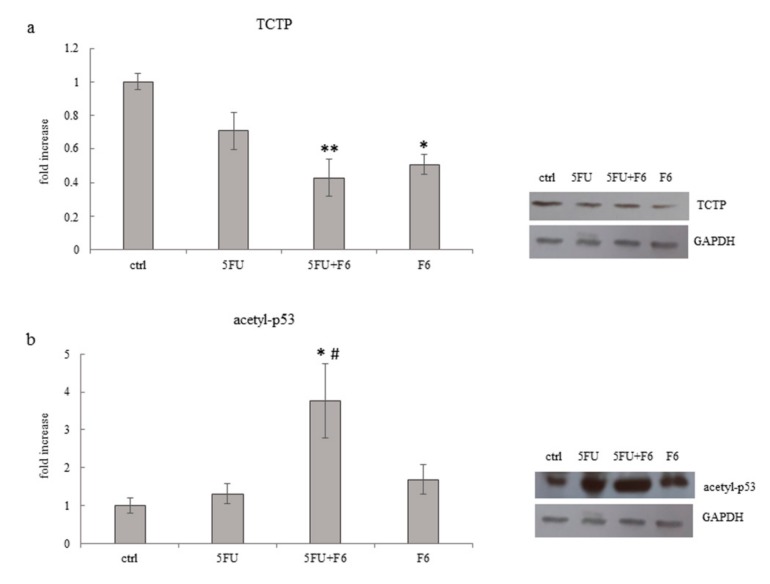
Some yet unidentified factors released by both oocyte and embryonic microenvironments demonstrated to be non-permissive for tumor development and display the remarkable ability to foster cell/tissue reprogramming, thus ultimately reversing the malignant phenotype. In the present study we observed how molecular factors extracted from Zebrafish embryos during specific developmental phases (20 somites) significantly antagonize proliferation of breast cancer cells, while reversing a number of prominent aspects of malignancy. Embryo extracts reduce cell proliferation, enhance apoptosis, and dramatically inhibit both invasiveness and migrating capabilities of cancer cells. Counteracting the invasive phenotype is a relevant issue in controlling tumor spreading and metastasis. Moreover, such effect is not limited to cancerous cells as embryo extracts were also effective in inhibiting migration and invasiveness displayed by normal breast cells undergoing epithelial-mesenchymal transition upon TGF-β1 stimulation. The reversion program involves the modulation of E-cadherin/β-catenin pathway, cytoskeleton remodeling with dramatic reduction in vinculin, as well as downregulation of TCTP and the concomitant increase in p53 levels. Our findings highlight that-contrary to the prevailing current "dogma", which posits that neoplastic cells are irreversibly "committed"-the malignant phenotype can ultimately be "reversed", at least partially, in response to environmental morphogenetic influences.
Keywords: E-cadherin/β-catenin; Embryo fish extract; TCTP; Tumor Reversion; cytoskeleton; p53.
Conflict of interest statement
The authors declare they have not conflict of interest. The authors confirm that the funders had no influence over the study design, content of the article, or selection of this journal.
Figures
Similar articles
-
miRNAs from Zebrafish Embryo Extracts Inhibit Breast Cancer Invasiveness and Migration by Modulating miR-218-5p/PI3K Pathway.Int J Mol Sci. 2025 Apr 17;26(8):3812. doi: 10.3390/ijms26083812. Int J Mol Sci. 2025. PMID: 40332412 Free PMC article.
-
Zebrafish embryo extracts enhance 5-FU anti-cancer effects upon breast cancer cells.Eur Rev Med Pharmacol Sci. 2021 Apr;25(8):3235-3245. doi: 10.26355/eurrev_202104_25732. Eur Rev Med Pharmacol Sci. 2021. PMID: 33928609
-
Translationally controlled tumor protein (TCTP) is required for TGF-β1 induced epithelial to mesenchymal transition and influences cytoskeletal reorganization.Biochim Biophys Acta Mol Cell Res. 2018 Jan;1865(1):67-75. doi: 10.1016/j.bbamcr.2017.09.014. Epub 2017 Sep 25. Biochim Biophys Acta Mol Cell Res. 2018. PMID: 28958626
-
Tumor reversion and embryo morphogenetic factors.Semin Cancer Biol. 2022 Feb;79:83-90. doi: 10.1016/j.semcancer.2020.09.005. Epub 2020 Sep 10. Semin Cancer Biol. 2022. PMID: 32920125 Review.
-
E-cadherin, beta-catenin, and ZEB1 in malignant progression of cancer.Cancer Metastasis Rev. 2009 Jun;28(1-2):151-66. doi: 10.1007/s10555-008-9179-y. Cancer Metastasis Rev. 2009. PMID: 19153669 Review.
Cited by
-
Anti-proliferative effects of mesenchymal stem cells (MSCs) derived from multiple sources on ovarian cancer cell lines: an in-vitro experimental study.J Ovarian Res. 2019 Jul 27;12(1):70. doi: 10.1186/s13048-019-0546-9. J Ovarian Res. 2019. PMID: 31351482 Free PMC article.
-
The Use of Stem Cell Differentiation Stage Factors (SCDSFs) Taken from Zebrafish Embryos during Organogenesis and Their Role in Regulating the Gene Expression of Normal and Pathological (Stem) Cells.Int J Mol Sci. 2020 Jul 12;21(14):4914. doi: 10.3390/ijms21144914. Int J Mol Sci. 2020. PMID: 32664640 Free PMC article. Review.
-
Exosomes and Cell Communication: From Tumour-Derived Exosomes and Their Role in Tumour Progression to the Use of Exosomal Cargo for Cancer Treatment.Cancers (Basel). 2021 Feb 16;13(4):822. doi: 10.3390/cancers13040822. Cancers (Basel). 2021. PMID: 33669294 Free PMC article. Review.
-
Mutation or not, what directly establishes a neoplastic state, namely cellular immortality and autonomy, still remains unknown and should be prioritized in our research.J Cancer. 2022 Jul 4;13(9):2810-2843. doi: 10.7150/jca.72628. eCollection 2022. J Cancer. 2022. PMID: 35912015 Free PMC article. Review.
-
Translationally controlled tumor protein: the mediator promoting cancer invasion and migration and its potential clinical prospects.J Zhejiang Univ Sci B. 2022 Aug 15;23(8):642-654. doi: 10.1631/jzus.B2100910. J Zhejiang Univ Sci B. 2022. PMID: 35953758 Free PMC article. Review.
References
-
- Biava P.M., Canaider S., Facchin F., Bianconi E., Ljungberg L., Rotilio D., Burigana F., Ventura C. Stem Cell Differentiation Stage Factors from Zebrafish Embryo: A Novel Strategy to Modulate the Fate of Normal and Pathological Human (Stem) Cells. Curr. Pharm. Biotechnol. 2015;16:782–792. doi: 10.2174/1389201016666150629102825. - DOI - PMC - PubMed
MeSH terms
Substances
LinkOut - more resources
Full Text Sources
Medical
Research Materials
Miscellaneous
