. 2019 May 2;24(9):1712.
doi: 10.3390/molecules24091712.

Effects of Platycodins Folium on Depression in Mice Based on a UPLC-Q/TOF-MS Serum Assay and Hippocampus Metabolomics

Affiliations

Effects of Platycodins Folium on Depression in Mice Based on a UPLC-Q/TOF-MS Serum Assay and Hippocampus Metabolomics

Cuizhu Wang et al. Molecules. .

Abstract

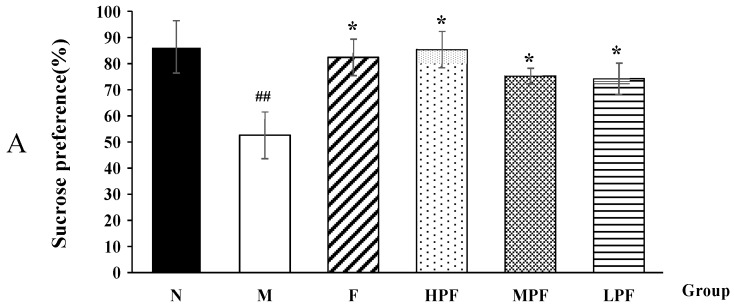
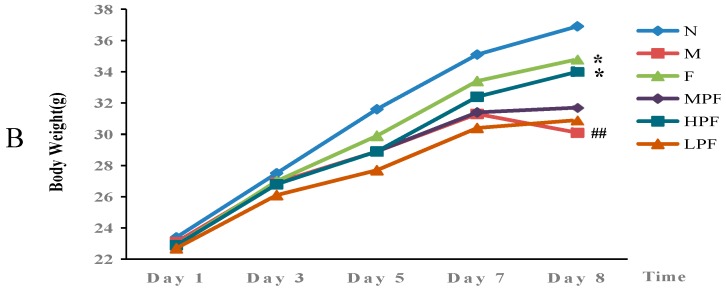
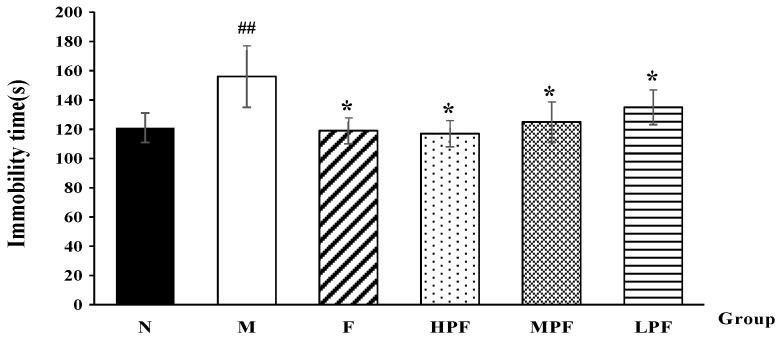
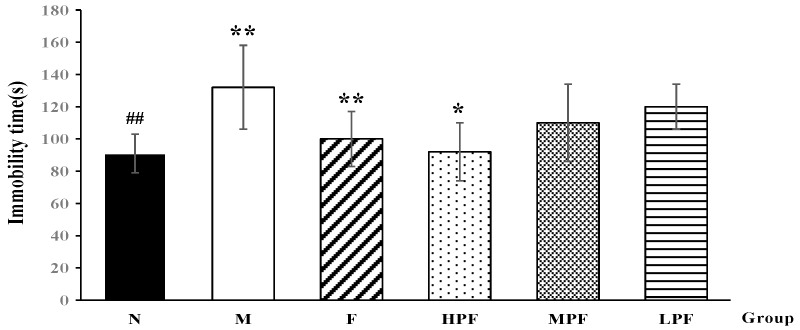
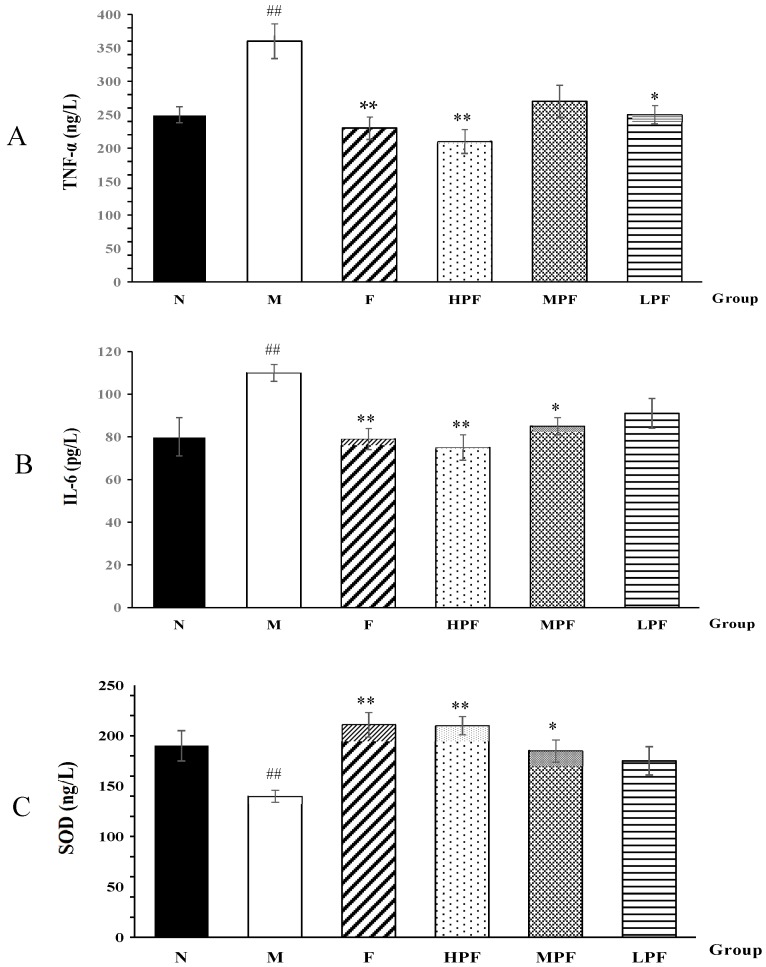
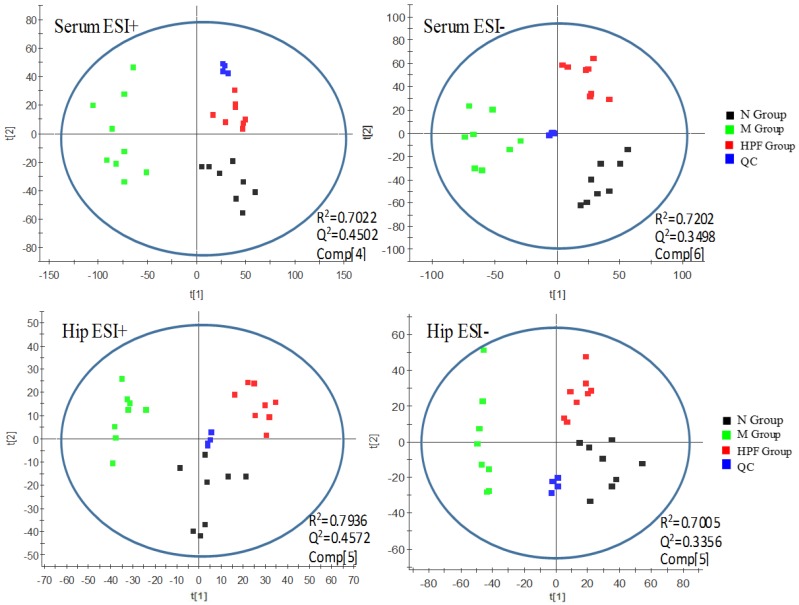
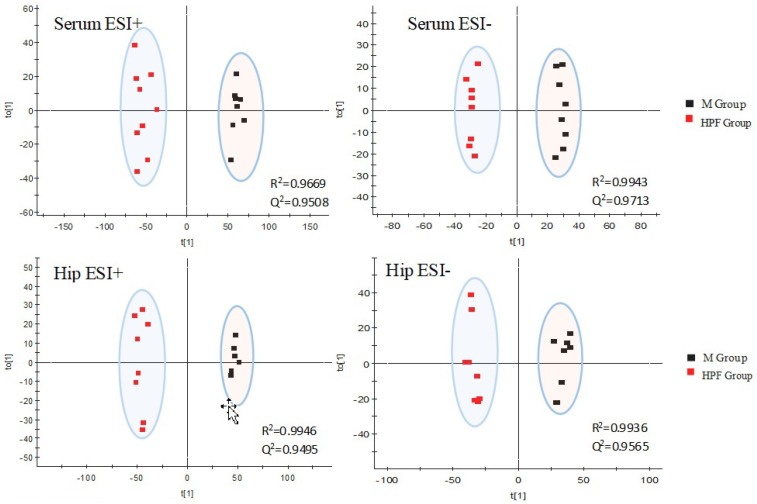
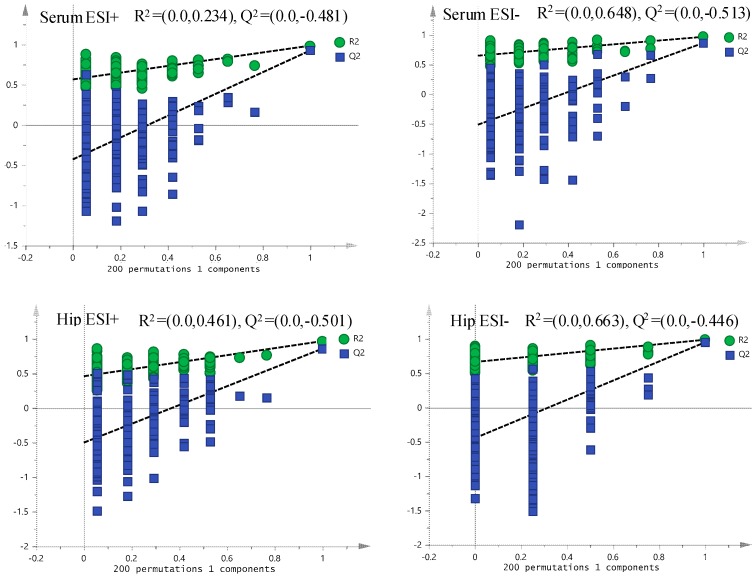
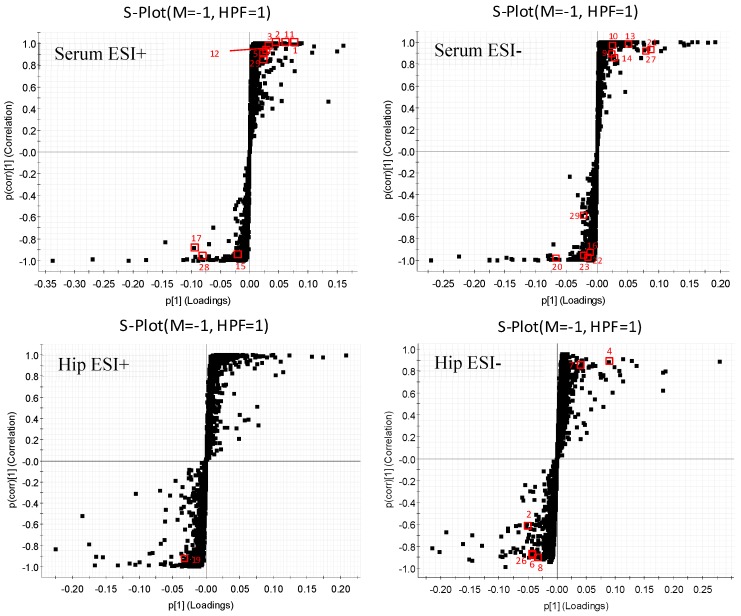
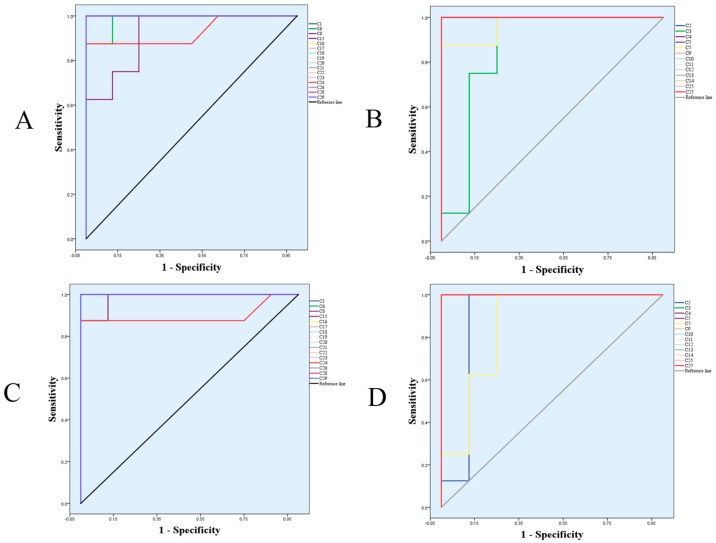
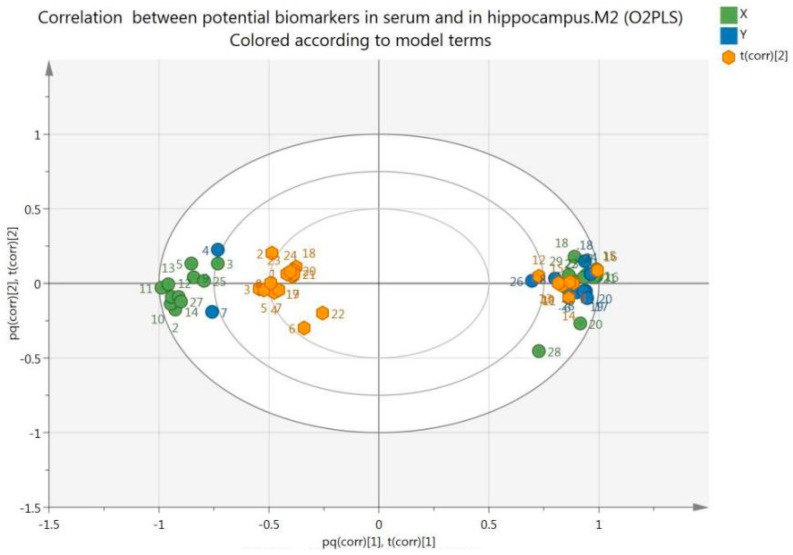
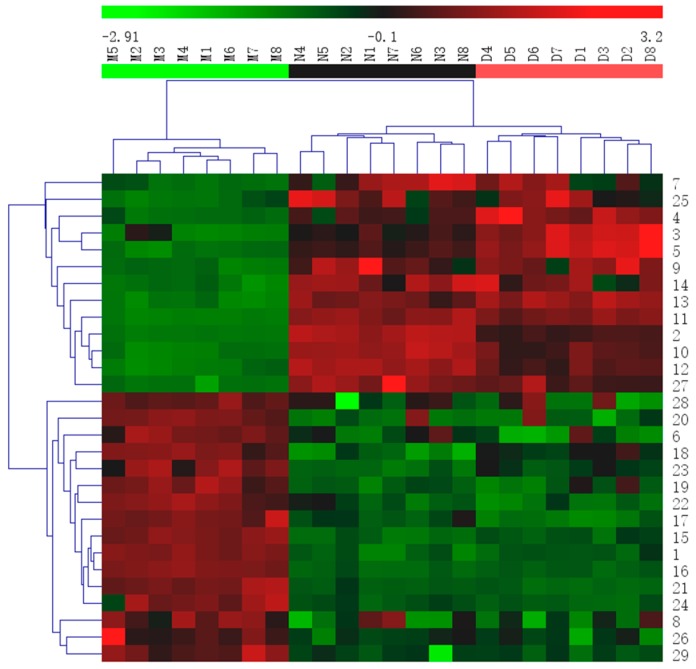
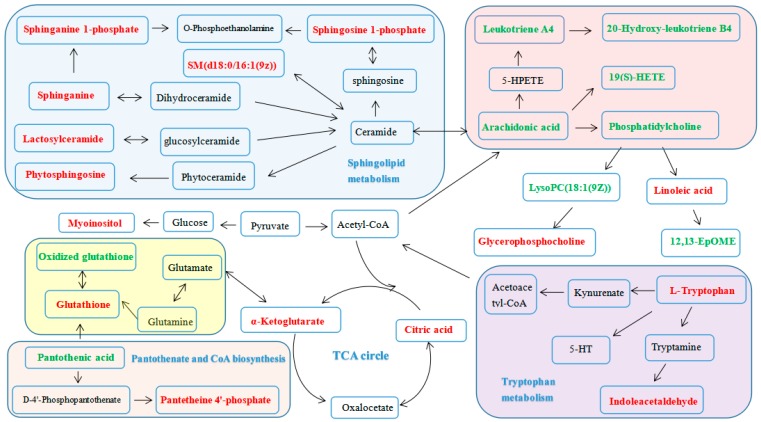
Major depressive disorder (MDD), also known as depression, is a state characterized by low mood and aversion to activity. Platycodins Folium (PF) is the dried leaf of Platycodon grandiflorum, with anti-inflammatory and antioxidative activities. Our previous research suggested that PF was rich in flavonoids, phenols, organic acids, triterpenoid saponins, coumarins and terpenoids. This study aimed to investigate the antidepressant effect of PF using lipopolysaccharide (LPS)-induced depressive mice. Several behavior tests (sucrose preference test (SPT), forced swimming test (FST) and tail suspension test (TST)) and biochemical parameters (IL-6, TNF-α and SOD levels) were used to evaluate the antidepressive effect of PF on LPS-induced depression model. Furthermore, a UPLC-Q/TOF-MS-based metabolomics approach was applied to explore the latent mechanism of PF in attenuating depression. As a result, a total of 21 and 11 metabolites that potentially contribute to MDD progress and PF treatment were identified in serum and hippocampus, respectively. The analysis of metabolic pathways revealed that lipid metabolism, amino acid metabolism, energy metabolism, arachidonic acid metabolism, glutathione metabolism and inositol phosphate metabolism were disturbed in a model of mice undergoing MDD and PF treatment. These results help us to understand the pathogenesis of depression in depth, and to discover targets for clinical diagnosis and treatment. They also provide the possibility of developing PF into an anti-depressantive agent.

Keywords: LPS-induced depression; Platycodins Folium; UPLC-Q/TOF-MS; metabolomics.


Conflict of interest statement

The authors declare that they have no conflict of interest concerning this article.

Figures

Figure 1
Figure 1
Effects of PF on the SPT (A) and BW (B) in mice. (compared with the normal control group, ## p < 0.01; compared with the LPS-induced model group, * p < 0.05).
Figure 1
Figure 1
Effects of PF on the SPT (A) and BW (B) in mice. (compared with the normal control group, ## p < 0.01; compared with the LPS-induced model group, * p < 0.05).
Figure 2
Figure 2
Effects of PF on the immobility time in FST (compared with the normal control group, ## p < 0.01; compared with the LPS-induced model group, * p < 0.05).
Figure 3
Figure 3
Effects of PF on the immobility time in FST (compared with the normal control group, ## p < 0.01; compared with the LPS-induced model group, * p < 0.05, ** p < 0.01).
Figure 4
Figure 4
Effects of PF on TNF-α (A), IL-6 (B) and SOD (C) activity (compared with normal control group, ## p < 0.01; compared with the LPS-induced model group, * p < 0.05, ** p < 0.01).
Figure 5
Figure 5
PCA score plots of serum and hippocampus metabolic profiling of the N, M, HPF groups.
Figure 6
Figure 6
OPLS-DA score plots of serum and hippocampus metabolic profiling of the M and HPF group.
Figure 7
Figure 7
The permutations plots of the OPLS-DA models of serum and the hippocampus.
Figure 8
Figure 8
OPLS-DA S-plots of serum and hippocampus metabolic profiling. (Numbers marked are consistent with the No. of each biomarker in Table 1).
Figure 9
Figure 9
The predictive ROC curves generated using 29 biomarkers contributing to MDD progress and PF treatment. (A) CM > CN; (B) CM < CN; (C) CM > CHPF; (D) CM < CHPF. The numbers are consistent with the No. in Table 1.
Figure 10
Figure 10
Bi-plot of biomarkers observed in serum (S, green spots) and hippocampus (H, blue spots).
Figure 11
Figure 11
Heatmap of all potential biomarkers. The color indicates the relative abundance of the biomarkers. Green, lowest; red, highest. Rows indicate potential biomarkers, and columns indicate samples. The numbers marked are consistent with the No. of each biomarker in Table 1.
Figure 12
Figure 12
The metabolic pathways of serum and the hippocampus. (Red labeled metabolites: potential biomarkers with increased levels in the HPF group, compared to the M group. Green labeled metabolites: potential biomarkers with decreased levels in the HPF group, compared to those of the M group).

References

    1. Du H.L., Zhao H.X., Lai X.L., Lin Q.S., Zhu Z.Y., Chai Y.F., Lou Z.Y. Metabolic profiles revealed synergistically antidepressant effects of lilies and Rhizoma Anemarrhenae in a rat model of depression. Biomed. Chromatogr. 2016;31:487–493. doi: 10.1002/bmc.3923. - DOI - PubMed
    1. Dhingra D., Bhankher A. Behavioral and biochemical evidences for antidepressant-like activity of palmatine in mice subjected to chronic unpredictable mild stress. Pharmacol. Rep. 2014;66:1–9. doi: 10.1016/j.pharep.2013.06.001. - DOI - PubMed
    1. Müller N., Myint A.M., Schwarz M.J. Inflammatory biomarkers and depression. Neurotox. Res. 2011;19:308–318. doi: 10.1007/s12640-010-9210-2. - DOI - PubMed
    1. Duman R.S., Voleti B. Signaling pathways underlying the pathophysiology and treatment of depression: Novel mechanisms for rapid-acting agents. Trends Neurosci. 2012;35:47–56. doi: 10.1016/j.tins.2011.11.004. - DOI - PMC - PubMed
    1. Khurana R.N., Baudendistel T.E. Hypertensive crisis associated with venlafaxine. Am. J. Med. 2003;115:676–677. doi: 10.1016/S0002-9343(03)00472-8. - DOI - PubMed

MeSH terms