. 2019 May 21;116(10):1931-1940.
doi: 10.1016/j.bpj.2019.04.002. Epub 2019 Apr 9.

Structure and Dynamics of the Central Lipid Pool and Proteins of the Bacterial Holo-Translocon

Affiliations

Structure and Dynamics of the Central Lipid Pool and Proteins of the Bacterial Holo-Translocon

Remy Martin et al. Biophys J. .

Abstract

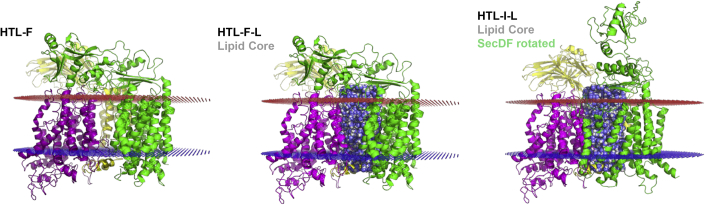
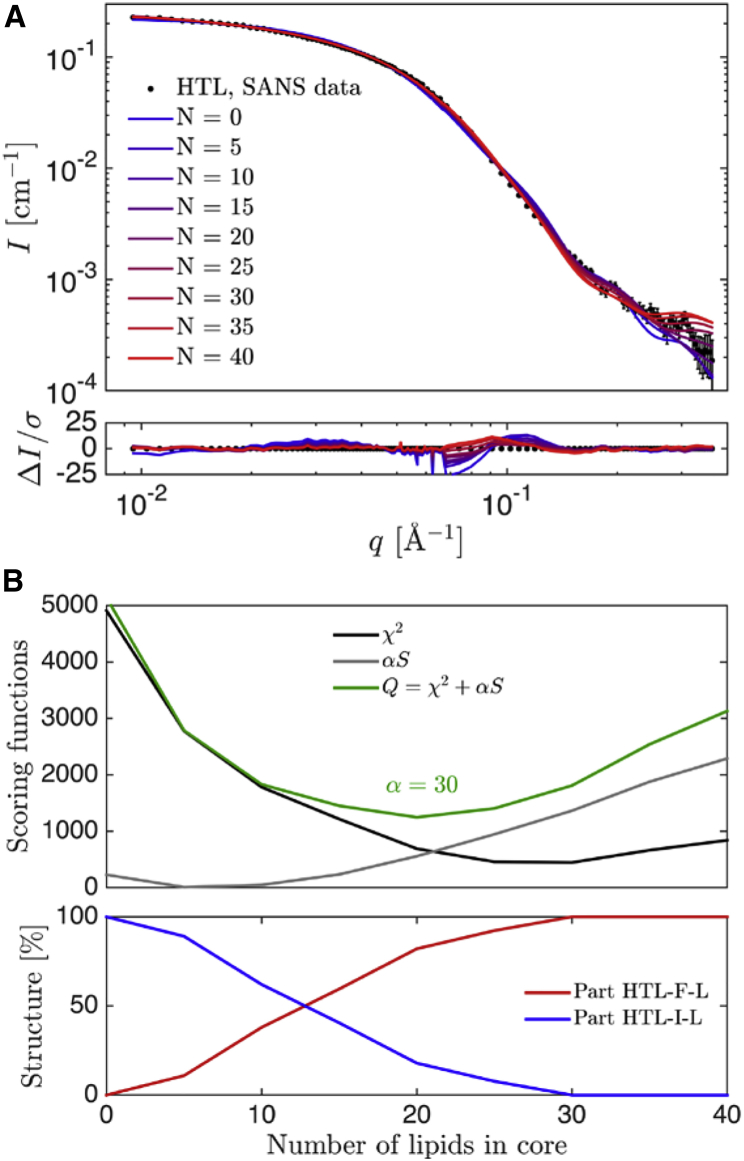
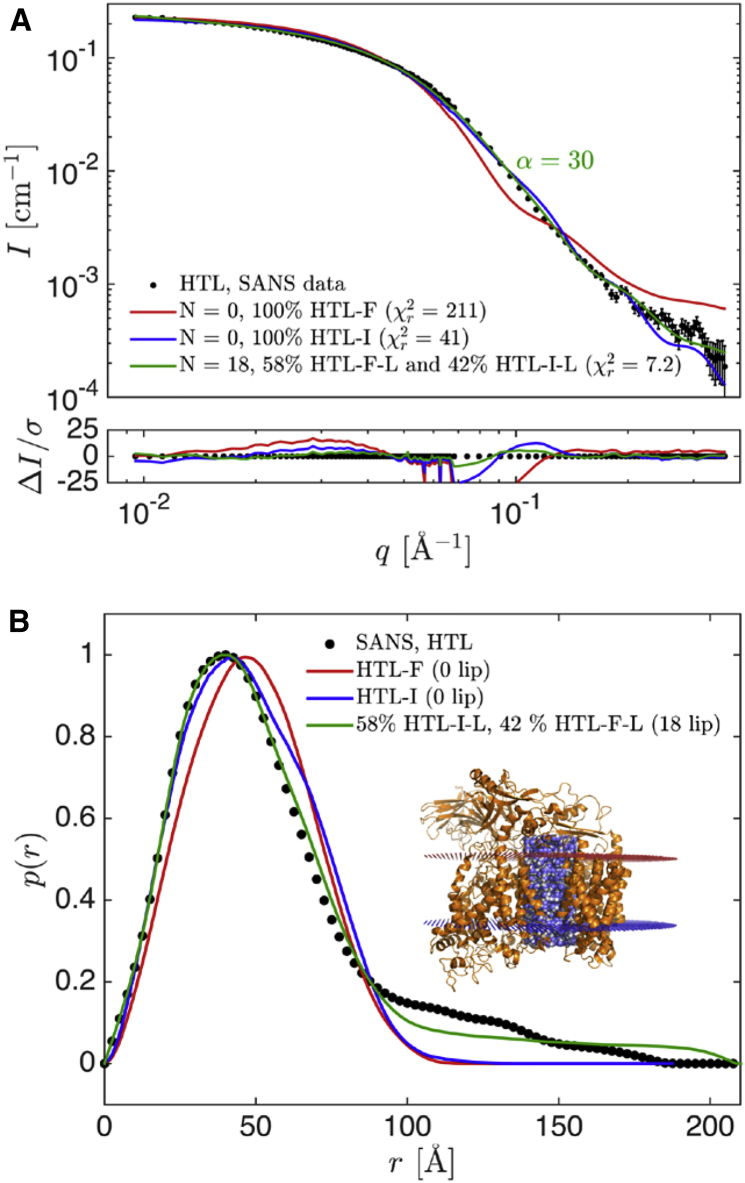
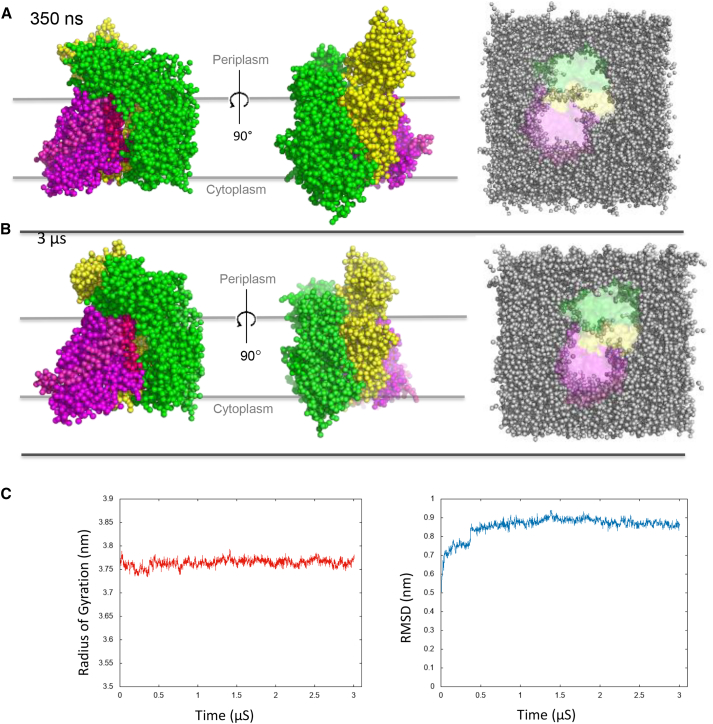
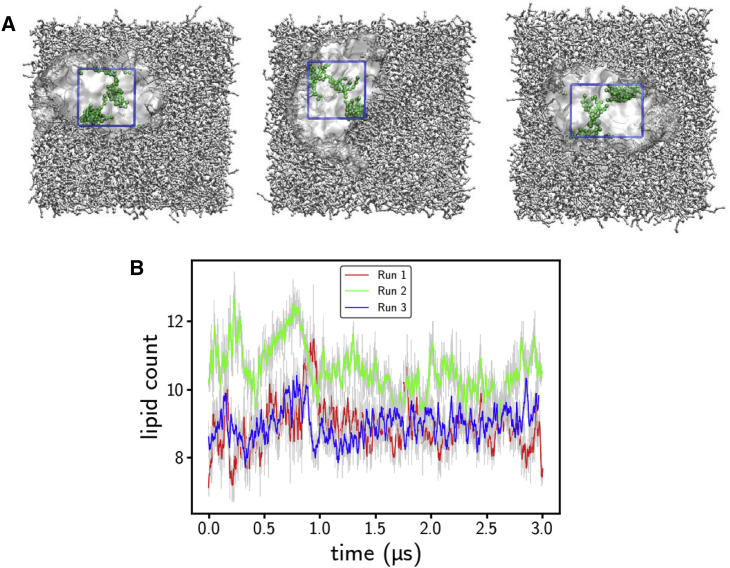
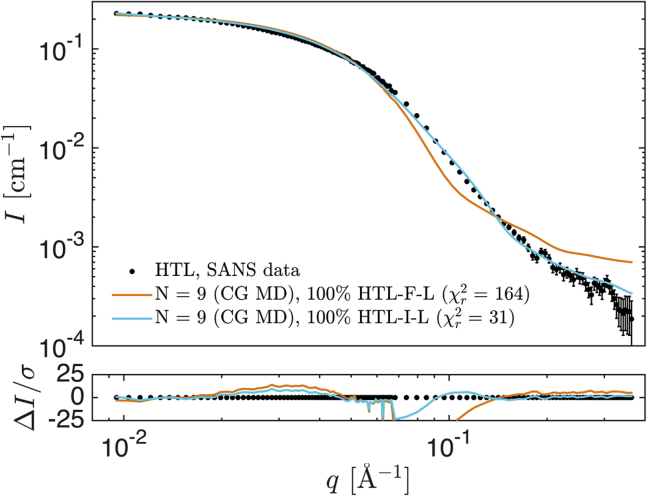
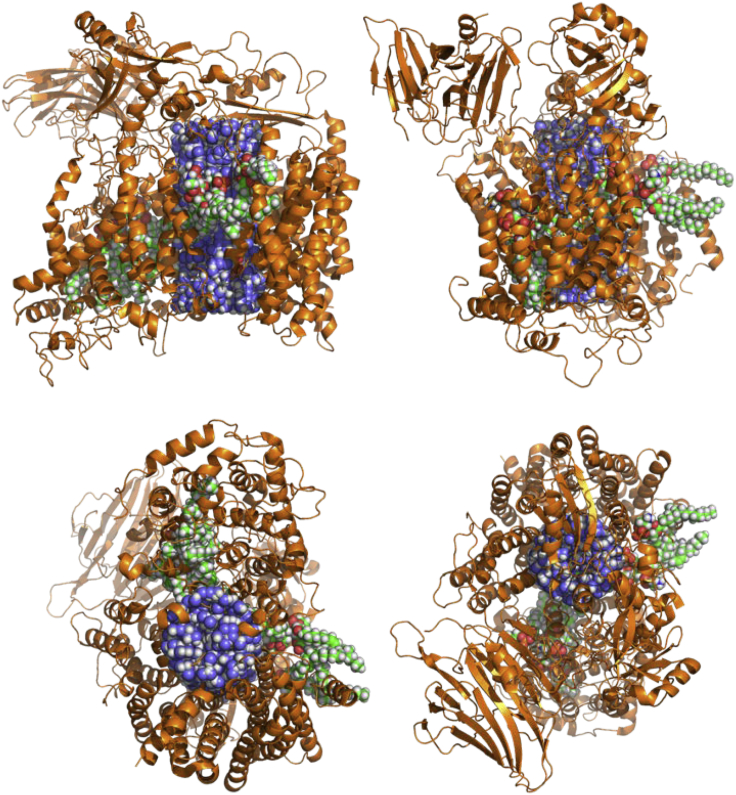
The bacterial Sec translocon, SecYEG, associates with accessory proteins YidC and the SecDF-YajC subcomplex to form the bacterial holo-translocon (HTL). The HTL is a dynamic and flexible protein transport machine capable of coordinating protein secretion across the membrane and efficient lateral insertion of nascent membrane proteins. It has been hypothesized that a central lipid core facilitates the controlled passage of membrane proteins into the bilayer, ensuring the efficient formation of their native state. By performing small-angle neutron scattering on protein solubilized in "match-out" deuterated detergent, we have been able to interrogate a "naked" HTL complex, with the scattering contribution of the surrounding detergent micelle rendered invisible. Such an approach has allowed the confirmation of a lipid core within the HTL, which accommodates between 8 and 29 lipids. Coarse-grained molecular dynamics simulations of the HTL also demonstrate a dynamic, central pool of lipids. An opening at this lipid-rich region between YidC and the SecY lateral gate may provide an exit gateway for newly synthesized, correctly oriented, membrane protein helices, or even small bundles of helices, to emerge from the HTL.


Figures

Figure 1
Figure 1
Atomistic models of HTL with and without a lipidic core positioned “by hand.” Three HTL structures are used to fit the experimental SANS data. HTL-F is the starting structure (HTL with SecDF in the F-form) and is based on the electron microscopy-fitted structure from Botte et al. (12). SecYEG is shown in magenta, SecDF in green and YidC in yellow. HTL-F-L is the same protein arrangement with the addition of a lipid core. HTL-I-L is the same structure as HTL-F-L (i.e., containing lipids) but has had the SecDF P1 domain rotated (HTL with SecDF in the I-form). Lipid bilayer planes are marked in red (periplasmic side) and blue (cytoplasmic side). To see this figure in color, go online.
Figure 2
Figure 2
Model fitting of theoretical scattering to experimental SANS data of HTL in d-DDM. (A) Shown is the theoretical scattering of a linear combination of model HTL-F-L and HTL-I-L in which the number of central lipids, N, is varied from 0 to 40 (red and blue), plotted against experimental HTL data (black dots). (B) The upper panel shows χ2, αS and Q (see text) for the fits, and the lower panel shows the amount of HTL-F-L and HTL-I-L in the fits. To see this figure in color, go online.
Figure 3
Figure 3
Experimental SANS data of HTL in DDM, fits to data, and pair distance distribution functions p(r) for data and models. (A) Shown is a fit to data with HTL-F (no lipids) in red and HTL-I (no lipids) in blue and the most probable fit in green for α = 30 (see text), with 18 lipids in the core, 58% in the HTL-F-L form and 42% in the HTL-I-L form, and with ∼1% of the total protein being aggregated. (B) Shown is the p(r) plot of data and models with the same colors. Inset shows the HTL-F-L in cartoon representation (orange) with a lipid core representative of 18 lipids (blue and white). Lipid bilayer planes are marked in red (periplasmic side) and blue (cytoplasmic side). To see this figure in color, go online.
Figure 4
Figure 4
Coarse-grained HTL model, pre- and post-simulation. Shown is the coarse-grained HTL after 350 ns and 3 μs simulation. (A) HTL is shown after 350 ns simulation, viewed transversely through the membrane from two orientations and from cytoplasmic face, showing the lipid arrangement within the complex. SecYEG is shown in magenta, with SecDF in green and YidC in yellow. (B) The same thing is shown as previous, but after 3 μs of simulation. (C) Graphs show the stability of the structure over 3μs, both from the radius of gyration (left) and root mean-square deviation (right). To see this figure in color, go online.
Figure 5
Figure 5
Localization and number of lipids within the HTL during MD. The localization of the lipids within the HTL during simulations is shown. (A) Shown are the shots of three independent CG simulations of HTL in a mixed lipid bilayer. In each image, the lipids present in the center after a 3 μs simulation are highlighted green. A boundary box was created for each simulation, and the lipid presence within the area was quantified. (B) Graph shows the number of lipids within the core of the HTL, as defined by the boundary box, over the course of the simulation time. To see this figure in color, go online.
Figure 6
Figure 6
Model fit of HTL with postsimulated lipids to experimental SANS data. Experimental HTL SANS data (black dots) fitted with the HTL-F-L (orange) or HTL-I-L (cyan) structure, in each case with the nine lipids from the CG MD simulation. To see this figure in color, go online.
Figure 7
Figure 7
Atomistic comparison of HTL with positioned lipids positioned “by hand” or as simulated. The HTL complex (PDB: 5MG3, orange) with two different models for the lipid core is shown. The simple bilayer model was used to fit the SANS data (blue/white, corresponding to 18 lipids) and the monolayer of lipids from the CG MD simulations (red/green/white, nine lipids). Shown as orthogonal views, perpendicular to the plane of the membrane (top), and planar membrane views from the cytoplasm (bottom left) and periplasmic (bottom right). To see this figure in color, go online.

References

    1. Brundage L., Hendrick J.P., Wickner W. The purified E. coli integral membrane protein SecY/E is sufficient for reconstitution of SecA-dependent precursor protein translocation. Cell. 1990;62:649–657. - PubMed
    1. Görlich D., Rapoport T.A. Protein translocation into proteoliposomes reconstituted from purified components of the endoplasmic reticulum membrane. Cell. 1993;75:615–630. - PubMed
    1. Rapoport T.A., Li L., Park E. Structural and Mechanistic Insights into Protein Translocation. Annu. Rev. Cell Dev. Biol. 2017;33:369–390. - PubMed
    1. Cranford-Smith T., Huber D. The way is the goal: how SecA transports proteins across the cytoplasmic membrane in bacteria. FEMS Microbiol. Lett. 2018;365 - PMC - PubMed
    1. Pfeffer S., Burbaum L., Förster F. Structure of the native Sec61 protein-conducting channel. Nat. Commun. 2015;6:8403. - PMC - PubMed

Publication types

MeSH terms

Substances

LinkOut - more resources