. 2019 May 21;116(10):2009-2022.
doi: 10.1016/j.bpj.2019.04.012. Epub 2019 Apr 22.

Transmission of Mechanical Information by Purinergic Signaling

Affiliations

Transmission of Mechanical Information by Purinergic Signaling

Nicholas Mikolajewicz et al. Biophys J. .

Abstract

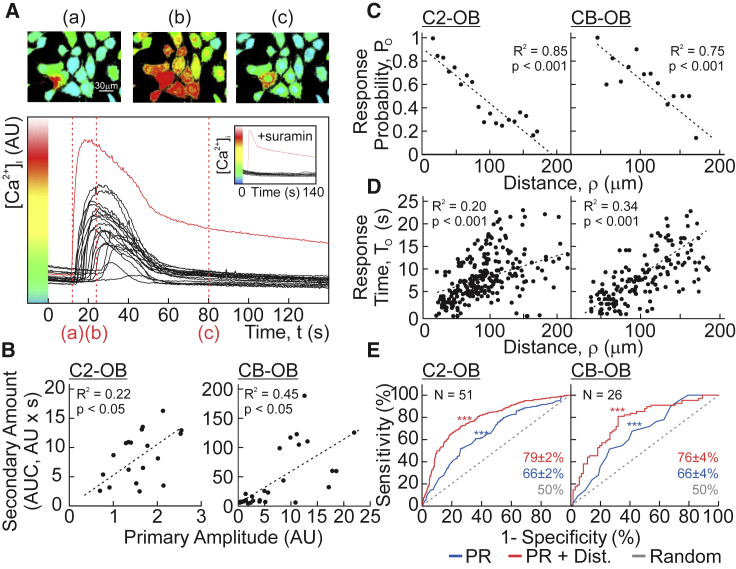
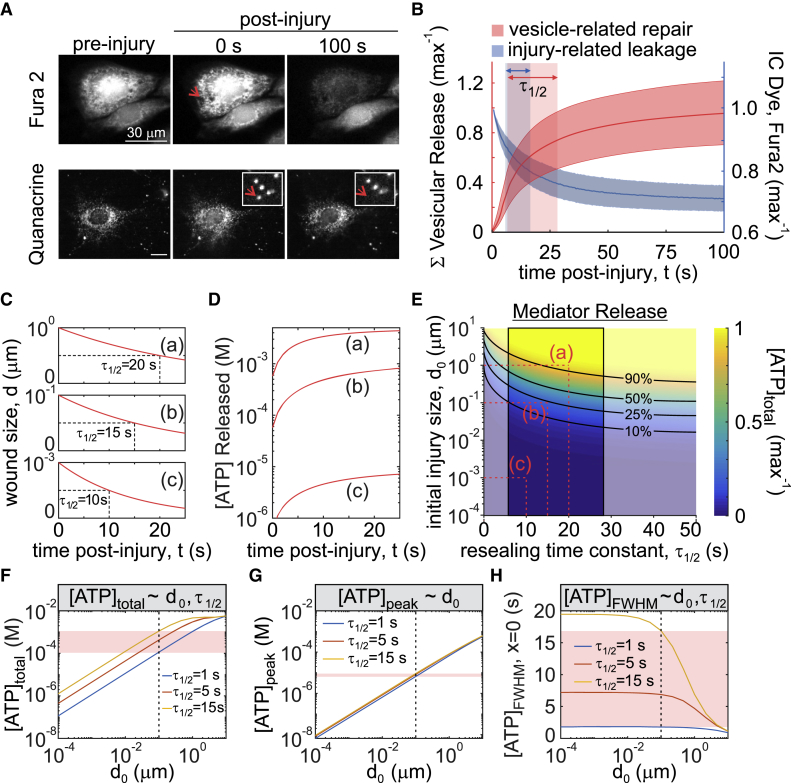
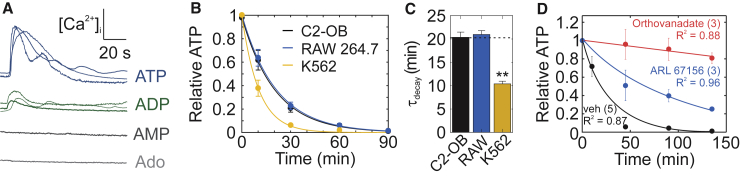
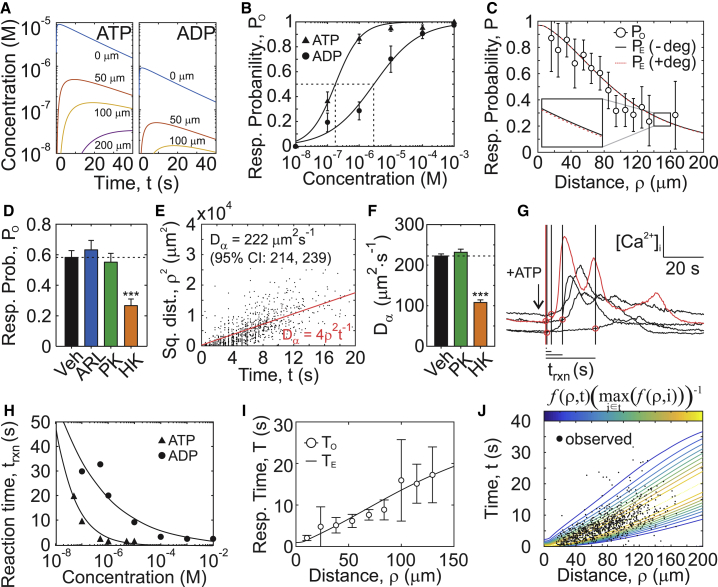
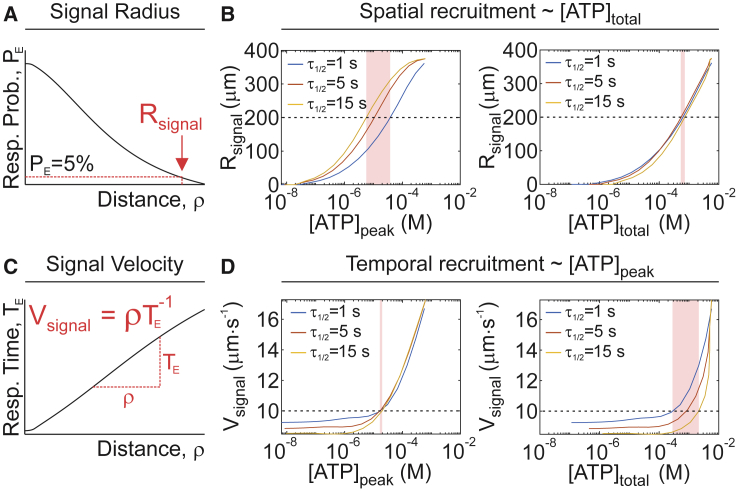
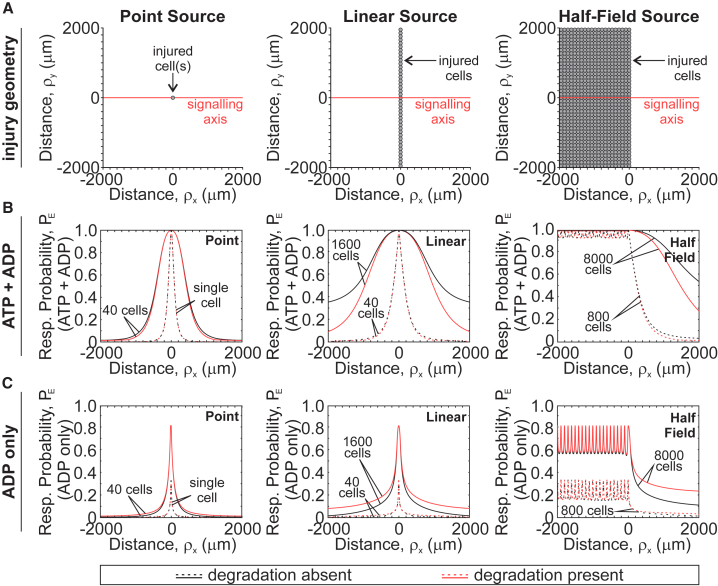
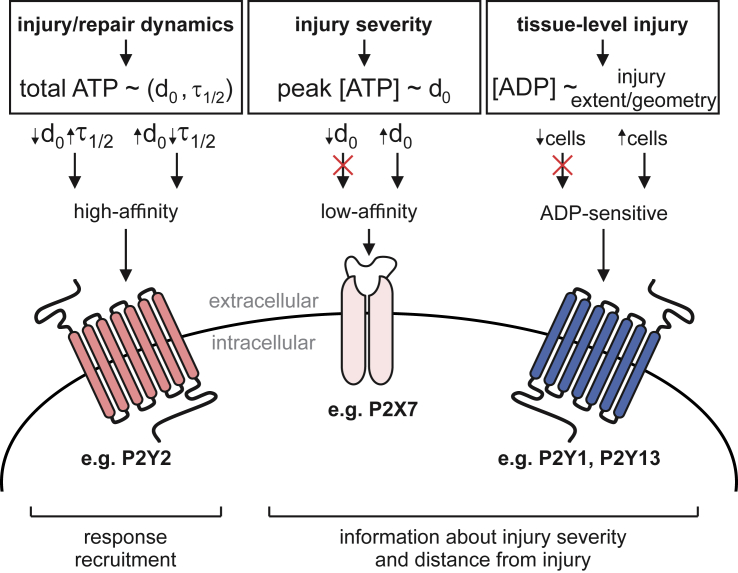
The skeleton constantly interacts and adapts to the physical world. We have previously reported that physiologically relevant mechanical forces lead to small repairable membrane injuries in bone-forming osteoblasts, resulting in release of ATP and stimulation of purinergic (P2) calcium responses in neighboring cells. The goal of this study was to develop a theoretical model describing injury-related ATP and ADP release, their extracellular diffusion and degradation, and purinergic responses in neighboring cells. After validation using experimental data for intracellular free calcium elevations, ATP, and vesicular release after mechanical stimulation of a single osteoblast, the model was scaled to a tissue-level injury to investigate how purinergic signaling communicates information about injuries with varying geometries. We found that total ATP released, peak extracellular ATP concentration, and the ADP-mediated signaling component contributed complementary information regarding the mechanical stimulation event. The total amount of ATP released governed spatial factors, such as the maximal distance from the injury at which purinergic responses were stimulated. The peak ATP concentration reflected the severity of an individual cell injury, allowing to discriminate between minor and severe injuries that released similar amounts of ATP because of differences in injury repair, and determined temporal aspects of the response, such as signal propagation velocity. ADP-mediated signaling became relevant only in larger tissue-level injuries, conveying information about the distance to the injury site and its geometry. Thus, we identified specific features of extracellular ATP and ADP spatiotemporal signals that depend on tissue mechanoresilience and encode the severity, scope, and proximity of the mechanical stimulus.


Figures

Figure 1
Figure 1
Mechanically induced purinergic signaling conveys the magnitude and distance to stimulus. (A) A single Fura2-loaded C2-OB was mechanically stimulated by micropipette, and [Ca2+]i was recorded. Top shows pseudocolored 340/380 Fura2 ratio images. Bottom shows [Ca2+]i recording of mechanically stimulated (primary) cell (red) and neighboring (secondary) responders (black). Red dashed lines show time points in top panel. Inset shows experiment performed in presence of P2 receptor antagonist suramin (100 μM). (B) Correlation between the primary response amplitude and area under curve of secondary [Ca2+]i elevations is shown for C2-OBs (left) and CB-OBs (right). (C and D) Correlation between distance from primary cell and observed response probability PO of neighboring cells (C) and observed response time TO after mechanical stimulation (D) is shown for C2-OBs (left) and CB-OBs (right). Black dashed lines show linear regressions. (E) Receiver operating characteristic curves demonstrate the performance of the logistic regression model in predicting incidence of secondary responses based on primary response parameters (blue), primary response parameters and distance (dist., red), or chance alone (gray) for C2-OBs (left) and CB-OBs (right). Accuracies of logistic models ± SEM are shown; N indicates number of trials. To see this figure in color, go online.
Figure 2
Figure 2
The size and resealing kinetics of the membrane injury determine the kinetics of ATP release. (A and B) A single Fura2- (A, top) or quinacrine- (A, bottom) loaded C2-OB was mechanically stimulated by a micropipette, and the time course of intracellular Fura2 decrease (B, blue, n = 51) and cumulative vesicular release (B, red, n = 15) was recorded. Data are means ± 95% confidence intervals (CIs). Shaded boxes show 95% CI of time to half max (τ1/2) for Fura2 leakage (blue) or vesicular release (red). (C and D) Simulated temporal changes in injury size d(t) (C) and ATP release (D) are shown for indicated initial injury size d0 and the characteristic membrane repair times τ1/2. (E) Solution space for injury-related ATP release with respect to changes in initial injury size d0 and the characteristic membrane repair time τ1/2 are shown. Black lines show isoclines for parameter pairs that yield equal percentage of total ATP release. Red dashed lines show parameter pairs (a, b, c) used in (C) and (D). The outlined region shows experimentally measured τ1/2. (FH) Relationship between initial injury size d0 and total ATP released [ATP]total (F), peak extracellular ATP concentration [ATP]peak (G), and full-width half maximum (FWHM) duration of extracellular ATP concentration [ATP]FWHM at the source (H) are shown for τ1/2 = 1, 5, 15 s. Red bands show sensitivity of ATP release parameters to changes in τ1/2 for d0 = 100 nm (dashed black line). To see this figure in color, go online.
Figure 3
Figure 3
Contribution of ADP to the mechanically stimulated purinergic signal. (A) Representative [Ca2+]i elevations in Fura2-loaded C2-OBs stimulated by 1 μM ATP, 1 μM ADP, 10 μM AMP, or 10 μM adenosine (Ado) are shown. (B and C) 1 μM ATP was added to cultures of C2-OB osteoblasts, RAW 264.7 osteoclast precursors, and K562 erythrocyte-like cells; ATP degradation was measured (B); and decay time constants τdecay were estimated (C), data are means ± SEM, n = 3 per time point per cell type. (D) Degradation of 1 μM ATP by C2-OBs in the presence of the ectonucleotidase inhibitor ARL 67156 (10 μM) or the alkaline-phosphatase inhibitor orthovanadate (10 μM) is shown, data are means ± SEM, the sample sizes are shown in parentheses. For (B)–(D), solid curves show fitted exponential functions (Table S1). To see this figure in color, go online.
Figure 4
Figure 4
Modeling diffusion and purinergic reaction times to predict the spatial and temporal distribution of secondary responses. (A) ATP and ADP release and diffusion were numerically simulated after mechanical injury of a single cell (d0 = 100 nm, τ1/2 = 15 s, kATP = 0, Eqs. 5 and 6). (B) Dose dependence of ATP and ADP response probabilities are shown. Means ± SEM, n = 6–8. Fitted curves show Hill functions (Table S1). (C) Expected response probabilities PE after mechanical stimulation of a single cell in the presence (+deg; kATP = 0.05 min−1) or absence (−deg; kATP = 0 min−1) of extracellular ATP degradation compared to observed response probabilities PO (means ± SEM, n = 51) are shown. (D) Observed response probabilities PO after micropipette stimulation of C2-OB cell in the presence of vehicle 10 μM ARL 67156 (ARL), 0.1 U/mL pyruvate kinase + 100 μM PEP (PK), or 0.1 U/mL hexokinase (HK). Means ± SEM, ∗∗∗p < 0.001 by ANOVA. (E) The relationship between observed secondary response times TO and the squared distance from the source is shown. Red line shows the apparent diffusion coefficient Dα estimated by linear regression. (F) Dα in presence of vehicle, PK, or HK. Means ± SEM, n = 10–15, ∗∗∗p < 0.001 assessed by ANOVA. (G) [Ca2+]i traces demonstrating reaction times for ATP-stimulated responses (1 μM) are shown. The first discernable response is indicated in red; black lines/red circles: reaction times trxn. (H) ATP and ADP dose dependences for trxn are shown. Black lines show fitted exponential functions (Table S1). (I) A comparison of expected TE and observed TO (means ± SEM, n = 51) secondary response times is shown. (J) A spatiotemporal map of secondary responses represented as probability density function f (Eq. 13) overlaid with observed raw data is shown. To see this figure in color, go online.
Figure 5
Figure 5
Relationship between ATP release and spatial and temporal recruitment of [Ca2+]i responses. (A) Schematic of signaling radius (Rsignal). (B) The relationship between ATP release parameters [ATP]peak and [ATP]total and spatial recruitment parameter Rsignal is shown for τ1/2 = 1, 5, 15 s. (C) A schematic of signal velocity (Vsignal) is shown. (D) The relationship between ATP release parameters [ATP]peak or [ATP]total and temporal recruitment parameter Vsignal is shown for τ1/2 = 1, 5, 15 s. For (B) and (D), shaded bands show the sensitivity of ATP release parameters to changes in τ1/2 for a given level of spatial (Rsignal = 200 μm, B) or temporal (Vsignal = 10 μm s−1, D) recruitment. To see this figure in color, go online.
Figure 6
Figure 6
Paracrine purinergic signaling after tissue-level injury. ATP and ADP release and diffusion from point (left), linear (middle), and half-field (right) source injuries (A) were numerically simulated, and contributions of ATP and ADP (B) or ADP alone (C) to expected response probabilities PE were determined for varying number of injured cells in the presence (red) or absence (black) of extracellular ATP and ADP degradation. Simulation parameters: kATP = 0 (degradation absent) or 0.05 min−1 (degradation present), kADP = 0.25kATP, d0 = 100 nm, τ1/2 = 15 s. To see this figure in color, go online.
Figure 7
Figure 7
Proposed model of mechanical information decoding by the P2 receptor network. Left: single-cell membrane injury (d0) and repair (τ1/2) dynamics regulate the total amount of ATP released and the extent of recruitment of neighboring cells (i.e., spatial recruitment) through high-affinity P2 receptors. Middle: severity of injury (d0) is conveyed to neighboring cells through peak extracellular ATP concentrations that influence the timing of responses (i.e., temporal recruitment) and low-affinity P2 receptor signaling. Right: extent and geometry of tissue-level injury determine the amount of ADP released and produced by ATP degradation and thus stimulation of ADP-sensitive P2 receptors. To see this figure in color, go online.

References

    1. Jo H., Shin J.H. Special issue on mechanobiology and diseases. Biomed. Eng. Lett. 2015;5:159–161.
    1. Kohrt W.M., Barry D.W., Schwartz R.S. Muscle forces or gravity: what predominates mechanical loading on bone? Med. Sci. Sports Exerc. 2009;41:2050–2055. - PMC - PubMed
    1. Turner C.H. Three rules for bone adaptation to mechanical stimuli. Bone. 1998;23:399–407. - PubMed
    1. Carter D.R., Beaupré G.S. Cambridge University Press; Cambridge, UK: 2007. Skeletal Function and Form: Mechanobiology of Skeletal Development, Aging, and Regeneration.
    1. Skerry T.M. One mechanostat or many? Modifications of the site-specific response of bone to mechanical loading by nature and nurture. J. Musculoskelet. Neuronal Interact. 2006;6:122–127. - PubMed

Publication types

Grants and funding

LinkOut - more resources