. 2019 May 14;3(9):1406-1415.
doi: 10.1182/bloodadvances.2018023960.

Generation of transgenic zebrafish with 2 populations of RFP- and GFP-labeled thrombocytes: analysis of their lipids

Affiliations

Generation of transgenic zebrafish with 2 populations of RFP- and GFP-labeled thrombocytes: analysis of their lipids

Weam Fallatah et al. Blood Adv. .

Abstract

Zebrafish thrombocytes are similar to mammalian platelets. Mammals have young platelets (also called reticulated platelets) and mature platelets. Likewise, zebrafish have 2 populations of thrombocytes; one is DiI-C18 (DiI)+ (DP), and the other is DiI- (DN). However, the mechanism of selective thrombocyte labeling by DiI is unknown. Furthermore, there is no transgenic zebrafish line where DP and DN thrombocytes are differentially labeled with fluorescent proteins. In this study, we found that Glo fish, in which the myosin light chain 2 promoter drives the rfp gene, have a population of thrombocytes that are red fluorescent protein (RFP) labeled. We also generated transgenic GloFli fish in which DP and DN thrombocytes are labeled with RFP and green fluorescent protein (GFP), respectively. Single-cell lipid analysis showed a twofold increase in phosphatidylethanolamine (PE) and a twofold decrease in phosphatidylcholine (PC) in RFP+ thrombocytes compared with GFP+ thrombocytes, suggesting that lipid composition may be important for DiI differential labeling. Therefore, we tested liposomes prepared with different ratios of PC and PE and observed that liposomes prepared with higher amounts of PE favor DiI labeling, whereas the PC concentration had a modest effect. In liposomes prepared using only PE or PC, increased concentrations of PE resulted in increased DiI binding. These results suggest that because RFP+ thrombocytes have higher PE concentrations, DiI may bind to them efficiently, thus explaining the selective labeling of thrombocytes by DiI. This work also provides GloFli fish that should be useful in understanding the mechanism of thrombocyte maturation.


Conflict of interest statement

Conflict-of-interest disclosure: The authors declare no competing financial interests.

Figures

None
Graphical abstract
Figure 1.
Figure 1.
DiI labeling of thrombocytes. Chemical structure of DiI (top). Bottom panels show red fluorescence (A), cells under bright field (B), and hematoxylin and eosin (H and E)–stained blood cells (C). Yellow and black arrows show DP and DN thrombocytes, respectively. DiI-labeled thrombocytes have red fluorescence.
Figure 2.
Figure 2.
Characterization of Glo fish and GloFli fish. (A) Identification of fluorescent thrombocytes in Glo fish. From left to right are images of blood cells in a smear under red fluorescence, cells under bright field, and hematoxylin and eosin–stained cells obtained from Glo fish. Arrows show RFP+ thrombocytes. (B) Identification of GFP+ thrombocytes in Fli fish. From left to right are images of blood cells in a smear from Fli fish under bright field and green fluorescence. Arrows show GFP+ thrombocytes. (C) Identification of DP and DN thrombocytes in GloFli fish. From left to right are images of a blood smear from GloFli fish showing DP and DN thrombocytes, under bright field, red fluorescence, and green fluorescence. Arrows show DP (GFP+/RFP+) and DN thrombocytes (GFP+/RFP).
Figure 3.
Figure 3.
Analysis of GloFli fish thrombocytes by flow cytometry. Representative dot plots show the presence of GFP+ and RFP+ thrombocytes in whole blood of Glo fish (A), Fli fish (B), GloFli fish (C), and GloCD41 fish (D). FL1 and FL2 channels are shown as FL1-A and FL2-A on the x-axis and y-axis, respectively. Forward scattering in FL1 and FL2 channels measures green and red fluorescence from GFP+ and RFP+ thrombocytes and is shown in Q4-LR and Q4-UL gates, respectively. DP thrombocytes (GFP+/RFP+) are shown in the Q4-UR gate. The percentages of thrombocytes are shown in the respective gates. The large percentage of cells shown in Q4-LL (lower left quadrangle) gates represents other blood cells. Gating was according to the fluorescence intensities of thrombocytes in the side scattering.
Figure 4.
Figure 4.
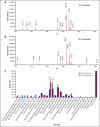
Single-cell lipid analysis of DP and DN thrombocytes by MALDI mass spectrometry. (A-B) Section of lipid profile mass spectrum peaks and their intensities obtained from high-intensity GFP+ thrombocytes (DN thrombocytes) and RFP+ low-intensity GFP+ thrombocytes (DP thrombocytes), respectively, by MALDI-LTQ-Orbitrap [M+Na]+ or [M+H]+. Labels on top of the peaks indicate m/z values. (C) Intensity of mass spectrum peaks representing lipids that were >1%, from DP and DN thrombocytes shown in Table 1. The numbers adjacent to the listed lipids are m/z values. The peaks from DN and DP thrombocytes for glycerophospholipids (PE) with an m/z value of 859.61 and glycerophospholipids (PC) with an m/z value of 860.62 showed significant differences. The respective P values are P < .001 and P < .007 for 3 replicates. The comparison of peak intensities for the sphingolipid-glycerophospholipid with an m/z value of 867.67 did not show any significant difference (ns, not significant; P = .47). Error bars represent standard error of the mean.
Figure 5.
Figure 5.
DiI labeling of liposomes. Fluorescence images of liposomes prepared with PC (right panel). Arrows show individual DiI-labeled liposomes. Note the halo surrounding each liposome. DiI in buffer alone as a control (Ctrl) without liposomes.
Figure 6.
Figure 6.
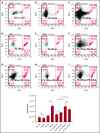
Analysis of DiI-labeled liposomes by flow cytometry. Representative dot plots of DiI-labeled liposomes that are included in the upper right gate (top). Fluorescence was measured in the FL2 (red) channel. Liposomes were prepared with DiI alone (A), PC 100 µL (B), PC 200 µL (C), PE 100 µL (D), PE 200 µL (E), PC 100 µL:PE 100 µL (F), PC 200 µL:PE 100 µL (G), PC 100 µL:PE 200 µL (H), and PC 200 µL:PE 200 µL (I) (shown in the upper right quadrangle). Bar graph shows the average fluorescence intensity of 6 experiments (n = 6) of DiI binding to liposomes prepared with the above PC and PE ratios. The numbers by the side of PE and PC show the lipid volume used to prepare liposomes (µL). ***P < .001; *P < .013. Error bars represent standard error of the mean. SSC-A, side scatter.

References

    1. Jagadeeswaran P, Sheehan JP, Craig FE, Troyer D. Identification and characterization of zebrafish thrombocytes. Br J Haematol. 1999;107(4):731-738. - PubMed
    1. Thattaliyath B, Cykowski M, Jagadeeswaran P. Young thrombocytes initiate the formation of arterial thrombi in zebrafish. Blood. 2005;106(1):118-124. - PMC - PubMed
    1. Gregory M, Jagadeeswaran P. Selective labeling of zebrafish thrombocytes: quantitation of thrombocyte function and detection during development. Blood Cells Mol Dis. 2002;28(3):418-427. - PubMed
    1. Jagadeeswaran P, Lin S, Weinstein B, Hutson A, Kim S. Loss of GATA1 and gain of FLI1 expression during thrombocyte maturation. Blood Cells Mol Dis. 2010;44(3):175-180. - PMC - PubMed
    1. Klymchenko AS, Kreder R. Fluorescent probes for lipid rafts: from model membranes to living cells. Chem Biol. 2014;21(1):97-113. - PubMed

Publication types

MeSH terms