. 2019 May 3;4(35):eaaw3658.
doi: 10.1126/sciimmunol.aaw3658.

Distinct immunocyte-promoting and adipocyte-generating stromal components coordinate adipose tissue immune and metabolic tenors

Affiliations

Distinct immunocyte-promoting and adipocyte-generating stromal components coordinate adipose tissue immune and metabolic tenors

Raul German Spallanzani et al. Sci Immunol. .

Abstract

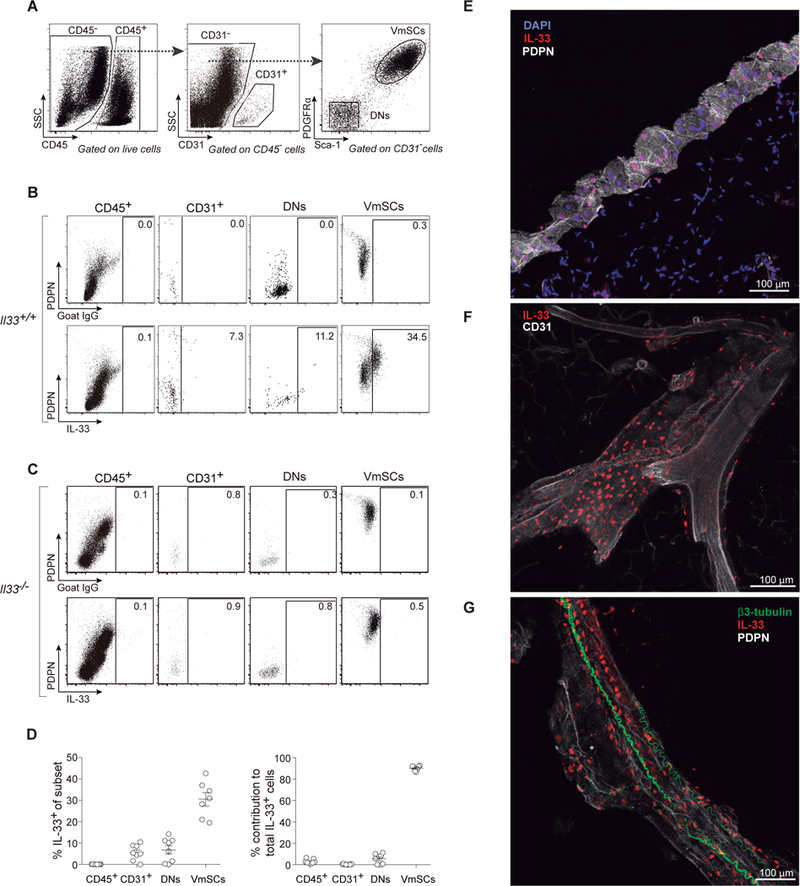
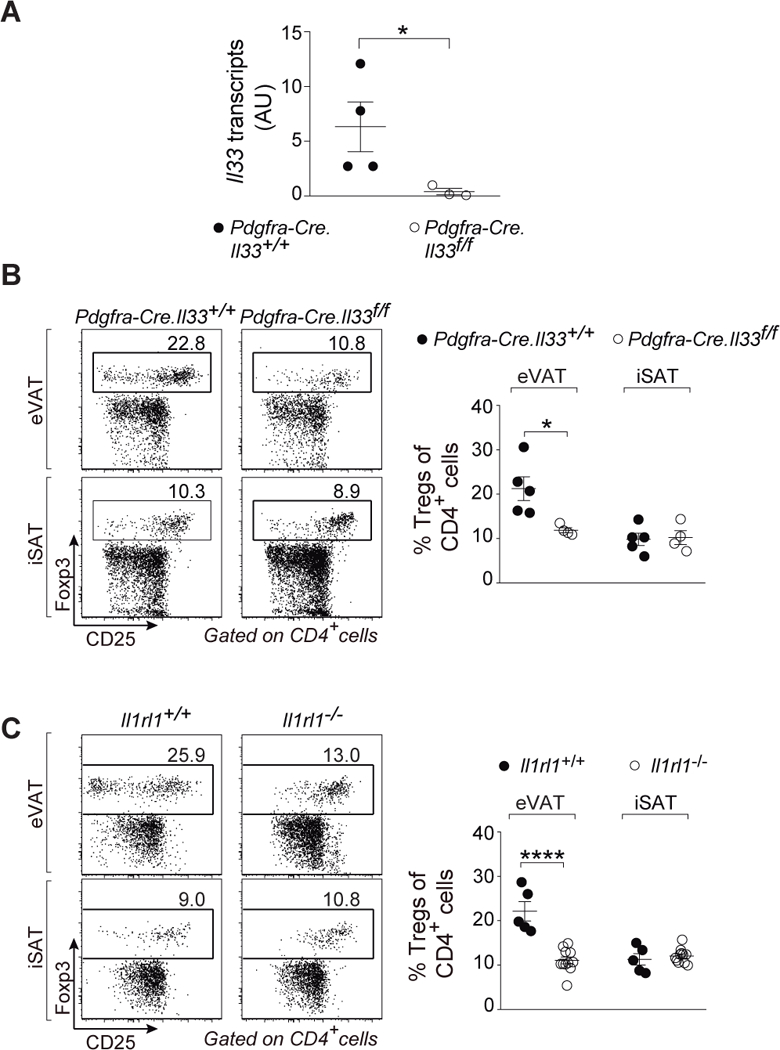
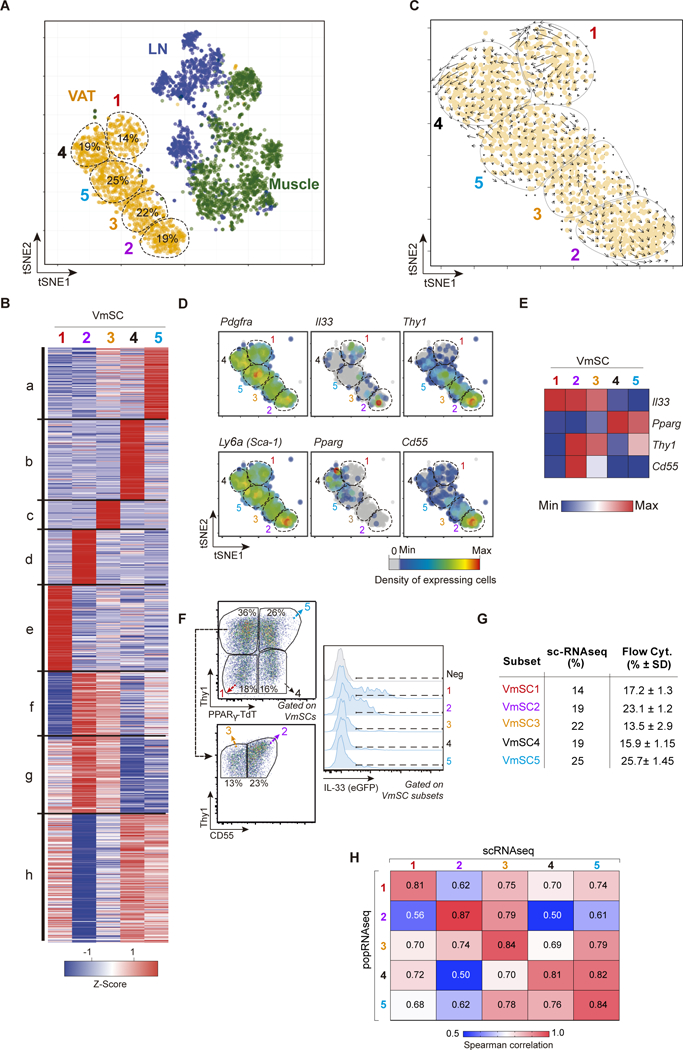
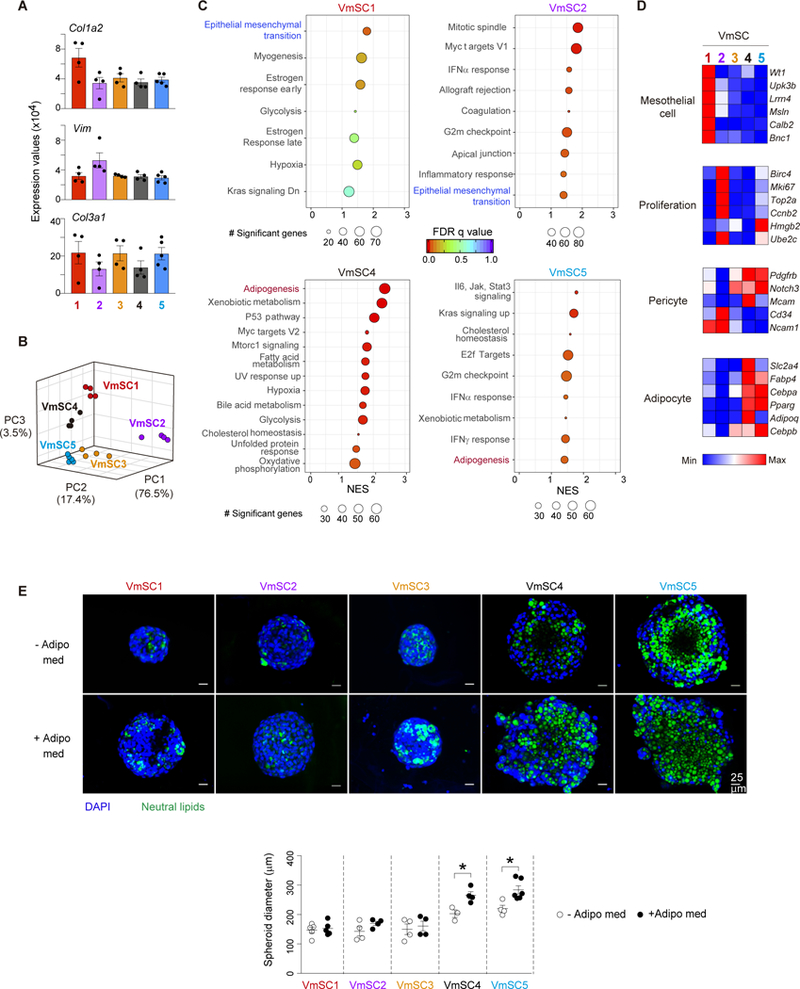
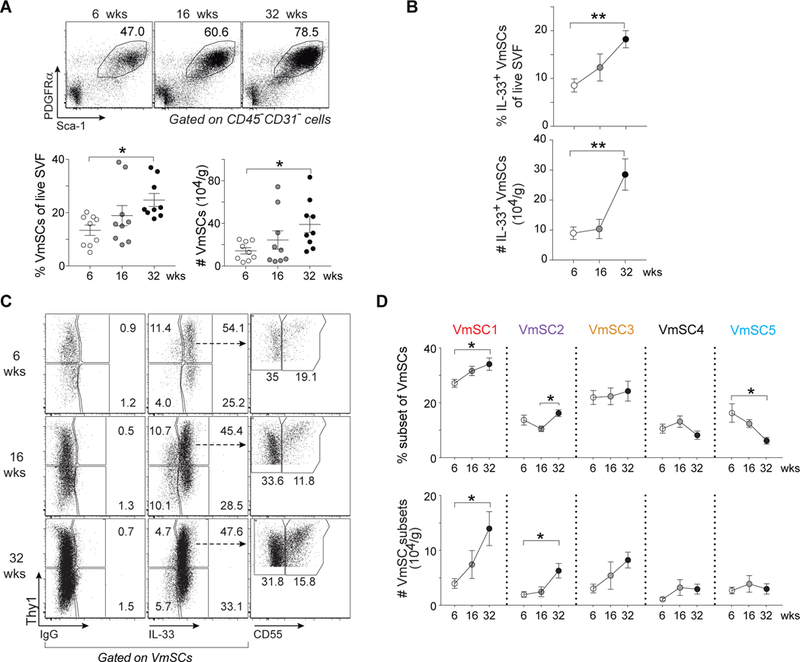
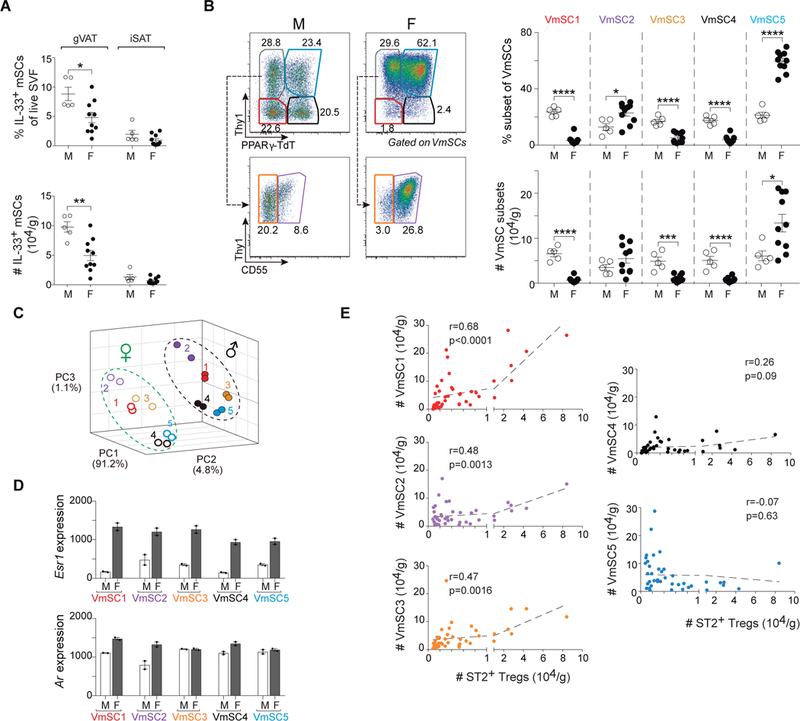
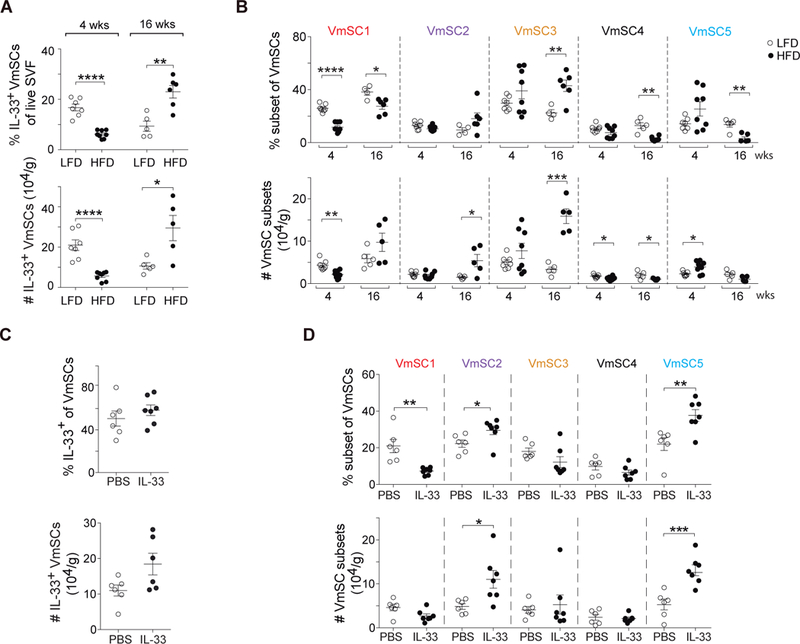
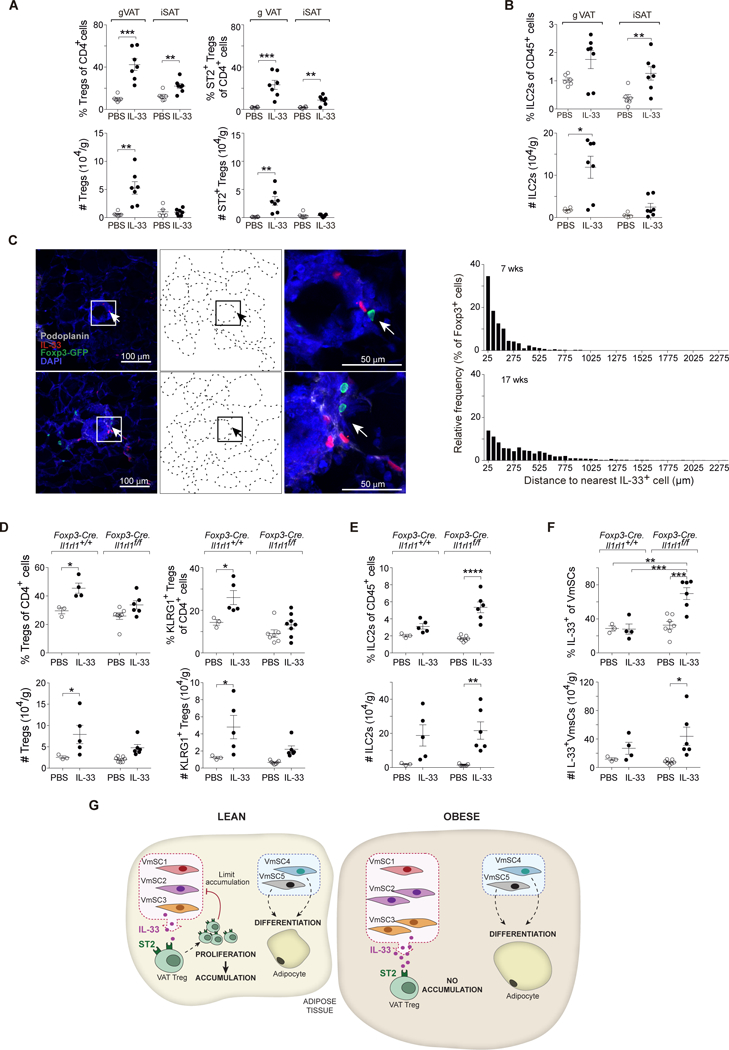
Regulatory T cells (Tregs) are key brakes on the visceral adipose tissue (VAT) inflammation that regulates local and systemic metabolic tenor. Breakdown of this regulation promotes type 2 diabetes. The cytokine IL-33 expands and sustains the unique Treg population residing within VAT. Here, relying on single-cell RNA sequencing, we identified the major IL-33 producers in VAT to be particular mesenchymal stromal cell subtypes, related to but distinct from adipocyte progenitor cells. We explored modulation of the VAT stromal cell landscape with physiologic variables such as age and sex, as well as its remodeling in pathogenic states like obesity. Last, we uncovered a VAT Treg:stromal cell negative regulatory loop that keeps the potent effect of IL-33 under rein.


Figures

Fig. 1.
Fig. 1.. PDGFRα+Sca-1+ mSCs are the major source of IL-33 in eVAT.
(A-D) Cytofluorimetric identification of IL-33-producing cells within eVAT of 8–10-week-old B6 mice using a polyclonal anti-IL-33 Ab. (A) Gating strategy to delineate cell fractions. (B) Representative dot-plots of control-Ab (top panels) or anti-IL-33 staining (bottom panels) of the cell fractions. (C) As per panel B except whole-body IL-33-deficient (II33−/−) mice were assessed. (D) Frequencies of IL-33+ cells in each cell fraction (left) and its contribution to total IL-33+ cells within the tissue (right). n≥7 from at least three experiments. (E-G) Confocal microscopic images of IL-33+ VmSCs. (E) The eVAT depot is circumferenced by a ring of high PDPN positivity, presumably the mesothelium. (F) IL-33+ cells locate in close proximity to CD31+ endothelial cells. (G) PDPN positivity outlines a large blood vessel surrounded by β3-tubulin+ nerves. Color code for Ab staining as indicated on top of each picture. PDPN, podoplanin; DNs, PDGFRαSca-1 cells; VmSCs, PDGFRα+Sca-1+ VAT mesenchymal stromal cells.
Fig. 2.
Fig. 2.. PDGFRα+Sca-1+ mSCs are the biologically relevant IL-33 producers.
(A) Quantitative PCR on whole eVAT of ll33 transcripts in Pdgfra-Cre.ll33f/f and corresponding wild-type littermates aged 12–16 weeks. (B and C) Fractions of Tregs in Pdgfra-Cre.ll33f/f (B) and ll1rl1−/− mice (C) compared with their matching wild-type controls in eVAT (top panels) and iSAT (bottom panels). n≥3 from at least two independent experiments. Mean ± SEM. p- values: *, <0.05; **, <0.01; ***, <0.001 according to the one-tailed (A) and two-tailed (B and C) unpaired Student’s t-test. AU, arbitrary units. eVAT, epididymal visceral adipose tissue; iSAT, inguinal subcutaneous adipose tissue.
Figure 3.
Figure 3.. mSCs exhibit extensive transcriptional heterogeneity.
(A) Two-dimensional tSNE plot of scRNA data from VAT (orange), muscle (green) and lymph node (blue) PDGFRα+Sca-1+ mSCs. VmSC subtypes 1–5 were delineated by k- means clustering; their fractional contributions to total VmSCs are indicated. (B) Heat-map showing genes differentially expressed between the VmSC subtypes (FDR < 5%). k-means clustered. (C) VmSCs dynamics (velocity field). The projected next cell state for each single cell is represented by an arrow and projected on the tSNE plot. (D) Same tSNE plot as in panel A overlain with heat-maps of the density of cells expressing various transcript markers. (E) Heat-map of transcript expression within the combined single-cell data of each VmSC subtype. (F-G) Representative dot-plots delineating the VmSC subtypes (left) and indicating their IL-33 expression levels (right) in PpargTdtIl33Egfp double-reporter mice. (G) Comparison of VmSC subtype frequencies obtained by scRNAseq versus flow cytometry. (H) Matrix of Spearman correlation coefficients in head-to-head comparisons of ≥2-fold differentially expressed genes from the scRNAseq and matching population (pop)-level RNAseq datasets. LN, lymph node.
Figure 4.
Figure 4.. mSCs subtypes exhibit different functional properties.
(A) Gene expression of pan-fibroblast genes across VmSC populations. (B) Three- dimensional PCA plot depicting the VmSC subsets. (C) GSEA-derived hallmarks for individual VmSC subtypes compared to the rest. Size of the circles denotes number of genes significantly enriched in each individual pathway, rainbow color code indicates FDR values, and NES is depicted on the x-axis of the plot. (D) Expression heat-maps for transcripts considered cardinal for the indicated cell-types. All should be over- expressed, except Cd34 and Ncam1 which were under-expressed in pericytes. Precise expression values appear in table S3. (E) Representative images of three-dimensional in vitro cultured VmSCs in the absence (−) or the presence (+) of an adipogenic medium (Adipo med) (top). Quantification of the spheroid diameter (bottom). All data from 8-10-week-old males, of B6 genotype unless indicated otherwise. GSEA, Gene set enrichment analysis. FDR, False discovery rate. NES, Normalized enrichment score. GSEA pathways were filtered based on a p-nominal value < 0.05. Other abbreviations as per Fig 1.
Fig. 5.
Fig. 5.. Age strongly influences immunocyte-promoting VmSCs and thereby Treg accumulation.
(A) Representative plots (top), frequencies and numbers (bottom) of total VmSCs from mice of different ages. (B) Frequencies (top) and numbers (bottom) of total IL-33+ VmSCs. (C and D) Cytofluorometric dot-plots of VmSC subtypes (C) and corresponding fractions (top) and numbers (bottom) (D) from lean B6 males of the indicated ages. Pooled data from three independent experiments. Numbers of cells were normalized per tissue weight. One-way ANOVA analysis was performed to compare three or more groups. For all relevant plots, mean ± SEM. p-values: *, ≤0.05; **, ≤0.01; ***, ≤0.001; ****, ≤0.0001. SVF, stromal vascular fraction. Other abbreviations as per Fig 1.
Fig. 6.
Fig. 6.. Gender determines drastically distinct VmSC subtype distribution and VAT Treg abundance.
(A) Frequencies (top) and numbers (bottom) of total IL-33+ VmSCs. (B) Cytofluorimetric dot-plots (left) and corresponding quantification of subtypes thereof (right) in gonadal (g)VAT and iSAT of lean male (M) and female (F) mice aged 18–20 weeks old. Pooled data from at least two independent experiments. (C) Three-dimensional PCA plot of the transcriptomes (population-level RNAseq) from coincidently prepared male and female VmSC subtypes from B6 mice 8–10 weeks old. (D) Esr1 (top) and Ar (bottom) transcripts levels for the individual VmSC subtypes from male (white bars) and female (black bars) mice aged 8–10 weeks old. Each dot represents an individual biological replicate from two or more pooled mice. (E) Correlation curves for numbers of IL-33+ VmSCs versus ST2+ Treg numbers in gVAT using meta-data from all male mice of various ages (6, 16, 18–20 and 32 weeks) and female mice 18–20 weeks old, i.e. all mice of normal physiologic state. In all cases, numbers of cells were normalized to tissue weight. r and p from Pearson’s correlation coefficient. All other statistics and abbreviations as per Fig. 1 and 5.
Fig. 7.
Fig. 7.. An IL-33-focused VAT-Treg:VmSC regulatory loop is uncovered in obese mice.
(A and B) Fractions (top) and numbers (bottom) of total IL-33+ VmSCs (A) and VmSC subtypes (B) subsequent to 4 or 16 weeks of high-fat feeding of 14-week-old B6 males. Data from at least two independent experiments. (C and D). Effects of IL-33 administration to 8–12-week-old B6 males. Frequency (top) and numbers (bottom) of total IL-33+ VmSCs (C) or of individual VmSC subtypes (D). Data shown corresponds to at least two pooled independent experiments. Numbers of cells were tissue weight-normalized in all cases. LFD, low-fat diet; HFD, high-fat diet; PBS, phosphate-buffered saline. All other statistics and abbreviations as per Figs. 1 and 5.
Fig. 8.
Fig. 8.. Specific ST2 expression on VAT Tregs is involved in their interaction with VmSC subtypes.
(A and B) IL-33 was administered to wild-type B6 males aged 8–12 weeks. Frequencies (top) and numbers (bottom) of total (left) and ST2+ (right) Tregs (A) or ILC2s (B). (C) Confocal images (group of left panels) showing Tregs and IL-33-expressing cells within eVAT at low-magnification (left), corresponding delineation of adipocyte edges based on autofluorescence of DAPI channel (middle) and high-magnification of the squared indicated area (right). Distance quantification between Foxp3+ Tregs and the nearest IL-33- expressing cell (group of right panels) from whole eVAT tissue sections taken from male VAT-Treg TCR- transgenic mice at 7 (top) and 17 (bottom) weeks of age. Arrows in panel C depict Treg:IL-33+ cell proximity. Color code for Ab staining as indicated within the picture. (D, E and F) IL- 33 was injected into mice lacking ST2 expression specifically by Tregs vs wild-type littermate controls. Frequencies (top) and numbers (bottom) corresponding to total and KLRG1+ Tregs (D), ILC2s (E) and IL-33+ VmSCs (F). All numbers were calculated relative to total tissue weight. (G) Graphic scheme of the proposed VmSC:Treg negative regulatory loop model. All other abbreviations and statistics as per Figs. 1, 5 and 7.

Comment in

  • Stromal IL-33 balances fat stores.
    Bird L. Bird L. Nat Rev Immunol. 2019 Jul;19(7):412-413. doi: 10.1038/s41577-019-0179-7. Nat Rev Immunol. 2019. PMID: 31110269 No abstract available.

References

    1. Hotamisligil GS, Foundations of immunometabolism and Implications for metabolic health and disease. Immunity. 47, 406 (2017). - PMC - PubMed
    1. Lee YS, Wollam J, Olefsky JM, An integrated view of immunometabolism. Cell. 172, 22 (2018). - PMC - PubMed
    1. Weisberg SP, McCann D, Desai M, Rosenbaum M, Leibel RL, Ferrante AW Jr., Obesity is associated with macrophage accumulation in adipose tissue. J Clin Invest. 112, 1796 (2003). - PMC - PubMed
    1. Xu H, Barnes GT, Yang Q, Tan G, Yang D, Chou CJ, Sole J, Nichols A, Ross JS, Tartaglia LA, Chen H, Chronic inflammation in fat plays a crucial role in the development of obesity-related insulin resistance. J Clin Invest. 112, 1821 (2003). - PMC - PubMed
    1. Feuerer M, Herrero L, Cipolletta D, Naaz A, Wong J, Nayer A, Lee J, Goldfine AB, Benoist C, Shoelson S, Mathis D, Lean, but not obese, fat is enriched for a unique population of regulatory T cells that affect metabolic parameters. Nat Med. 15, 930 (2009). - PMC - PubMed

Publication types

MeSH terms