. 2019 Jun;12(6):859-870.
doi: 10.1016/j.tranon.2019.03.005. Epub 2019 May 1.

Metadherin Is a Prognostic Apoptosis Modulator in Mesothelioma Induced via NF-κB-Mediated Signaling

Affiliations

Metadherin Is a Prognostic Apoptosis Modulator in Mesothelioma Induced via NF-κB-Mediated Signaling

Li Zhang et al. Transl Oncol. 2019 Jun.

Abstract

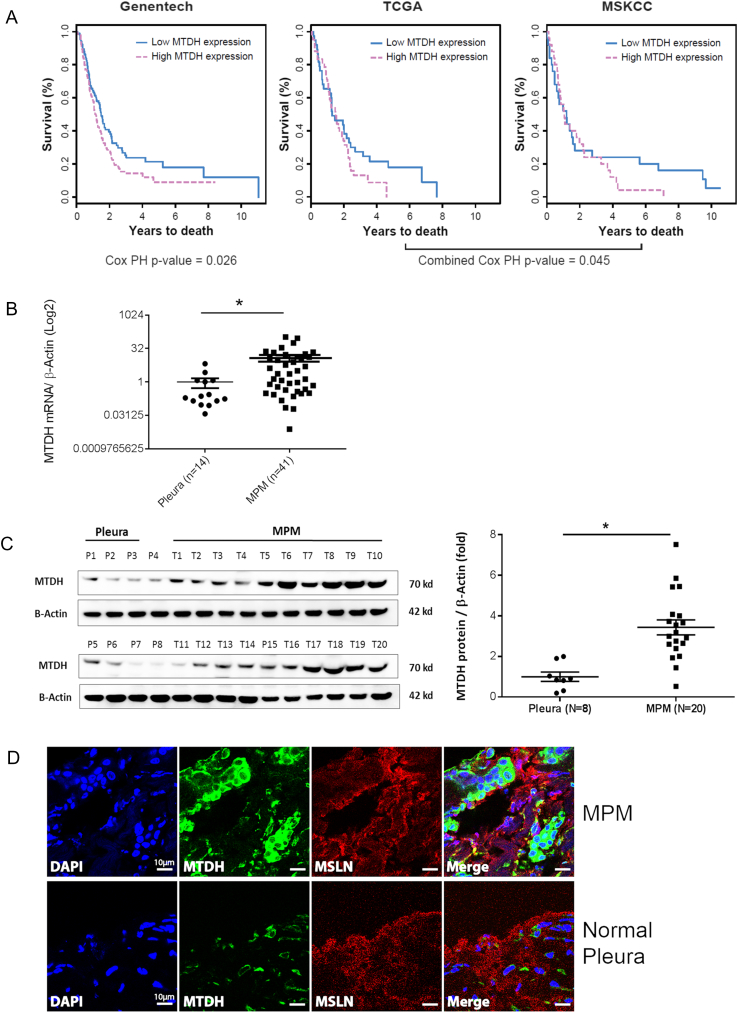
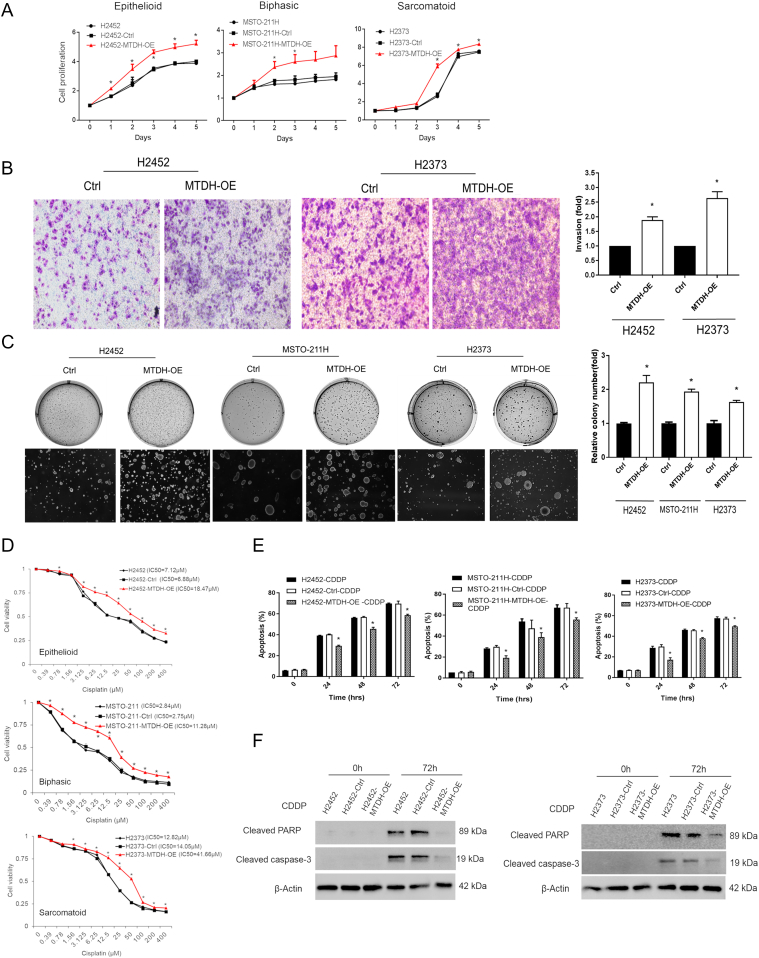
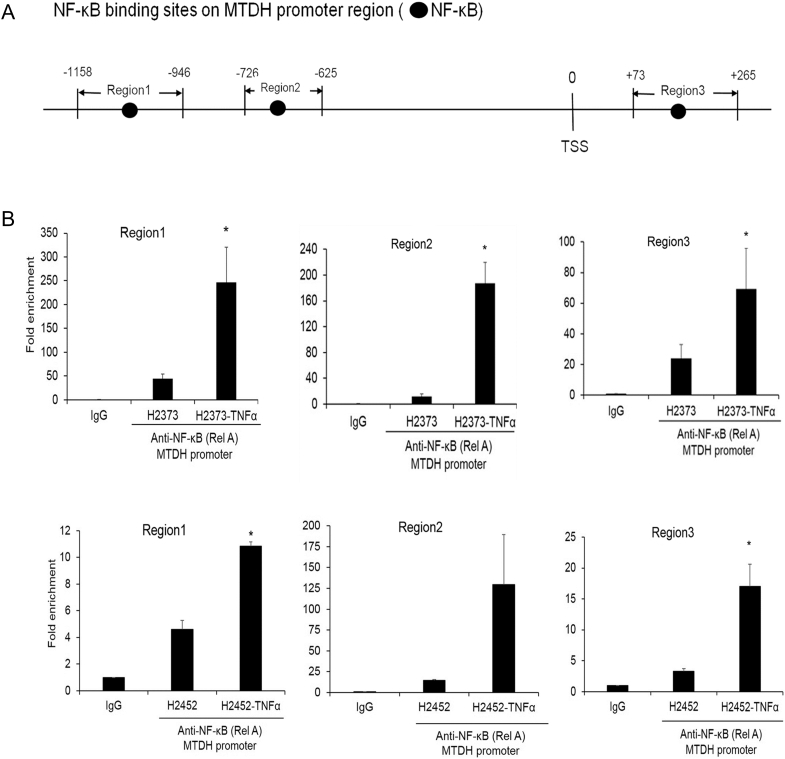
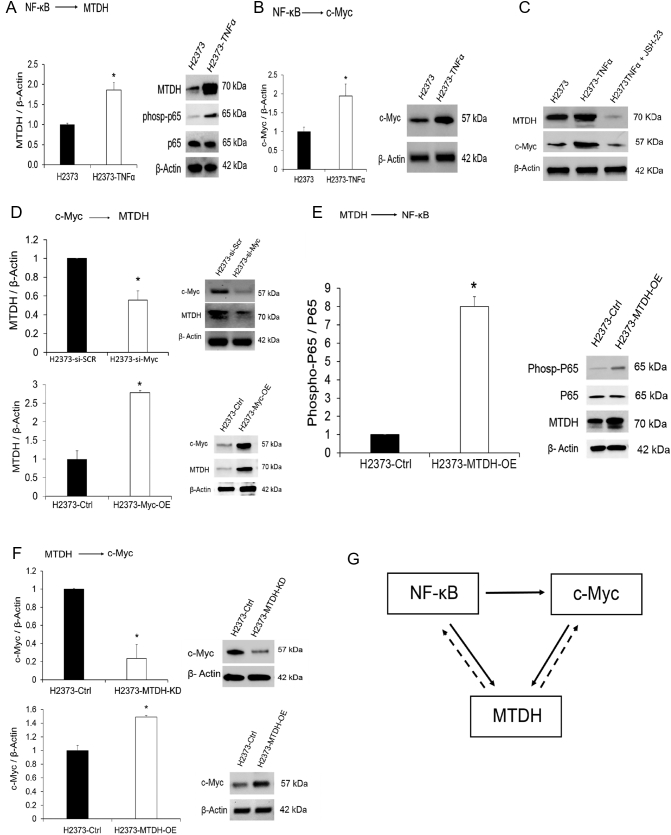
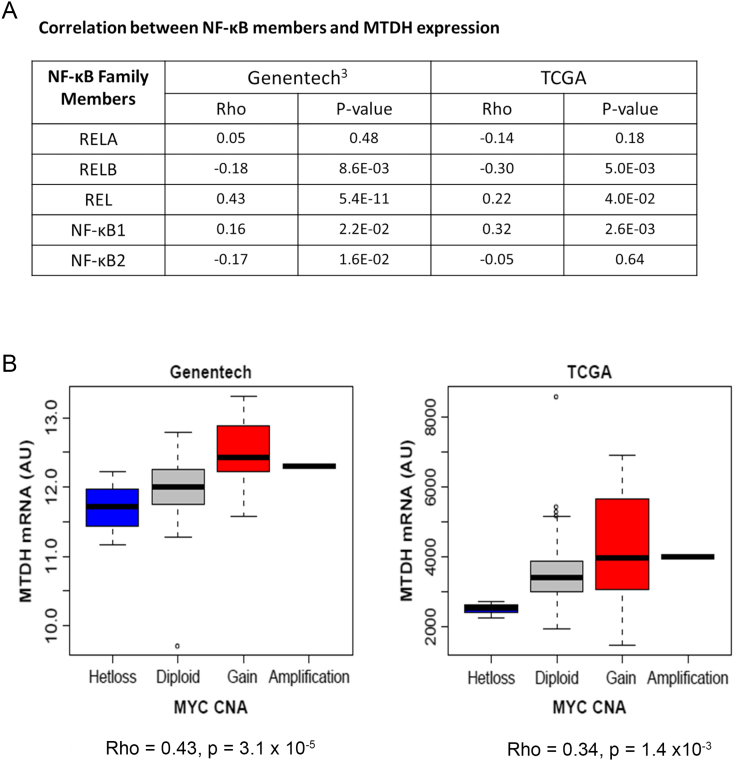
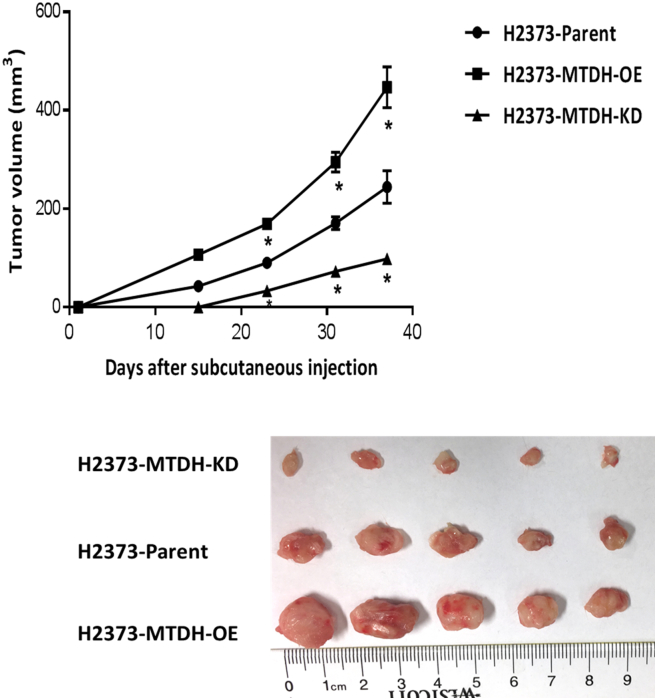
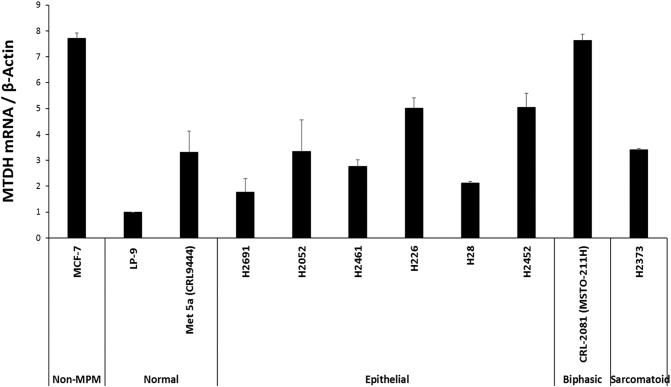
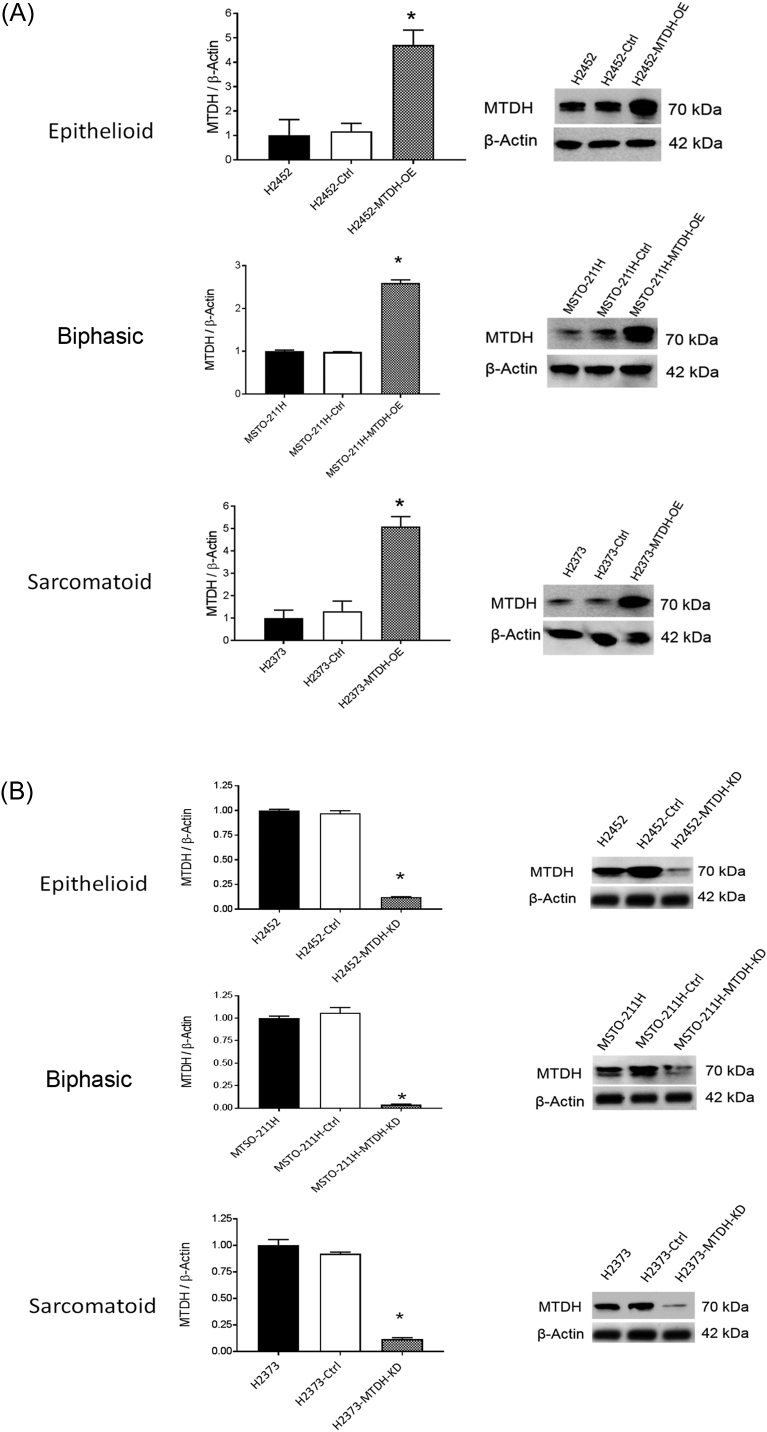
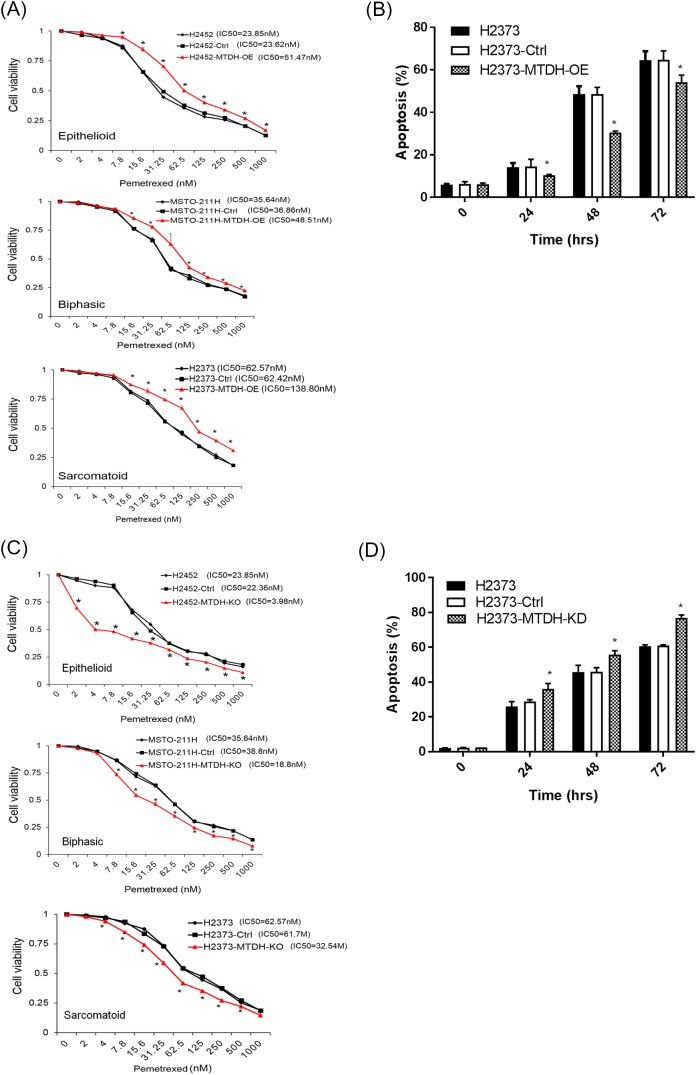
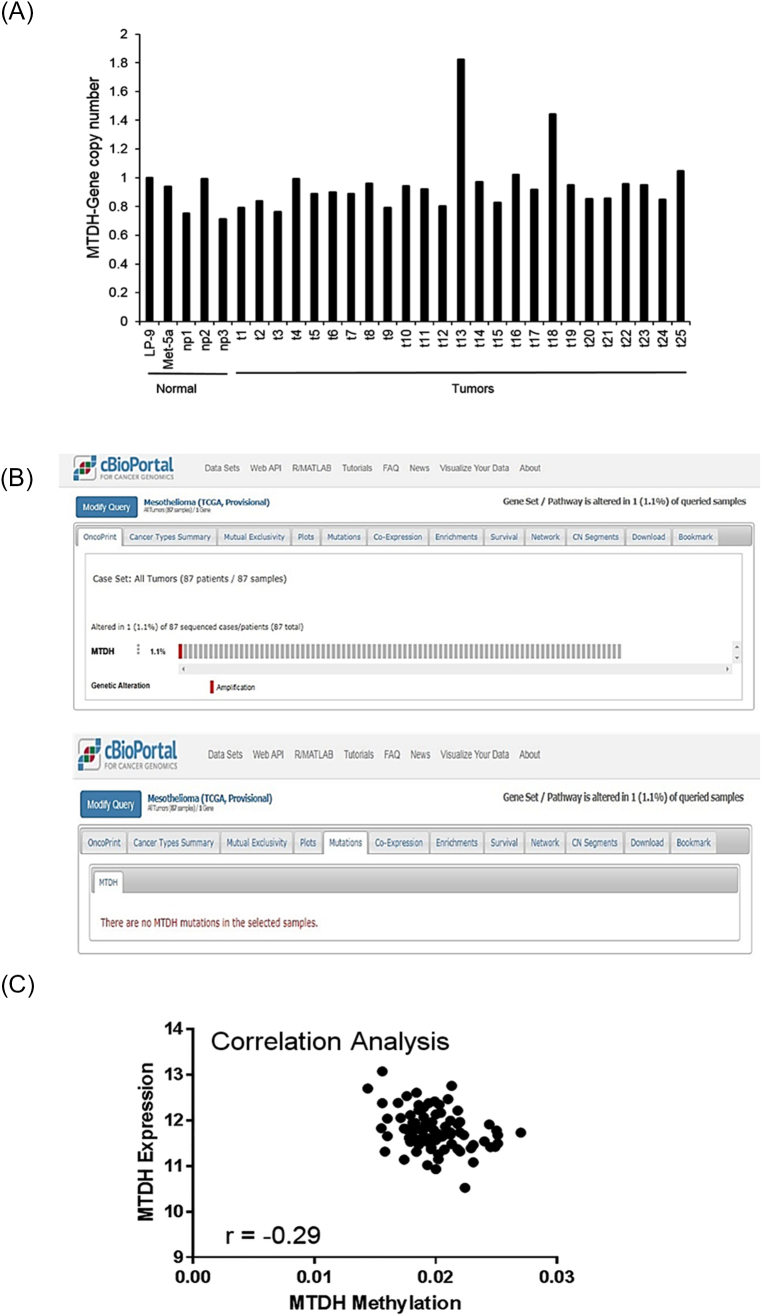
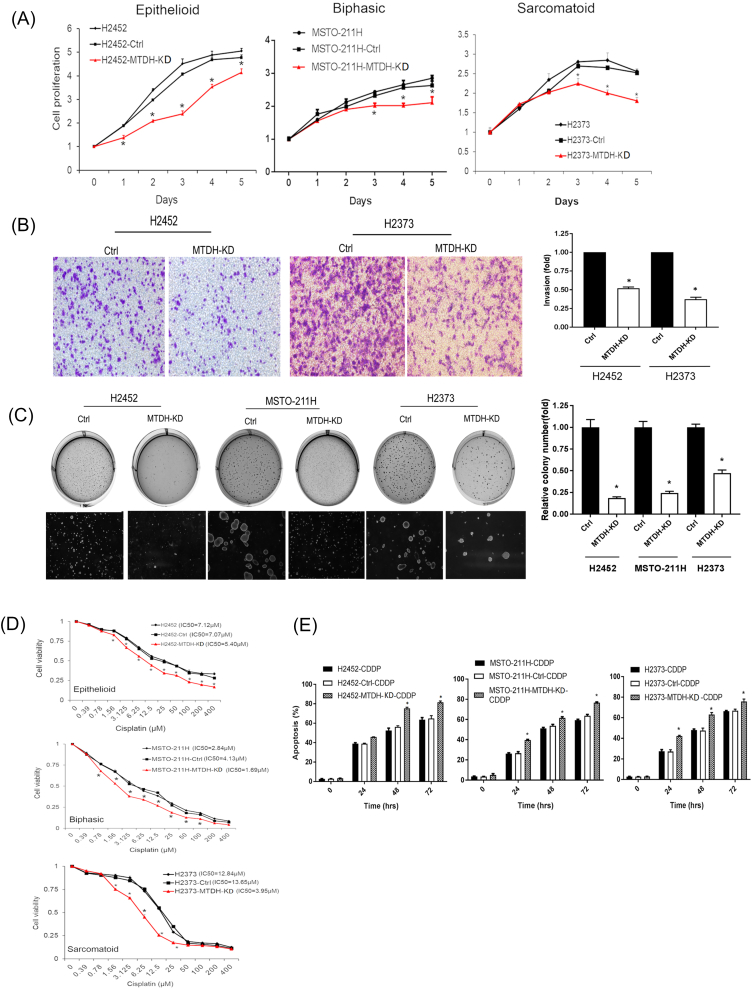
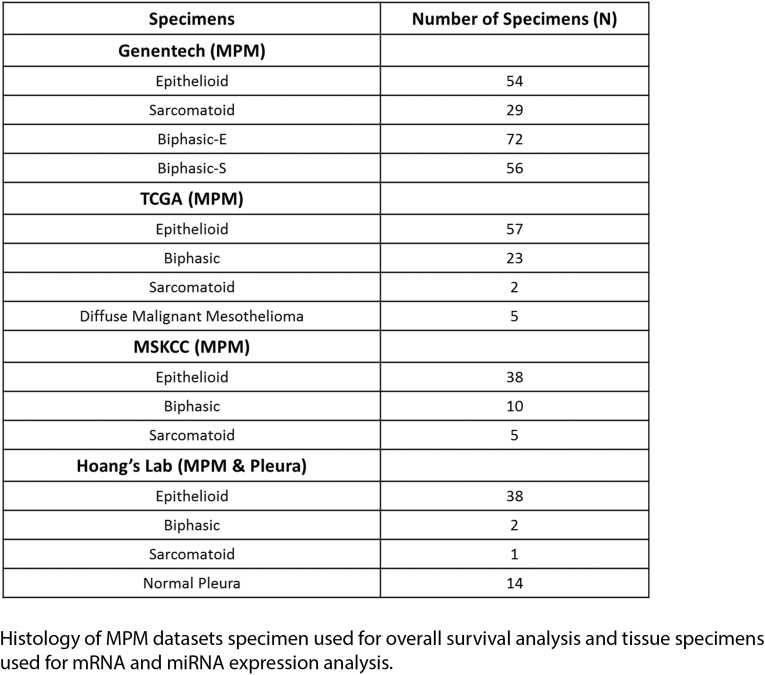
Therapies against malignant pleural mesothelioma (MPM) have yielded disappointing results, in part, because pathologic mechanisms remain obscure. In searching for rational molecular targets, we identified metadherin (MTDH), a multifunctional gene associated with several tumor types but previously unrecognized in MPM. Cox proportional hazards regression analysis delineated associations between higher MTDH expression and lower patient survival from three independent MPM cohorts (n = 349 patients). Through in vitro assays with overexpression and downregulation constructs in MPM cells, we characterized the role of MTDH. We confirmed in vivo the phenotype of altered MTDH expression in a murine xenograft model. Transcriptional regulators of MTDH were identified by chromatin immunoprecipitation. Overexpression of both MTDH mRNA (12-fold increased) and protein levels was observed in tumor tissues. MTDH stable overexpression significantly augmented proliferation, invasiveness, colony formation, chemoresistance, and an antiapoptosis phenotype, while its suppression showed opposite effects in MPM cells. Interestingly, NF-κB and c-Myc (in a feed-forward loop motif) contributed to modulating MTDH expression. Knockdown of MTDH expression profoundly retarded xenograft tumor growth. Thus, our findings support the notion that MTDH integrates upstream signals from certain transcription factors and mediates pathogenic interactions contributing to MPM traits. MTDH represents a new MPM-associated gene that can contribute to insights of MPM biology and, as such, suggest other treatment strategies.


Figures

Figure 1
Figure 1
Metadherin is a novel prognostic gene overexpressed in MPM. (A) Kaplan-Meier curves depicting overall survival of MPM patients grouped according to a dichotomized expression of MTDH transcript level. In the Genentech cohort (n = 211), there is a statistically significant reduction in overall survival for those harboring MPM tumors with relatively “high” MTDH expression (Cox proportional hazards P = .026; age is a covariate). This survival association validated in the joint analysis of TCGA (n = 85) and MSKCC (n = 53) cohorts. Their Cox proportional hazards regression Z scores were combined, and P values were computed based on the combined Z score (combined Cox proportional hazards P value = .045). PH is proportional hazards. (B) qRT-PCR verified the mRNA quantity of MTDH in a separate random group of MPM tumors compared to a separate set of unpaired normal pleura tissues. The tumor cohort is comprised of all three MPM histologies (38, epithelioid; 2, biphasic; 1, sarcomatoid). MPM expressed 12-fold more MTDH mRNA compared to normal pleura. (C) Western blotting of the same tissues analyzed by qRT-PCR shows the MTDH protein levels in MPM tumor tissues (T1-T20) and pleural (P1-P8). This subset of epithelioid tumors and pleura specimens was randomly selected from the original tissue cohorts. The associated dot graph (right) quantitates the relative protein abundance of MTDH depicted in the Western blot. (D) Immunohistofluorescence microscopy reveals the cellular location of MTDH protein. Top panel (MPM cells) shows increased staining of MTDH (green), which is predominately expressed in the cytosolic compartment and not at the cell membrane, unlike mesothelin (MSLN, red). Bottom panel is a representative normal pleura specimen showing reduced MTDH staining compared to MPM cells. Nuclei are stained with DAPI (blue). MTDH (green) and MSLN (mesothelin, red). Bars in graphs represent the mean ± SE, *P < .05, **P < .001. Scale bar: 10 μm.
Figure 2
Figure 2
Biologic effects of metadherin overexpression in MPM. (A) MTDH overexpression promoted proliferation in MPM cells. MPM cell lines (H2452, MSTO-211H, and H2373) were stably overexpressed with MTDH (red). Data are expressed as relative fold change compared with day 0. On day 3, cell proliferation increased 1.3-fold (H2452), 1.7-fold (MSTO-211H), and 3.0-fold (H2373) (P < .05). (B) Boyden chamber assay showed that MTDH overexpression increases invasive capability of MPM cells by 1.9-fold (H2452) and 2.6-fold (H2373). (C) Soft agar assay in which MTDH overexpression accelerated colony formation. Relative colony numbers increased 2.2-fold (H2452), 1.9-fold (MSTO-211H), and 1.6-fold (H2373) (P < .05). (D) Cell viability was assessed at varying concentrations of cisplatin (CDDP) to calculate IC50 values. MTDH overexpression (red) rendered MPM cells more chemoresistant, requiring 2.6-fold (H2452), 4.0-fold (MSTO-211H), and 3.1-fold (H2373) higher doses of drug to reach IC50 levels. (E) MTDH overexpression significantly decreased apoptosis after 72 hours of treating MTDH-induced cells with a fixed concentration of cisplatin (IC50) by 15.9% (H2452), 16.9% (MSTO-211H), and 14.0% (H2373) compared to parental cells. (F) Western blot showing decreased apoptotic proteins (cleaved PARP and caspase-3) at 72 hours of cisplatin exposure in both H2452 and H2373 MPM cells overexpressing MTDH. Where applicable, data are presented as mean ± SE. Ctrl is overexpression vector control sample. * is P < .05 versus parent cell line and/or negative control specimen. MTDH-OE is stably overexpressed MTDH in MPM cells.
Figure 3
Figure 3
NF-κB directly binds the metadherin promoter and induces metadherin expression. (A) Schematic of NF-κB binding sites in the promoter region of the MTDH gene. (B) ChIP- qPCR quantification of enrichment of DNA fragments that contain putative NF-κB binding site(s). Where applicable, data are presented as mean ± SE. Ctrl is the parental cell line. * P <. .05 versus parent cell line and/ or negative control specimen (IgG). TSS denotes transcription start site.
Figure 4
Figure 4
Metadherin regulation in MPM is influenced by upstream transcription factors. (A) TNF-α treatment of MPM cells triggers activation of NF-κB signaling as determined by increased phosphorylated p65 protein over a 24-hour duration. MTDH transcript abundance increased (left) as well as protein levels (right). (B) Both c-Myc mRNA (left) and protein (right) expression increased markedly after 24 hours of TNF-α treatment. (C) Treatment of cells with a specific p65 inhibitor (JSH-23) decreased both MTDH and c-Myc protein levels, confirming direct regulation of MTDH and c-Myc by NF-κB. (D) We verified that c-Myc induces MTDH expression. When c-Myc expression was transiently knocked down using siRNA (si-Myc), there was a corresponding decrease observed for both MTDH mRNA (left) and protein (right) levels. Conversely, when c-Myc was overexpressed (Myc-OE), there was a corresponding increase observed for both MTDH mRNA and protein levels. (E) Western blotting confirms that MTDH overexpression results in the activation of NF-κB (p65) in MPM cells, as determined by increased levels of phosphorylated p65 protein. (F) Overexpression and knockdown experiments demonstrate that MTDH positively modulates c-Myc transcript (left) and protein (right) levels in MPM cells. (G) Schematic of a plausible regulatory network controlling MTDH expression in MPM. NF-κB induces feed-forward signaling (solid arrow) that is functionally equivalent to a sensor-coupled switch contributing to maintain activation of MTDH once a threshold of stimulation triggers NF- κB. There are secondary positive feedback loops induced by MTDH itself (dotted arrow). Where applicable, data are presented as mean ± SE. * is P < .05 versus parent cell line and/or negative control specimen. MTDH-OE is stable overexpression of and MTDH-KD is stable gene knockdown of MTDH in MPM cells, respectively.
Figure 5
Figure 5
Tumor tissue analysis of the regulatory network influencing metadherin expression. (A) Correlation between NF-κB subunits and MTDH expression as derived from tumor tissue datasets. (B) Correlation analysis of c-Myc copy number aberration versus MTDH expression. There was a significant association between c-Myc copy number gains and MTDH mRNA expression (P < .05) among independent patient cohorts. Rho is Spearman's rank correlation coefficient. CNA is copy number aberrations. Genentech RNA-seq data (n = 211). The Cancer Genome Atlas (TCGA)–RNA-seq data (n = 87).
Figure 6
Figure 6
Modulation of metadherin expression in MPM affects tumor xenograft growth. Graph depicts tumor growth in a murine xenograft model of subcutaneously injected MPM cells. Three groups of MPM xenografts were assessed. Knockdown of MTDH gene expression resulted in profound tumor inhibition. Photo shows tumor xenografts. * is P < .05 versus parent cell line. MTDH-OE is stable overexpression of and MTDH-KD is stable gene knockdown of MTDH in MPM cells, respectively. Measuring scale is in centimeters.
Supplementary Figure S1
Survey of MTDH basal expression in MPM lines. Basal expression of MTDH transcript in a panel of NCI MPM cell lines. LP9 is used as the reference normal cell line for MTDH quantitation. MCF-7 breast carcinoma cells are positive control of MTDH expression. qRT-PCR quantitated relative abundance of MTDH in epithelioid MPM lines, a biphasic MPM line, and a sarcomatoid MPM line. The frequency of cell line histologies reflects the pathologic distribution (and availability) of human MPM. H2452, MSTO-211H, and H2373 were chosen as representative cells in subsequent experiments.
Supplementary Figure S2
Confirmation of MTDH altered expression in transfected MPM lines. (A) Validation of MTDH overexpression constructs. The MTDH gene was stably overexpressed in three representative MPM lines H2452, MSTO-211H, and H2373 by lentiviral transfection. In all MPM lines, the MTDH protein amount markedly increased above basal levels of parental cells when the MTDH transcript was overexpressed (MTDH-OE). (B) Validation of MTDH knockdown constructs. Although CRISPR/Cas9 gene editing was used, because single clones were not selected, there remained low detection of MTDH transcripts in MPM cell lines. In all MPM lines, the MTDH protein amount markedly decreased below basal levels of parental cells when the MTDH transcript was suppressed (MTDH-KD). MTDH mRNA transcript was assessed by qRT-PCR, and protein amount was assessed by Western blotting. Where applicable, data are presented as mean ± SE. Ctrl is a negative control. * P < .05.
Supplementary Figure S3
Modulating metadherin expression levels affects pemetrexed sensitivity in MPM cell lines. (A) Cell viability was assessed at varying concentrations of pemetrexed to calculate IC50 values. MTDH overexpression (red) rendered MPM cells less sensitive to treatment, requiring 2.2-fold (H2452), 1.3-fold (MSTO-211H), and 2.2-fold (H2373) higher doses of drug to reach IC50 levels. (B) Annexin V flow cytometry measured levels of apoptosis when H2373 cells were treated with a fixed dose (IC50) of pemetrexed. Cells overexpressing MTDH (MTDH-OE) had lower levels of apoptosis. (C) Cell viability was assessed at varying concentrations of pemetrexed to calculate IC50 values. MTDH knockdown (red) rendered MPM cells more sensitive to treatment with pemetrexed, requiring 5.8-fold (H2452), 2-fold (MSTO-211H), and 1.9-fold (H2373) lower doses of drug to reach IC50 levels. (D) Annexin V flow cytometry measured levels of apoptosis when H2373 cells were treated with a fixed dose (IC50) of pemetrexed. Cells with reduced expression of MTDH (MTDH-KD) had lower levels of apoptosis. Where applicable, data are presented as mean ± SE. Ctrl is a negative control. OE indicates gene overexpression. KD indicates gene suppression. * P < .05.
Supplementary Figure S4
Common mechanisms of increased gene expression are not responsible for metadherin overexpression in MPM tumors. (A) MTDH gene copy number was quantitated by qRT-PCR. There was no significant difference in the mean copy number among MPM tumors (t) versus normal pleural tissue (np) as compared to control, normal mesothelial cell lines (MeT-5A, LP9). Two tumor specimens showed increased copy number, but this did not alter statistical results. (B) TCGA data on MPM specimens were queried via cBioPortal. Only a single (1 of 87) MPM specimen showed amplification of MTDH (top). Investigation of MTDH mutational status detected no mutations of MTDH in MPM (bottom). (C) A correlation analysis was performed to assess the methylation status of the MTDH promoter. From the TCGA dataset, there was only a weak correlation (r < ±0.5) between MTDH mRNA expression versus CpG status of the MTDH promoter. Where applicable, data are presented as mean ± SE. Ctrl is overexpression scrambled sample. * is P < .05 versus parent cell line and/or negative control specimen.
Supplementary Figure S5
Biologic effects of metadherin suppression in MPM cells. (A) MTDH knockdown (red) decreased proliferation in MPM cells. On day 3, cell proliferation decreased 47% (H2452), 17% (MSTO-211H), and 20% (H2373) (P < .05). (B) Boyden chamber assay showed that MTDH knockdown decreases invasive capability of MPM cells by 48% (H2452) and 63% (H2373). (C) MTDH knockdown abrogated colony formation. Soft agar assays reveal that relative colony numbers decreased 82% (H2452), 76% (MSTO-211H), and 53% (H2373) (P < .05). (D) Cell viability was assessed at varying concentrations of cisplatin to calculate IC50 values. MTDH knockdown (red) rendered MPM cells more chemosensitive, requiring 24% (H2452), 52% (MSTO-211H), and 70% (H2373) lower doses of drug to reach IC50 levels. (E) Levels of apoptosis were measured after MPM cells were treated with a fixed dose (IC50) of cisplatin. MTDH knockdown significantly augmented apoptosis at 48 hours by 1.5-fold (H2452), 1.2-fold (MSTO-211H), and 1.3-fold (H2373) compared to parental cells. Where applicable, data are presented as mean ± SE. Ctrl is a knockdown scrambled sample. * is P < .05 versus parent cell line and/or negative control specimen. MTDH-KD is stable gene suppression of MTDH in MPM cells.
Supplementary Table S1
Histology of MPM Datasets Specimen Used for Overall Survival Analysis and Tissue Specimens Used for mRNA and miRNA Expression Analysis
Supplementary Table S2
qRT-PCR Probes and Assay Kit Used for Gene Expression and Copy Number Analysis, and Primer Pairs Used for ChIP Assay

Similar articles

Cited by

References

    1. Beckett P, Edwards J, Fennell D, Hubbard R, Woolhouse I, Peake MD. Demographics, management and survival of patients with malignant pleural mesothelioma in the National Lung Cancer Audit in England and Wales. Lung Cancer. 2015;88:344–348. - PubMed
    1. Zalcman G, Mazieres J, Margery J, Greillier L, Audigier-Valette C, Moro-Sibilot D, Molinier O, Corre R, Monnet I, Gounant V. Bevacizumab for newly diagnosed pleural mesothelioma in the Mesothelioma Avastin Cisplatin Pemetrexed Study (MAPS): a randomised, controlled, open-label, phase 3 trial. Lancet. 2016;387:1405–1414. - PubMed
    1. Bueno R, Stawiski EW, Goldstein LD, Durinck S, De Rienzo A, Modrusan Z, Gnad F, Nguyen TT, Jaiswal BS, Chirieac LR. Comprehensive genomic analysis of malignant pleural mesothelioma identifies recurrent mutations, gene fusions and splicing alterations. Nat Genet. 2016;48:407–416. - PubMed
    1. Bononi A, Napolitano A, Pass HI, Yang H, Carbone M. Latest developments in our understanding of the pathogenesis of mesothelioma and the design of targeted therapies. Expert Rev Respir Med. 2015;9:633–654. - PMC - PubMed
    1. Li J, Zhang N, Song LB, Liao WT, Jiang LL, Gong LY, Wu J, Yuan J, Zhang HZ, Zeng MS. Astrocyte elevated gene-1 is a novel prognostic marker for breast cancer progression and overall patient survival. Clin Cancer Res. 2008;14:3319–3326. - PubMed