. 2019 May 22;8(5):467-474.e4.
doi: 10.1016/j.cels.2019.03.007. Epub 2019 May 1.

Reduced Repertoire of Cortical Microstates and Neuronal Ensembles in Medically Induced Loss of Consciousness

Affiliations

Reduced Repertoire of Cortical Microstates and Neuronal Ensembles in Medically Induced Loss of Consciousness

Michael Wenzel et al. Cell Syst. .

Abstract

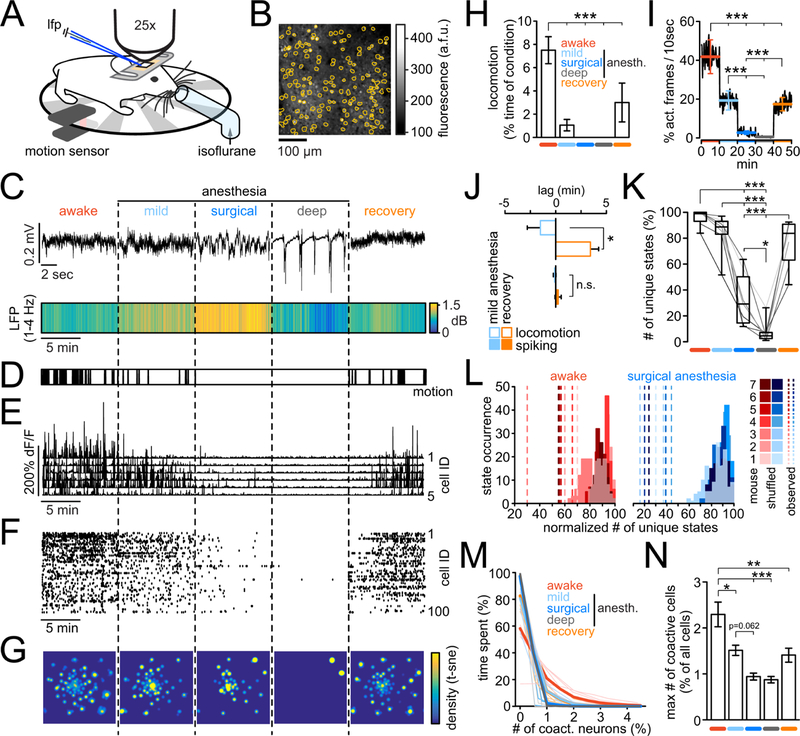
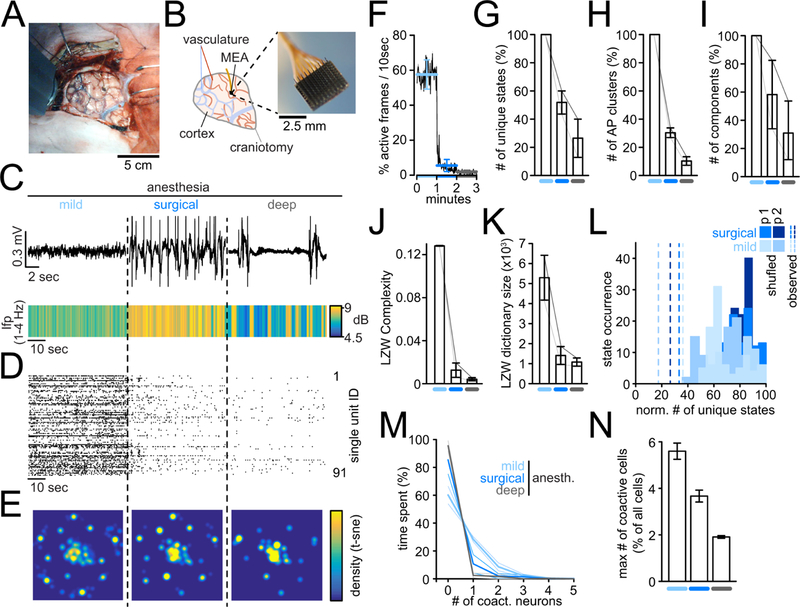
Medically induced loss of consciousness (mLOC) during anesthesia is associated with a macroscale breakdown of brain connectivity, yet the neural microcircuit correlates of mLOC remain unknown. To explore this, we applied different analytical approaches (t-SNE/watershed segmentation, affinity propagation clustering, PCA, and LZW complexity) to two-photon calcium imaging of neocortical and hippocampal microcircuit activity and local field potential (LFP) measurements across different anesthetic depths in mice, and to micro-electrode array recordings in human subjects. We find that in both cases, mLOC disrupts population activity patterns by generating (1) fewer discriminable network microstates and (2) fewer neuronal ensembles. Our results indicate that local neuronal ensemble dynamics could causally contribute to the emergence of conscious states.

Keywords: Calcium imaging; Coma; Consciousness; Ensembles; Information theory; Local networks; Microelectrode array; Microscale.


Conflict of interest statement

Conflict of Interest: The authors declare no competing financial interests

Figures

Figure 1
Figure 1
Monitoring microcircuit signatures of mLOC in mice. A) Awake, head-restrained mouse on a running wheel. Locomotion was measured by an infrared sensor. For seamless transitions across conditions, isoflurane was delivered through a custom tube placed right in front of the mouse. For LFP recordings, a pulled glass microelectrode was carefully inserted into the cortex at around 250µm depth through a small burr hole next to an implanted glass cover. Through the glass, two-photon calcium imaging was performed. B) Image of typical field of view and registered neuronal somata outlines (orange). C) Upper panel: Representative brief raw LFP traces across five conditions. Lower panel: Avg LFP delta range [1–4Hz] spectral power across all five 10min long conditions (n=7 animals). Note the continuously increased delta power during surgical anesthesia. D) Superimposed locomotion of all 7 mice across conditions. Note that movement is absent in surgical and burst-suppression anesthesia. E) Calcium transients of 5 representative registered neurons across all five conditions. F) Corresponding raster plot of all registered neurons. G) Density map of microcircuit states, visualized by t-SNE for the entire experiment, displayed per condition. Vectors representing the population activity at each time point were transformed into a two-dimensional space while preserving local structures, and a density map was generated from the scatter plot. H) Quantification of locomotion across the entirety of each experiment (exp.), displayed as % locomotion per condition (10min each); anesth.=anesthesia. I) Neural activity level across conditions, quantified as probability of detecting activity within a moving 10sec window in a yes or no fashion; errorbars represent means ± s.e.m. per condition; conditions colored as in Fig. 1H) J) Relationship between LOC and neural activity during mild anesthesia vs. recovery. Shown are the mean lags (n = 7 mice) of events (motion or spiking) with respect to the first (5 min), and second half (5 min) of mild anesthesia, or recovery. If motion or activity were evenly distributed throughout conditions, mean lags would be 0. Note how locomotion consistently stopped in the first half of the mild anesthesia condition, while it re-emerged exclusively in the second half the recovery condition (−90.6 ± 77.6 sec vs. 205 ± 48.6 sec, Mann Whitney test [n=7]; p=0.0105). Importantly, in both conditions neural activity levels were much more evenly distributed across both conditions (−6.2 ± 7.8 sec vs. 14,2 −18,3 sec, Mann Whitney test [n=7]; p=0.62). K) Boxplots of number of unique microstates (t-SNE/WS) across conditions as % of all identified unique microstates in a given experiment; line plots are individual experiments (grayscale) L) Total number of observed unique microstates (dashed lines) during wakefulness (red) or surgical anesth. (blue) vs. corresponding distributions of values from 100 randomized datasets. (n = 7 mice, each exp. max-normalized for purpose of visualization). No overlap of observed vs. random data (p<0.01). M) Number of co-active neurons (in %, for purpose of visualization) versus the relative time spent by imaged population containing such co-activity, displayed per condition. Thick lines represent means, thin lines individual exp. conditions L) Maximum number of co-active neurons (as % of all neurons per exp.) participating in a specific microstate, across conditions (colors as in M). Borderline statistical significance mild vs. surgical anesthesia p=0.062. Figure 1 H–L show data from n=7 mice; all errorbars represent mean ± s.e.m.; all boxes in boxplots represent 25–75%ile of the data, bars within boxes represent means. Except comparison between observed and randomized data (1L), and comparison of two groups (1J), all statistical analyses represent 1way-anova with Bonferroni post-test. *p<0.05, **p<0.01, ***p<0.001.
Figure 2
Figure 2
Reduced repertoire of cortical microstates and ensembles upon mLOC in humans. All errorbars in figure 2 represent mean ± s.e.m.. (n=2 patients). A) Photo of the craniotomy carried out on one patient in this study. B) Left: Drawing of craniotomy in A). craniotomy (gray); arteries (red); veins (blue), multi-electrode microarray (MEA, black). Right: close-up photo of micro-electrode array (4×4mm, 96 electrodes). C) Upper panel: Representative brief raw LFP traces across three anesthetic conditions in one patient. Lower panel: Avg LFP delta range [1–4Hz] spectral power across conditions, and patients. D) Raster plot of all single units in one patient. E) 2-dimensional density plot of same data after t-SNE, displayed per condition. Every dot represents a timepoint containing neural activity. F) Neural activity level across conditions, quantified as probability of detecting activity within a moving 10sec window in a yes or no fashion; conditions colored as in C). G) Number of unique microstates (t-SNE/WS) across conditions as % of all identified microstates per exp.; line plots are individual patients. H) Number of unique microstates (APC) across conditions as % of all identified microstates per exp.; line plots are individual patients. I) Number of PCA components across conditions as % of all identified components per exp.; line plots are individual patients. J) LZW complexity across conditions; line plots are individual patients. K) LZW dictionary size across conditions; line plots are individual patients. L) Number of observed unique microstates (dashed lines) during mild anesth. (light blue) or surgical anesth. (dark blue) vs. corresponding distributions of values from 100 randomized datasets, max-normalized for purpose of visualization. No overlap of observed vs. random data, equal to p<0.01; p½ represent patient ½ M) Number of co-active neurons versus the time spent by population in time points containing such co-activity per condition, displayed as mean across patients (thick lines). Thin lines represent conditions in individual patients. N) Maximum number of co-active neurons (as % of all neurons per exp.) participating in a specific microstate across conditions.

Similar articles

Cited by

References

    1. Afraz SR, Kiani R, and Esteky H (2006). Microstimulation of inferotemporal cortex influences face categorization. Nature 442, 692–695. - PubMed
    1. Barth AL, and Poulet JF (2012). Experimental evidence for sparse firing in the neocortex. Trends Neurosci 35, 345–355. - PubMed
    1. Barttfeld P, Uhrig L, Sitt JD, Sigman M, Jarraya B, and Dehaene S (2015). Signature of consciousness in the dynamics of resting-state brain activity. PNAS 112, 887–892. - PMC - PubMed
    1. Carrillo-Reid L, Han S, Yang W, Akrouh A, and Yuste R (2018). Triggering visually-guided behavior by holographic activation of pattern completion neurons in cortical ensembles. biorxiv, doi: 10.1101/394999 - DOI
    1. Castaigne P, Lhermitte F, Buge A, Escourolle R, Hauw JJ, and Lyon-Caen O (1981). Paramedian thalamic and midbrain infarct: clinical and neuropathological study. Ann Neurol 10, 127–148. - PubMed

Publication types

LinkOut - more resources