. 2019 Jul 1:322:96-102.
doi: 10.1016/j.jneumeth.2019.05.001. Epub 2019 May 2.

Quantification of movement in normal and parkinsonian macaques using video analysis

Affiliations

Quantification of movement in normal and parkinsonian macaques using video analysis

Michael Caiola et al. J Neurosci Methods. .

Abstract

Background: Quantification of spontaneous animal movement can be achieved using analysis of video recordings of the animals. Previous reports of video-based methods are based on outdated computer platforms or require the use of specialized equipment.

New method: We developed a video analysis algorithm to quantify movement based on the commonly used MATLAB programming language. The algorithm is based on pixel differences between frames of video footage acquired with a standard video camera.

Results: The new algorithm was validated, analyzing the amount of movements made by monkeys undergoing treatment with the dopaminergic neurotoxin 1-methyl-4-phenyl-1,2,3,6-tetrahydropyridine (MPTP) to induce parkinsonism. We compared the movement quantification generated by the new system of analysis with results obtained with a conventional infrared beam break counting system, a parkinsonism rating scale, and accelerometry-based motion quantification in three rhesus macaques. The information provided by our video analysis method was consistent with that obtained with the first two methods, and more detailed than the third.

Comparison with existing methods: The new method can replace other methods to quantify movement. Although other video analysis methods have been described, some have since been deprecated, or involve the use of specialized hardware. The new method provides a straightforward and fast approach of analyzing the amount of movement in caged experimental animals, using conventional off-the-shelf equipment and moderate computing resources.

Conclusions: This video analysis method provides an affordable, open access platform to quantify animal movement.

Keywords: Movement quantification; Nonhuman primates; Parkinsonism; Video-based movement analysis.


Figures

Fig 1.
Fig 1.
An example of ROI selection. Screenshot taken in the Matlab software during ROI selection. The blue rectangle flanked by the squares indicates the ROI selected for our analysis. We selected the entire cage, excluding objects around the cage.
Fig 2:
Fig 2:
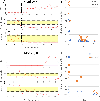
Assessment of movement before and during MPTP-induced parkinsonism, in monkey H (Fig. 2A-D) and monkey B (Fig. 2E-H). Sessions were separated by 1 to 7 days. A, E) Parkinsonism rating scale scores (PRS) assigned during MPTP treatment. B, F) Number of infrared light beam breaks generated by the monkey in the observation cage. The x-axis displays the number of sessions, where 11 and 9 indicate the first session during the MPTP treatment for monkeys H and B respectively. C, G) Movement score (m score) obtained using the video analysis. The medians for each session are indicated by red circles and line, while the zone between the 25th and 75th percentiles of the baseline values is denoted by the shaded yellow region between the dotted lines. The baseline period (session 1 to 10, monkey H, and sessions 1 to 8, monkey B) finishes at the vertical dashed line. D) Comparison of movement and beam breaks to the parkinsonism score. Blue symbols and lines represent median daily m scores while orange symbols and lines represent daily beam breaks.
Fig. 3:
Fig. 3:
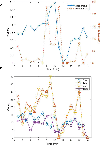
Movement detection using a collar mounted accelerometer and video analysis. A. Counts produced by a collar-mounted accelerometer during an 18 min observation epoch (red symbols and line, right y-axis) and video analysis m score of movements produced by the monkey during the same session (blue symbols and line, left y-axis). B. For the same session as shown in A, the lines indicate the number of movements of different body parts per minute, as recorded manually by a researcher using key presses to code each movement.
Fig 4:
Fig 4:
Comparison of frame-by-frame movement scores over a one-minute span during an observation session for monkey H (the minute corresponds to minute 2 in session 24 of Monkey H).

References

    1. Blesa J, Phani S, Jackson-Lewis V, Przedborski S. Classic and new animal models of Parkinson’s disease. J Biomed Biotechnol, 2012; 2012: 845618. - PMC - PubMed
    1. Brouillet E, Hantraye P, Ferrante RJ, Dolan R, Leroy-Willig A, Kowall NW, Beal MF. Chronic mitochondrial energy impairment produces selective striatal degeneration and abnormal choreiform movements in primates. Proc Natl Acad Sci U S A, 1995; 92: 7105–9. - PMC - PubMed
    1. Campos-Romo A, Ojeda-Flores R, Moreno-Briseno P, Fernandez-Ruiz J. Quantitative evaluation of MPTP-treated nonhuman parkinsonian primates in the HALLWAY task. J Neurosci Methods, 2009; 177: 361–8. - PubMed
    1. Chassain C, Eschalier A, Durif F. Assessment of motor behavior using a video system and a clinical rating scale in parkinsonian monkeys lesioned by MPTP. Journal of Neuroscience Methods, 2001; 111: 9–16. - PubMed
    1. Devergnas A, Pittard D, Bliwise D, Wichmann T. Relationship between oscillatory activity in the cortico-basal ganglia network and parkinsonism in MPTP-treated monkeys. Neurobiol Dis, 2014; 68: 156–66. - PMC - PubMed

Publication types

LinkOut - more resources