. 2019 Jul:55:116-135.
doi: 10.1016/j.media.2019.04.007. Epub 2019 Apr 18.

Flow network tracking for spatiotemporal and periodic point matching: Applied to cardiac motion analysis

Affiliations

Flow network tracking for spatiotemporal and periodic point matching: Applied to cardiac motion analysis

Nripesh Parajuli et al. Med Image Anal. 2019 Jul.

Abstract

The accurate quantification of left ventricular (LV) deformation/strain shows significant promise for quantitatively assessing cardiac function for use in diagnosis and therapy planning. However, accurate estimation of the displacement of myocardial tissue and hence LV strain has been challenging due to a variety of issues, including those related to deriving tracking tokens from images and following tissue locations over the entire cardiac cycle. In this work, we propose a point matching scheme where correspondences are modeled as flow through a graphical network. Myocardial surface points are set up as nodes in the network and edges define neighborhood relationships temporally. The novelty lies in the constraints that are imposed on the matching scheme, which render the correspondences one-to-one through the entire cardiac cycle, and not just two consecutive frames. The constraints also encourage motion to be cyclic, which an important characteristic of LV motion. We validate our method by applying it to the estimation of quantitative LV displacement and strain estimation using 8 synthetic and 8 open-chested canine 4D echocardiographic image sequences, the latter with sonomicrometric crystals implanted on the LV wall. We were able to achieve excellent tracking accuracy on the synthetic dataset and observed a good correlation with crystal-based strains on the in-vivo data.

Keywords: Echocardiography; Flow network; Motion; Neural networks.


Figures

Figure 1:
Figure 1:
Overall method outline.
Figure 2:
Figure 2:
Preprocessing steps for in vivo data to get endocardial and epicardial surface points.
Figure 3:
Figure 3:
Nodes, edges and other relationships in the network. The point sets are sampled from the myocardial surface sequence at each frame.
Figure 4:
Figure 4:
A node and different edges/flows visualized
Figure 5:
Figure 5:
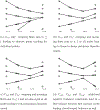
Outcomes of applying different constraints on 1D+t point sets, with points stacked vertically in space and horizontally in time.
Figure 6:
Figure 6:
Incoming and outgoing edges at a node.
Figure 7:
Figure 7:
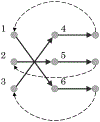
A simple flow network displaying the additional loop edges between the last frame and the first (not all shown) which helps us obtain closed-looped trajectories. The source node and edges are also shown.
Figure 8:
Figure 8:
An unlikely, but a valid scenario where balance and closed loop constraints are satisfied but the result is poor qualitatively.
Figure 9:
Figure 9:
Outcome of applying thresholding (of Pth = .3) on the edge weights.
Figure 10:
Figure 10:
Autoencoder network: A low dimensional embedding of image patches that captures images statistics is learned.
Figure 11:
Figure 11:
Synthetic data image example with endocardial and epicardial contours (normal data).
Figure 12:
Figure 12:
Sampling scheme.
Figure 13:
Figure 13:
MTE for all data, for different constraint setting. Cin, Cbal and Cloop were added incrementally.
Figure 14:
Figure 14:
MTE for all data, comparing different features. The same tracking method (FNT) was used for all of these.
Figure 15:
Figure 15:
MTE for all data, comparing different methods.
Figure 16:
Figure 16:
Radial strain curves in the basal, mid and apical area of the LV for the normal Leuven data (our method and ground truth). Curves indicating mean strains for anterior (Ant) antero-septal (Ant-Sept), infero-septal (Inf-Sept), inferior (Inf), infero-lateral (Inf-Lat) and antero-lateral (Ant-Lat) regions are shown.
Figure 17:
Figure 17:
Circumferential strain curves in the basal, mid and apical area of the LV for the normal Leuven data (our method and ground truth). Curves indicating mean strains for anterior (Ant) antero-septal (Ant-Sept), infero-septal (Inf-Sept), inferior (Inf), infero-lateral (Inf-Lat) and antero-lateral (Ant-Lat) regions are shown.
Figure 18:
Figure 18:
Longitudinal strain curves in the basal, mid and apical area of the LV for the normal Leuven data (our method and ground truth). Curves indicating mean strains for anterior (Ant) antero-septal (Ant-Sept), infero-septal (Inf-Sept), inferior (Inf), infero-lateral (Inf-Lat) and antero-lateral (Ant-Lat) regions are shown.
Figure 19:
Figure 19:
Radial strain curves in the basal, mid and apical area of the LV for the LADPROX Leuven data (our method and ground truth). Curves indicating mean strains for anterior (Ant) antero-septal (Ant-Sept), infero-septal (Inf-Sept), inferior (Inf), infero-lateral (Inf-Lat) and antero-lateral (Ant-Lat) regions are shown.
Figure 20:
Figure 20:
Radial strain curves in the basal, mid and apical area of the LV for the RCA Leuven data (our method and ground truth). Curves indicating mean strains for anterior (Ant) antero-septal (Ant-Sept), infero-septal (Inf-Sept), inferior (Inf), infero-lateral (Inf-Lat) and antero-lateral (Ant-Lat) regions are shown.
Figure 21:
Figure 21:
Epicardial surfaces displaying radial strains for three different types of ischemia, induced by occlusion at left anterior descending artery (LADPR0X), right coronary artery (RCA) and left circumflex artery (LCX).
Figure 22:
Figure 22:
Example of in vivo images and segmentation contours in one image sequence. I1, I2 and I3 are three images in the systolic cycle.
Figure 23:
Figure 23:
Crystals and their relative position in the LV
Figure 24:
Figure 24:
Components of the elementary tetrahedron.
Figure 25:
Figure 25:
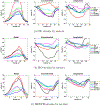
FNT and crystal strains in BL condition for a data across the 3 cubic regions (ISC, BOR and REM top to bottom) for 1 dataset. Radial (red), circumferential (cyan) and longitudinal (green) strains from left to right.
Figure 26:
Figure 26:
FNT and crystal strains in HO condition for a data across the 3 cubic regions (ISC, BOR and REM top to bottom) for 1 dataset. Radial (red), circumferential (cyan) and longitudinal (green) strains from left to right.
Figure 27:
Figure 27:
FNT and crystal strains in HODOB condition for a data across the 3 cubic regions (ISC, BOR and REM top to bottom) for 1 dataset. Radial (red), circumferential (cyan) and longitudinal (green) strains from left to right.
Figure 28:
Figure 28:
Peak strain bar graphs (with median and IQR) for radial (top), circumferential (middle) and longitudinal (bottom) strains at BL, HO and HODOB - shown across ISC, BOR and REM regions for echo and crystal-based strains.
Figure 29:
Figure 29:
Radial, circumferential and longitudinal strains across 6 sectors along the mid-LV slice. BL, HO and HODOB conditions show expected behavior. The sectors are - anterior (Ant), antero-lateral (Ant-Lat), infero-lateral (Inf-Lat), inferior (Inf), infero-septal (Inf-Sept) and antero-septal (Ant-Sept).

References

    1. Alessandrini M, De Craene M, Bernard O, Giffard-Roisin S, Allain P, Waechter-Stehle I, Weese J, Saloux E, Delingette H, Sermesant M, et al., 2015. A pipeline for the generation of realistic 3d synthetic echocardiographic sequences: methodology and open-access database. IEEE transactions on medical imaging 34, 1436–1451. - PubMed
    1. ApS, M., 2014. The MOSEK optimization toolbox for MATLAB manual. Version 7.0. http://docs.mosek.com/7.0/toolbox/index.html.
    1. Belongie S, Malik J, Puzicha J, 2000. Shape context: A new descriptor for shape matching and object recognition, in: NIPS, p. 3.
    1. Benjamin EJ, Blaha MJ, Chiuve SE, Cushman M, Das SR, Deo R, de Ferranti SD, Floyd J, Fornage M, Gillespie C, et al., 2017. Heart disease and stroke statistics - 2017 update: a report from the american heart association. Circulation 135, e146–e603. - PMC - PubMed
    1. Berclaz J, Fleuret F, Turetken E, Fua P, 2011. Multiple object tracking using k-shortest paths optimization. IEEE transactions on pattern analysis and machine intelligence 33, 1806–1819. - PubMed

Publication types