

Combined Signature of the Fecal Microbiome and Plasma Metabolome in Patients with Ulcerative Colitis
- PMID: 31055592
- PMCID: PMC6515979
- DOI: 10.12659/MSM.916009
Combined Signature of the Fecal Microbiome and Plasma Metabolome in Patients with Ulcerative Colitis
Abstract
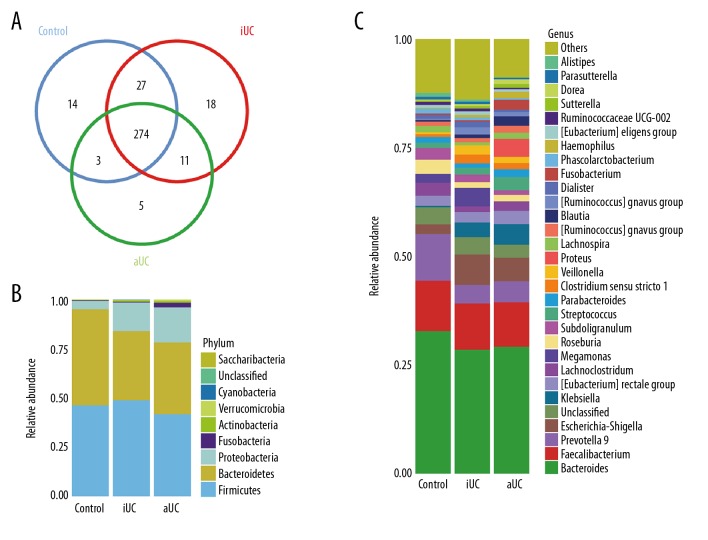
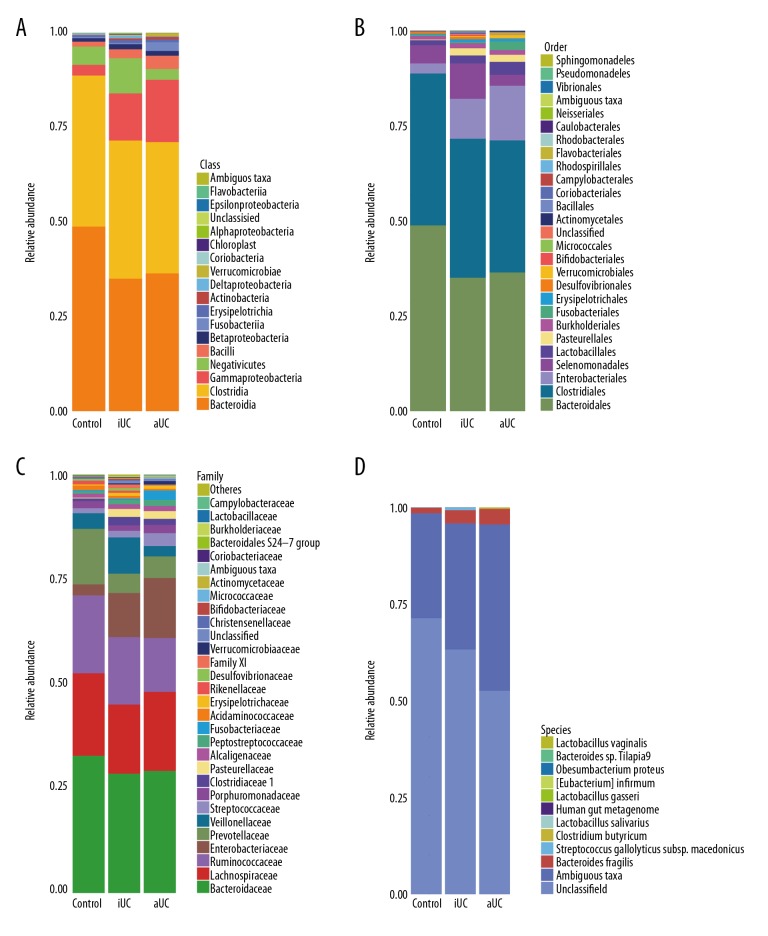
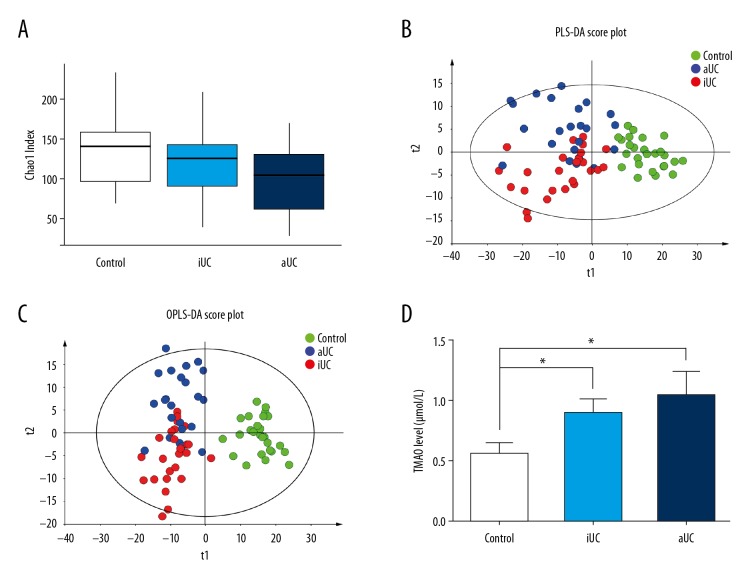
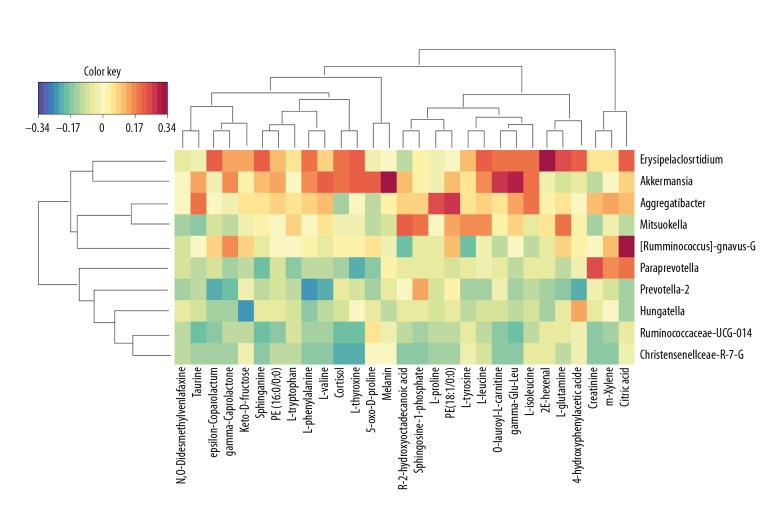
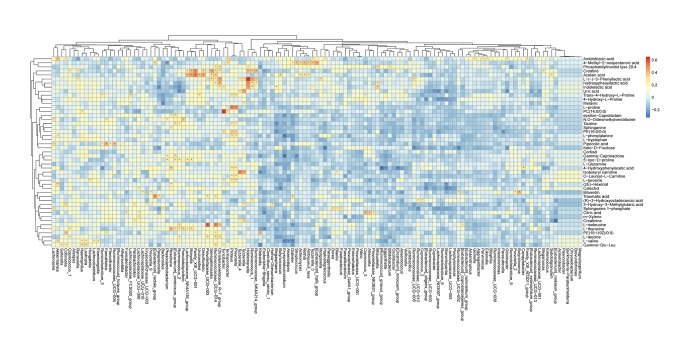
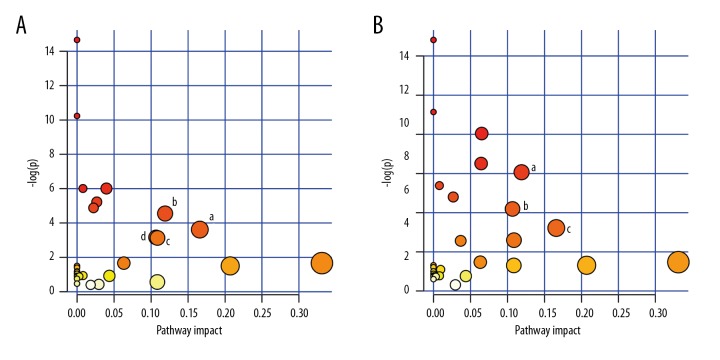
BACKGROUND Ulcerative colitis is a chronic, idiopathic inflammatory disease that destroys the colon structure. Nevertheless, the exact pathogenesis is not clear and needs to be fully elucidated. MATERIAL AND METHODS Stool and plasma samples were used for 16S ribosomal RNA sequencing and liquid chromatography mass spectrometry, respectively. In addition, we detected the level of trimethylamine N-oxide. Finally, we performed Pearson correlation analysis between the microbiome and the metabolome. RESULTS Twenty-three active ulcerative colitis, 25 inactive ulcerative colitis, and 30 control cases were included. Thirty-four significantly different metabolites were found between the active ulcerative colitis and control groups, 38 were found between the inactive ulcerative colitis and control groups, and only 1 was found between the active ulcerative colitis and inactive ulcerative colitis groups. The plasma trimethylamine N-oxide level of the inactive ulcerative colitis and active ulcerative colitis groups was significantly higher than that of the control group. Moreover, we identified significant changes in 24, 18, and 12 bacterial genera for active ulcerative colitis-control, inactive ulcerative colitis-control, and active ulcerative colitis-inactive ulcerative colitis, respectively. Cross-correlation indicated an association between sphingosine 1-phosphate and Roseburia, Klebsiella, and Escherichia-Shigella. Through the pathway analysis, we found sphingolipid metabolism was one of the most significantly increased pathways. CONCLUSIONS Although levels of trimethylamine N-oxide were higher in ulcerative colitis patients, they did not achieve statistical significance in active ulcerative colitis and inactive ulcerative colitis groups. Sphingosine 1-phosphate was increased in ulcerative colitis patients and there were several microbiota associated with it. Although further study is still needed, sphingosine 1-phosphate will probably become a new target for treatment of ulcerative colitis.
Conflict of interest statement
None.
Figures
References
-
- Becker C, Neurath MF, Wirtz S. The intestinal microbiota in inflammatory bowel disease. ILAR J. 2015;56:192–204. - PubMed
-
- Ananthakrishnan AN. Epidemiology and risk factors for IBD. Nat Rev Gastroenterol Hepatol. 2015;12:205. - PubMed
-
- Molodecky NA, Soon IS, Rabi DM, et al. Increasing incidence and prevalence of the inflammatory bowel diseases with time, based on systematic review. Gastroenterology. 2015;142:46–54. e42. - PubMed
-
- Wong SH, Ng SC. What can we learn from inflammatory bowel disease in developing countries? Curr Gastroenterol Rep. 2013;15:313. - PubMed
MeSH terms
Substances
LinkOut - more resources
Full Text Sources
Medical
