

Assessing the potential impact of vector-borne disease transmission following heavy rainfall events: a mathematical framework
- PMID: 31056044
- PMCID: PMC6553605
- DOI: 10.1098/rstb.2018.0272
Assessing the potential impact of vector-borne disease transmission following heavy rainfall events: a mathematical framework
Abstract
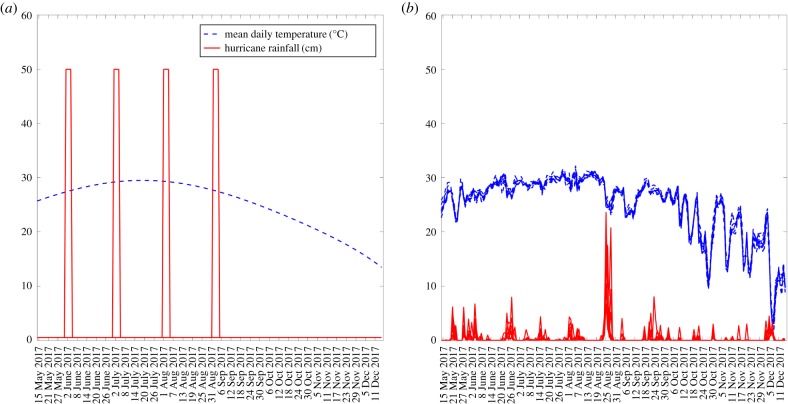
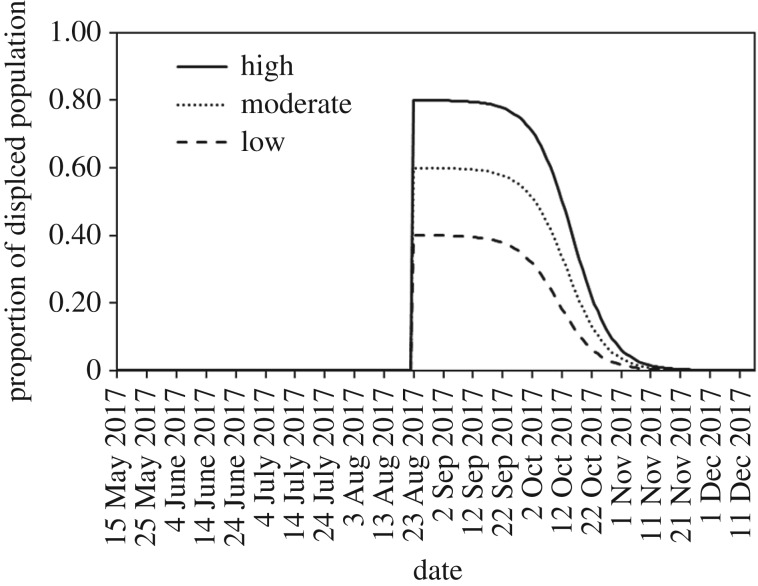
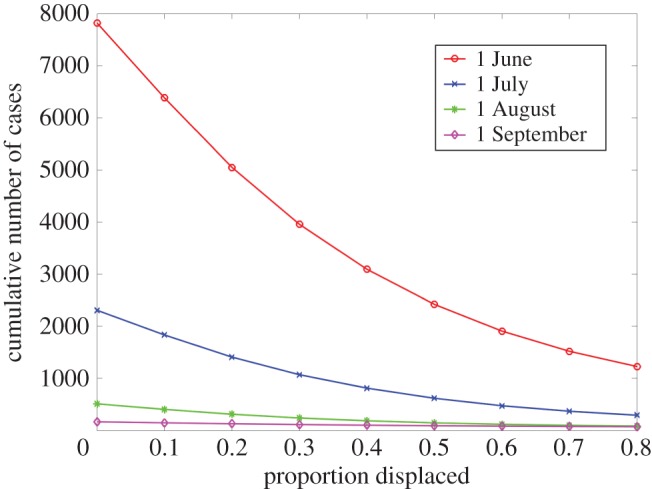
Predicting the impact of natural disasters such as hurricanes on the transmission dynamics of infectious diseases poses significant challenges. In this paper, we put forward a simple modelling framework to investigate the impact of heavy rainfall events (HREs) on mosquito-borne disease transmission in temperate areas of the world such as the southern coastal areas of the USA. In particular, we explore the impact of the timing of HREs relative to the transmission season via analyses that test the sensitivity of HRE-induced epidemics to variation in the effects of rainfall on the dynamics of mosquito breeding capacity, and the intensity and temporal profile of human population displacement patterns. The recent Hurricane Harvey in Texas motivates the simulations reported. Overall, we find that the impact of vector-borne disease transmission is likely to be greater the earlier the HREs occur in the transmission season. Simulations based on data for Hurricane Harvey suggest that the limited impact it had on vector-borne disease transmission was in part because of when it occurred (late August) relative to the local transmission season, and in part because of the mitigating effect of the displacement of people. We also highlight key data gaps related to models of vector-borne disease transmission in the context of natural disasters. This article is part of the theme issue 'Modelling infectious disease outbreaks in humans, animals and plants: approaches and important themes'. This issue is linked with the subsequent theme issue 'Modelling infectious disease outbreaks in humans, animals and plants: epidemic forecasting and control'.
Keywords: climate change; heavy rainfall event; mathematical model; mosquito-borne disease; transmission dynamics; vector-borne disease.
Conflict of interest statement
We declare we have no competing interests.
Figures
Similar articles
-
Harris County Public Health Mosquito and Vector Control Division Emergency Response to Hurricane Harvey: Vector-Borne Disease Surveillance and Control.J Am Mosq Control Assoc. 2020 Jun 1;36(2s):15-27. doi: 10.2987/19-6890.1. J Am Mosq Control Assoc. 2020. PMID: 33647149
-
Urbanization exacerbated the rainfall and flooding caused by hurricane Harvey in Houston.Nature. 2018 Nov;563(7731):384-388. doi: 10.1038/s41586-018-0676-z. Epub 2018 Nov 14. Nature. 2018. PMID: 30429551
-
Climate predicts geographic and temporal variation in mosquito-borne disease dynamics on two continents.Nat Commun. 2021 Feb 23;12(1):1233. doi: 10.1038/s41467-021-21496-7. Nat Commun. 2021. PMID: 33623008 Free PMC article.
-
Modelling climate change and malaria transmission.Adv Exp Med Biol. 2010;673:184-99. doi: 10.1007/978-1-4419-6064-1_13. Adv Exp Med Biol. 2010. PMID: 20632538 Review.
-
Mosquito species identity matters: unraveling the complex interplay in vector-borne diseases.Infect Dis (Lond). 2024 Sep;56(9):685-696. doi: 10.1080/23744235.2024.2357624. Epub 2024 May 25. Infect Dis (Lond). 2024. PMID: 38795138 Review.
Cited by
-
Assessing the effects of disasters and their aftermath on pregnancy and infant outcomes: A conceptual model.Int J Disaster Risk Reduct. 2021 Aug;62:102415. doi: 10.1016/j.ijdrr.2021.102415. Epub 2021 Jun 24. Int J Disaster Risk Reduct. 2021. PMID: 34336567 Free PMC article.
-
Social Media Mining Toolkit (SMMT).Genomics Inform. 2020 Jun;18(2):e16. doi: 10.5808/GI.2020.18.2.e16. Epub 2020 Jun 15. Genomics Inform. 2020. PMID: 32634870 Free PMC article.
-
Joint extremes in precipitation and infectious disease in the USA: A bivariate POT study.One Health. 2023 Oct 4;17:100636. doi: 10.1016/j.onehlt.2023.100636. eCollection 2023 Dec. One Health. 2023. PMID: 38024276 Free PMC article.
-
Lessons from One Fastidious Bacterium to Another: What Can We Learn about Liberibacter Species from Xylella fastidiosa.Insects. 2019 Sep 16;10(9):300. doi: 10.3390/insects10090300. Insects. 2019. PMID: 31527458 Free PMC article. Review.
-
Change in emotional distress, anxiety, depression and PTSD from pre- to post-flood exposure in women residing in low-income settings in South Africa.Arch Womens Ment Health. 2024 Apr;27(2):201-218. doi: 10.1007/s00737-023-01384-3. Epub 2023 Nov 22. Arch Womens Ment Health. 2024. PMID: 37989799 Free PMC article.
References
-
- Melillo JM, Richmond T, Yohe GW (eds) 2014. Climate change impacts in the United States: the third national climate assessment. U.S. Global Change Research Program. (10.7930/j0z31wj2) - DOI
-
- Wendelbo M. 2018. 3 reasons why the U.S. is vulnerable to big disaster. The Conversation. See https://theconversation.com/3-reasons-why-the-us-is-vulnerable-to-big-di....
