. 2019 Jun 24;374(1775):20180268.
doi: 10.1098/rstb.2018.0268.

Quantifying the seasonal drivers of transmission for Lassa fever in Nigeria

Affiliations

Quantifying the seasonal drivers of transmission for Lassa fever in Nigeria

Andrei R Akhmetzhanov et al. Philos Trans R Soc Lond B Biol Sci. .

Abstract

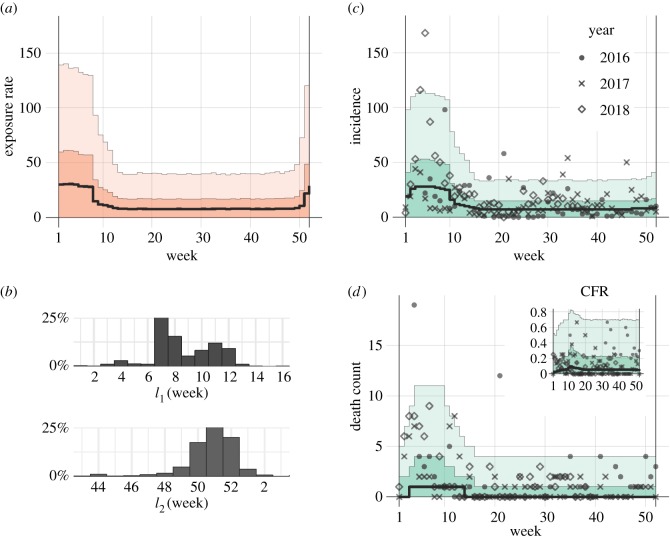
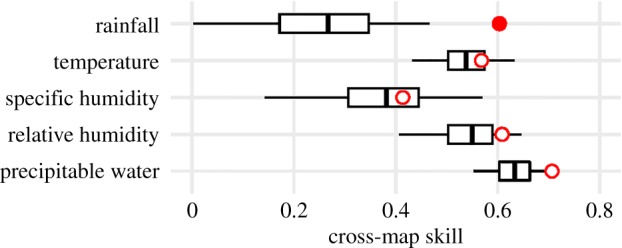
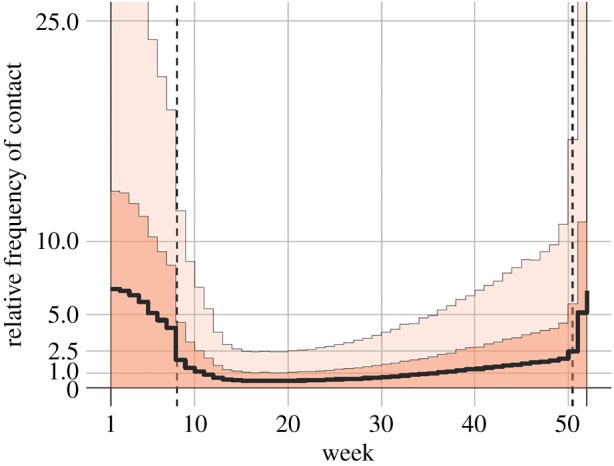
Lassa fever (LF) is a zoonotic disease that is widespread in West Africa and involves animal-to-human and human-to-human transmission. Animal-to-human transmission occurs upon exposure to rodent excreta and secretions, i.e. urine and saliva, and human-to-human transmission occurs via the bodily fluids of an infected person. To elucidate the seasonal drivers of LF epidemics, we employed a mathematical model to analyse the datasets of human infection, rodent population dynamics and climatological variations and capture the underlying transmission dynamics. The surveillance-based incidence data of human cases in Nigeria were explored, and moreover, a mathematical model was used for describing the transmission dynamics of LF in rodent populations. While quantifying the case fatality risk and the rate of exposure of humans to animals, we explicitly estimated the corresponding contact rate of humans with infected rodents, accounting for the seasonal population dynamics of rodents. Our findings reveal that seasonal migratory dynamics of rodents play a key role in regulating the cyclical pattern of LF epidemics. The estimated timing of high exposure of humans to animals coincides with the time shortly after the start of the dry season and can be associated with the breeding season of rodents in Nigeria. This article is part of the theme issue 'Modelling infectious disease outbreaks in humans, animals and plants: approaches and important themes'. This issue is linked with the subsequent theme issue 'Modelling infectious disease outbreaks in humans, animals and plants: epidemic forecasting and control'.

Keywords: Arenaviridae; Lassa haemorrhagic fever; multimammate rat; reservoir host; seasonality.


Conflict of interest statement

We declare that we have no conflict of interest.

Figures

Figure 1.
Figure 1.
Temporal distribution of Lassa fever incidence in Nigeria, 2016–2018. (a) Fitted exposure rate as a function of the calendar week in a given year. (b) Posterior distribution for the time boundaries of high-/low-risk exposure periods. (c,d) Model fit to the observed data of new cases and fatal cases. Inset in (d) shows the expected case fatality risk (CFR). Solid black line indicates the median estimate, whereas light and dark shaded areas in (a,c,d) indicate 95 and 50% credible intervals for posterior estimates, respectively. (Online version in colour.)
Figure 2.
Figure 2.
Cross-map causality for shared seasonality of environmental variables with the Lassa fever incidence. Red circles show the unlagged cross-map skill. Box-plots show null distributions for cross-map skill expected from random surrogate time series that share the same seasonality as the true environmental variable. The single filled circle indicates that the measured causality is significantly better than the null expectation (p < 0.01). As for the use of convergent cross-mapping, please see literature [20,21]. (Online version in colour.)
Figure 3.
Figure 3.
Contact frequency of humans with infected rodents. Dashed vertical lines show the time boundaries separating the high-risk period from the low-risk period. The average contact frequency in the low-risk exposure period was set to 1. Solid black line indicates the median estimate, whereas light and dark shaded areas indicate 95 and 50% credible intervals for posterior estimates, respectively. (Online version in colour.)

Similar articles

Cited by

References

    1. Khan SH, et al. 2008. New opportunities for field research on the pathogenesis and treatment of Lassa fever. Antiviral Res. 78, 103–115. (10.1016/j.antiviral.2007.11.003) - DOI - PubMed
    1. Yun NE, Walker DH. 2012. Pathogenesis of Lassa fever. Viruses 4, 2031–2048. (10.3390/v4102031) - DOI - PMC - PubMed
    1. Andersen KG, et al. 2015. Clinical sequencing uncovers origins and evolution of Lassa virus. Cell 162, 738–750. (10.1016/j.cell.2015.07.020) - DOI - PMC - PubMed
    1. Fichet-Calvet E, Ölschläger S, Strecker T, Koivogui L, Becker-Ziaja B, Camara AB, Soropogui B, Magassouba N, Günther S. 2016. Spatial and temporal evolution of Lassa virus in the natural host population in Upper Guinea. Sci. Rep. 6, 21977 (10.1038/srep21977) - DOI - PMC - PubMed
    1. Childs JE, Mills JN, Glass GE. 1995. Rodent-borne hemorrhagic fever viruses: a special risk for mammalogists? J. Mammal. 76, 664–680. (10.2307/1382739) - DOI

Publication types

LinkOut - more resources