. 2019 May 14;12(5):1113-1128.
doi: 10.1016/j.stemcr.2019.04.008. Epub 2019 May 2.

De Novo DNA Methylation at Imprinted Loci during Reprogramming into Naive and Primed Pluripotency

Affiliations

De Novo DNA Methylation at Imprinted Loci during Reprogramming into Naive and Primed Pluripotency

Masaki Yagi et al. Stem Cell Reports. .

Abstract

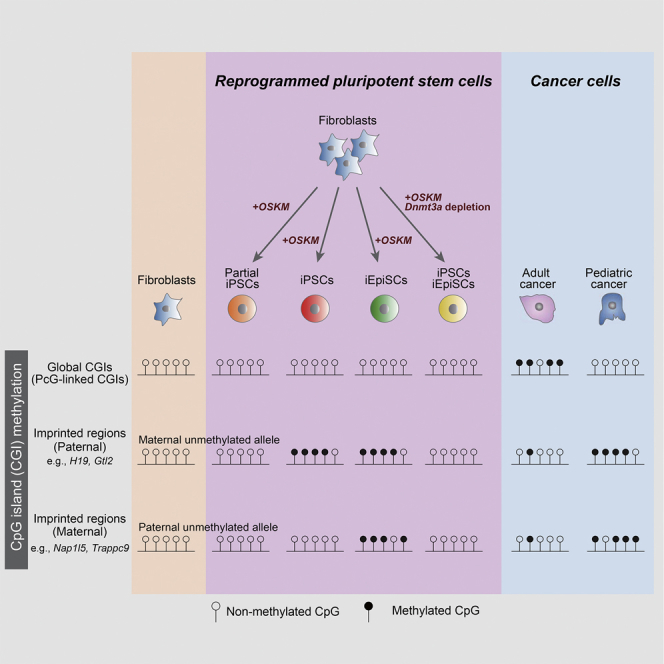
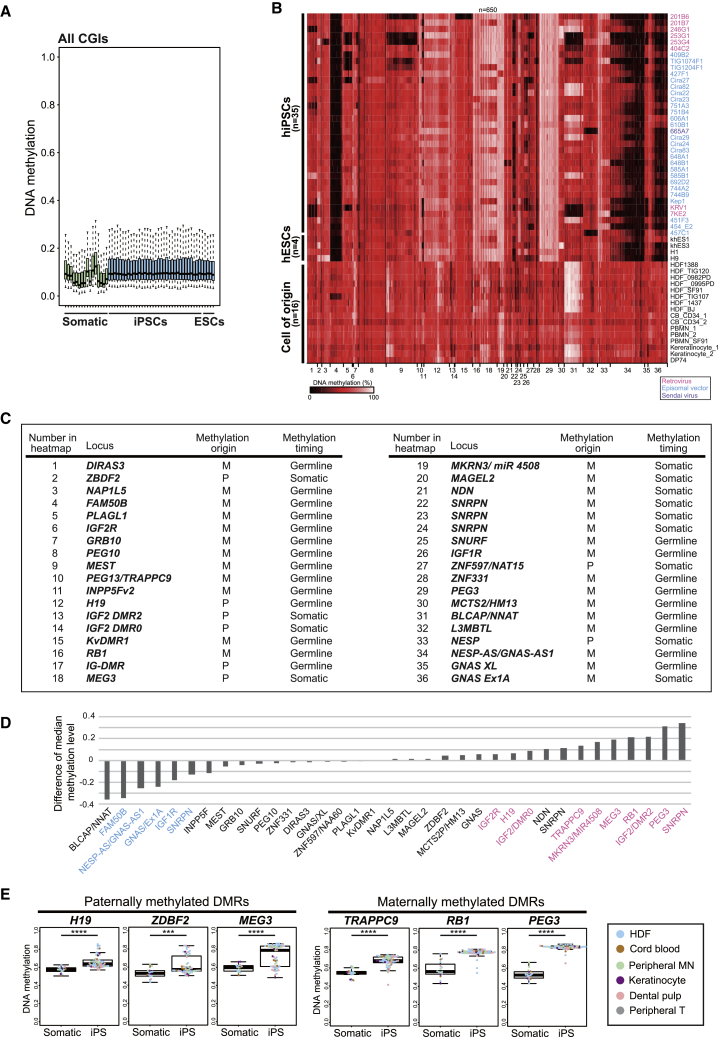
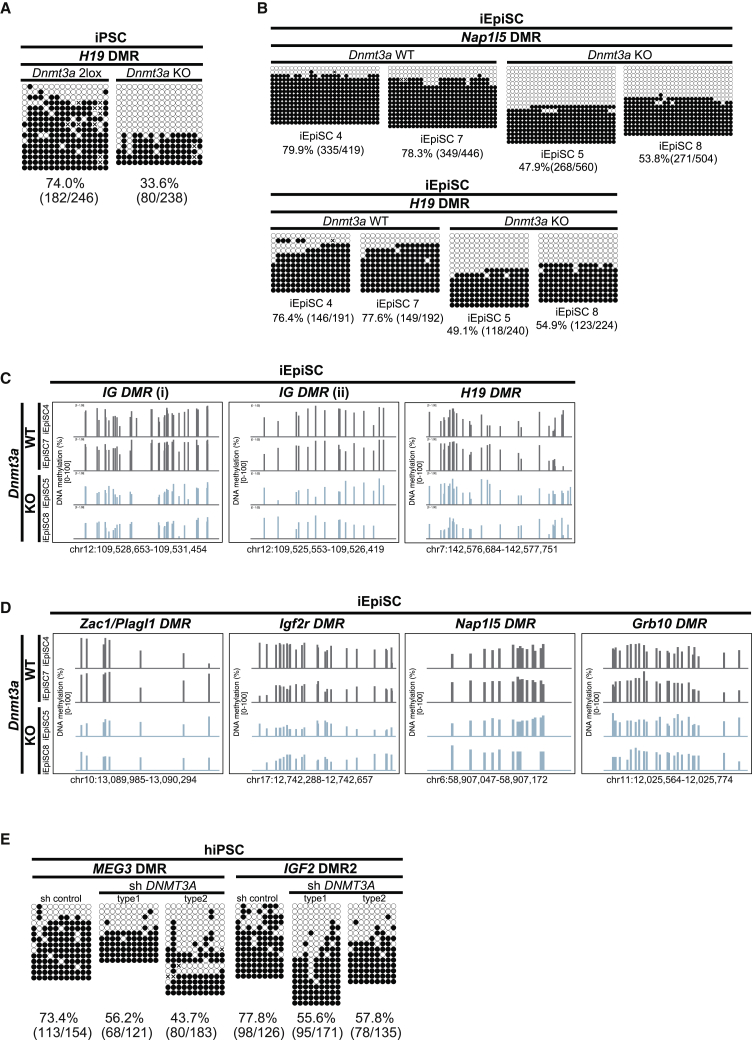
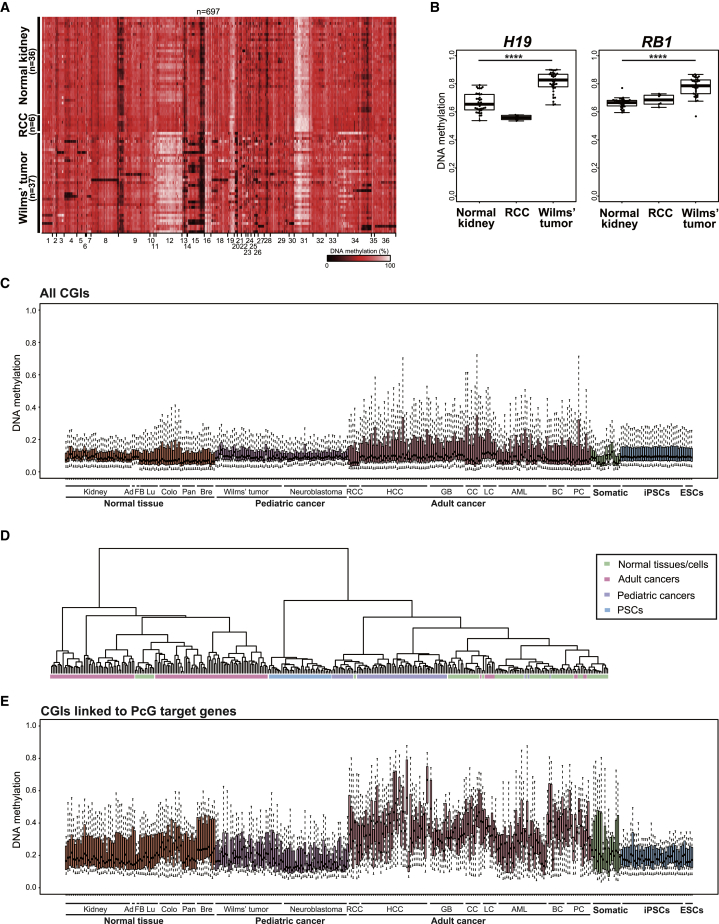
CpG islands (CGIs) including those at imprinting control regions (ICRs) are protected from de novo methylation in somatic cells. However, many cancers often exhibit CGI hypermethylation, implying that the machinery is impaired in cancer cells. Here, we conducted a comprehensive analysis of CGI methylation during somatic cell reprogramming. Although most CGIs remain hypomethylated, a small subset of CGIs, particularly at several ICRs, was often de novo methylated in reprogrammed pluripotent stem cells (PSCs). Such de novo ICR methylation was linked with the silencing of reprogramming factors, which occurs at a late stage of reprogramming. The ICR-preferred CGI hypermethylation was similarly observed in human PSCs. Mechanistically, ablation of Dnmt3a prevented PSCs from de novo ICR methylation. Notably, the ICR-preferred CGI hypermethylation was observed in pediatric cancers, while adult cancers exhibit genome-wide CGI hypermethylation. These results may have important implications in the pathogenesis of pediatric cancers and the application of PSCs.

Keywords: CpG islands; DNA methylation; Dnmt3a; genomic imprinting; naive and primed pluripotency; pediatric cancers; pluripotent stem cells; reprogramming.


Figures

None
Graphical abstract
Figure 1
Figure 1
Establishment of Naive and Primed Mouse PSCs and CGI Methylation Analysis (A) Schematic diagram of the experimental design. Generation of naive and primed PSCs derived directly from embryos or from somatic cells by reprogramming. Parental alleles can be distinguished by SNPs in (129X1/SvJ × MSM/Ms) F1 cells. (B) Representative images of naive and primed PSCs (ESCs, EpiSCs, iPSCs, iEpiSCs). Scale bars, 100 μm. (C) An image of mouse partial iPSCs. The mCherry signal represents the expression of the OSKM transgene. The transgene is not silenced in iPSC 9. Scale bars, 100 μm. (D) Principal component (PC1 and PC2) analysis of transcriptional profiles by RNA-seq. (E) Hierarchical clustering analysis of the global DNA methylation status by MethylC-seq. (F) Box plot of DNA methylation levels at all CGIs in MEFs, ESCs, EpiSCs, iPSCs, and iEpiSCs. Solid lines in each box indicate the median. The bottom and top of the boxes are lower and upper quartiles, respectively. Whiskers extend to ±1.5 interquartile range (IQR). (G) Venn diagram of CGIs with increased DNA methylation in PSCs compared with MEFs (DNA methylation difference >0.2). Number in parentheses indicates the number of CGIs linked to ICR. Note that ICR-linked CGIs are enriched in reprogrammed PSC-specific methylated CGIs. p < 0.05, ∗∗∗p < 0.001, and ∗∗∗∗p < 0.0001 (Fisher's test). (H) Box plot of DNA methylation levels at unmethylated alleles in ICRs in MEFs, ESCs, EpiSCs, iPSCs, and iEpiSCs. Solid lines in each box indicate the median. The bottom and top of the boxes are lower and upper quartiles, respectively. Whiskers extend to ±1.5 IQR. (I) DNA methylation levels at unmethylated alleles in paternal and maternal ICRs in MEFs, ESCs, EpiSCs, iPSCs, and iEpiSCs.
Figure 2
Figure 2
DNA Methylation of ICRs during Reprogramming to Naive and Primed Pluripotency in Mice (A) Heatmap for DNA methylation levels and allelic balance at ICRs in MEFs, ESCs, EpiSCs, iPSCs, and iEpiSCs. The heatmap depicts the methylation status at CpG sites in which parental alleles have been distinguished. CpG methylation levels and allelic balance for the methylation are shown for each CpG site. Color scale is shown for DNA methylation levels and allelic balance. (B) CpG methylation at representative ICRs of MEFs, ESCs, EpiSCs, iPSCs, and iEpiSCs. Each black dot represents a methylation percentage for each CpG site. Red and blue dots indicate methylation levels at maternal 129 allele and paternal MSM allele, respectively.
Figure 3
Figure 3
De Novo ICR Methylation Occurs at the Late Stage of Somatic Cell Reprogramming (A) Schematic diagram of the experimental design. Partial iPSC 9 cells were passaged three times, and mCherry-negative/-positive cells (p7) were sorted by fluorescence-activated cell sorting for expression analysis and DNA methylation analysis. Successful sorting was confirmed after expansion of sorted cells. Scale bars, 100 μm. (B) DNA methylation analysis at H19 DMR and Gtl2 DMR in mCherry-positive and mCherry-negative iPSCs (clones 9, 21, 37) by conventional bisulfite sequencing. Open circles represent unmethylated CpGs and closed circles represent methylated CpGs. Crosses indicate undermined methylation status. (C) DNA methylation at ICRs in preimplantation embryos. Note that ICMs exhibit reduced methylation levels at Gnas_1A ICR, while methylation levels are not altered at H19 or Impact ICRs. WGBS data of ICMs were obtained from GEO: GSE84236. MethylC-seq data of MEFs from our previous study (Yagi et al., 2017a) were used (GEO: GSE84165). (D) Allelic expression analysis of Igf2 in MEFs and iPSCs. iPSCs exhibit biallelic expression of Igf2, which is consistent with biallelic methylation at H19 DMR in these cells. Red and blue indicate maternal and paternal alleles, respectively. Numbers in the pie chart display numbers of the subcloned allele. (E) Establishment of iPSC-derived secondary MEFs by blastocyst injection. iPSC-derived MEFs were selected by neomycin treatment for 7 days. (F) DNA methylation analysis of H19 DMR in iPSC-derived MEFs by conventional bisulfite sequencing. (G) Allelic expression analysis of Igf2 in iPSC-derived MEFs. Biallelic expression of Igf2 is detectable in iPSC-derived MEFs. Red and blue indicate maternal and paternal alleles, respectively. Numbers in the pie chart display numbers of the subcloned allele.
Figure 4
Figure 4
Variable ICR Methylation Aberrations in Human PSCs (A) Box plot of DNA methylation levels at all CGIs in human somatic cells and PSCs. Solid lines in each box indicate the median. The bottom and top of the boxes are lower and upper quartiles, respectively. Whiskers extend to ±1.5 IQR. Infinium 450K data of human somatic cells and PSCs were obtained from GEO: GSE60821 and GSE60923. (B) Heatmap for DNA methylation levels at imprinted DMRs in human iPSCs (hiPSCs), human ESCs (hESCs), and various somatic cells of origin for hiPSCs. Color scale is shown for DNA methylation levels. Infinium 450K data of 35 hiPSC lines (20 male lines and 15 female lines), 4 hESCs, and 16 somatic cells were obtained from GEO: GSE60821 and GSE60923. Names of the hPSC lines are shown at the right of the panel. Colors depict the methods of reprogramming. HDF, human dermal fibroblasts; CB, cord blood cells; PBMN, peripheral blood mononuclear cells; DP, dental pulp cells. (C) List of 36 human imprinted DMRs shown in (A) (Court et al., 2014). Origin (maternal or paternal allele) and timing (germline or somatic) of methylation are shown for each DMR. IG-DMR (17) is not considered in further analyses because the probes of Infinium 450K are not designed at IG-DMR. (D) Difference of median methylation levels at the 35 imprinted DMRs between hiPSCs and somatic cells. The median methylation levels of the 35 iPSC lines and 16 somatic cells in (B) are compared. Hypermethylated DMRs (false discovery rate [FDR] <0.01, median methylation in iPSCs >60%) and hypomethylated DMRs (FDR <0.01, median methylation in iPSCs <40%) are shown in pink and blue, respectively. (E) Box plots of DNA methylation levels at representative paternal and maternal imprinted DMRs in human iPSCs. Solid lines in each box indicate the median. The bottom and top of the boxes are lower and upper quartiles, respectively. Whiskers extend to ±1.5 IQR. Each color in the boxes represents a cell of origin. ∗∗∗p < 0.001 and ∗∗∗∗p < 0.0001 (Mann-Whitney U test).
Figure 5
Figure 5
Dnmt3a Mediates Reprogramming-Associated De Novo ICR Methylation in Mice and Humans (A) DNA methylation status at H19 DMR by conventional bisulfite sequencing in Dnmt3a control (2lox) and KO iPSCs. (B) DNA methylation status at Nap1l5 DMR and H19 DMR by conventional bisulfite sequencing in Dnmt3a wild-type (WT) and null (KO) iEpiSCs. (C) DNA methylation status at paternally methylated DMRs in Dnmt3a wild-type (WT) and null (KO) iEpiSCs. Each bar indicates a CpG site, and bar height represents methylation percentage (0%–100%) by MethylC-seq. (D) DNA methylation status at maternally methylated DMRs in Dnmt3a wild-type (WT) and null (KO) iEpiSCs. Each bar indicates a CpG site, and bar height represents methylation percentage (0%–100%) by MethylC-seq. (E) DNA methylation status at MEG3 DMR and IGF2 DMR2 by conventional bisulfite sequencing in hiPSCs established with DNMT3A short hairpin RNA (shRNA) and control shRNA treatment.
Figure 6
Figure 6
Pediatric Cancers Exhibit Hypermethylation at ICRs but Not at Global CGIs (A) Heatmap for DNA methylation levels at imprinted DMRs in human normal kidney samples, renal cell carcinomas (RCC), and Wilms' tumors. Color scale is shown for DNA methylation levels. Infinium 450K data of normal kidney tissues and Wilms' tumors were obtained from GEO: GSE59157. Those of RCCs were obtained from GEO: GSE70303. (B) Box plots of DNA methylation levels at representative hypermethylated imprinted DMRs in Wilms' tumors. Solid lines in each box indicate the median. The bottom and top of the boxes are lower and upper quartiles, respectively. Whiskers extend to ±1.5 IQR. Note that H19 DMR and RB1 DMR are hypermethylated in Wilms' tumor but not in normal kidney or RCC. ∗∗∗∗p < 0.0001 (Mann-Whitney U test). (C) Box plot of DNA methylation levels at all CGIs in normal tissues, pediatric cancers, adult cancers, somatic cells, and PSCs. Solid lines in each box indicate the median. The bottom and top of the boxes are lower and upper quartiles, respectively. Whiskers extend to ±1.5 IQR. Note that increased CGI methylation is observed in adult cancers but not in pediatric cancers. Data of somatic cells and PSCs are the same as in Figure 4A. (D) Hierarchical clustering analysis based on the methylation status at all CGIs. (E) Box plot of DNA methylation levels at CGIs linked to PcG target genes (Lee et al., 2006) in normal tissues, pediatric cancers, adult cancers, somatic cells, and PSCs. Solid lines in each box indicate the median. The bottom and top of the boxes are lower and upper quartiles, respectively. Whiskers extend to ±1.5 IQR.

Similar articles

Cited by

References

    1. Bar S., Schachter M., Eldar-Geva T., Benvenisty N. Large-scale analysis of loss of imprinting in human pluripotent stem cells. Cell Rep. 2017;19:957–968. - PubMed
    1. Bourc'his D., Xu G.L., Lin C.S., Bollman B., Bestor T.H. Dnmt3L and the establishment of maternal genomic imprints. Science. 2001;294:2536–2539. - PubMed
    1. Branco M.R., Oda M., Reik W. Safeguarding parental identity: Dnmt1 maintains imprints during epigenetic reprogramming in early embryogenesis. Genes Dev. 2008;22:1567–1571. - PMC - PubMed
    1. Choi J., Clement K., Huebner A.J., Webster J., Rose C.M., Brumbaugh J., Walsh R.M., Lee S., Savol A., Etchegaray J.P. DUSP9 modulates DNA hypomethylation in female mouse pluripotent stem cells. Cell Stem Cell. 2017;20:706–719.e7. - PMC - PubMed
    1. Choi J., Huebner A.J., Clement K., Walsh R.M., Savol A., Lin K., Gu H., Di Stefano B., Brumbaugh J., Kim S.Y. Prolonged Mek1/2 suppression impairs the developmental potential of embryonic stem cells. Nature. 2017;548:219–223. - PMC - PubMed

Publication types