. 2019 Jan-Dec:18:1534735419848047.
doi: 10.1177/1534735419848047.

Breast Tumor Cells Highly Resistant to Drugs Are Controlled Only by the Immune Response Induced in an Immunocompetent Mouse Model

Affiliations

Breast Tumor Cells Highly Resistant to Drugs Are Controlled Only by the Immune Response Induced in an Immunocompetent Mouse Model

Paola Lasso et al. Integr Cancer Ther. 2019 Jan-Dec.

Abstract

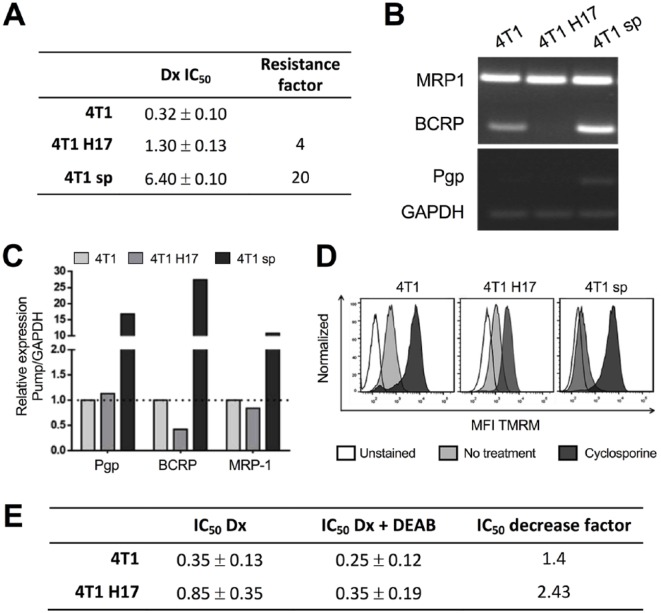
Background: The tumor cells responsible for metastasis are highly resistant to chemotherapy and have characteristics of stem cells, with a high capacity for self-regeneration and the use of detoxifying mechanisms that participate in drug resistance. In vivo models of highly resistant cells allow us to evaluate the real impact of the immune response in the control of cancer.

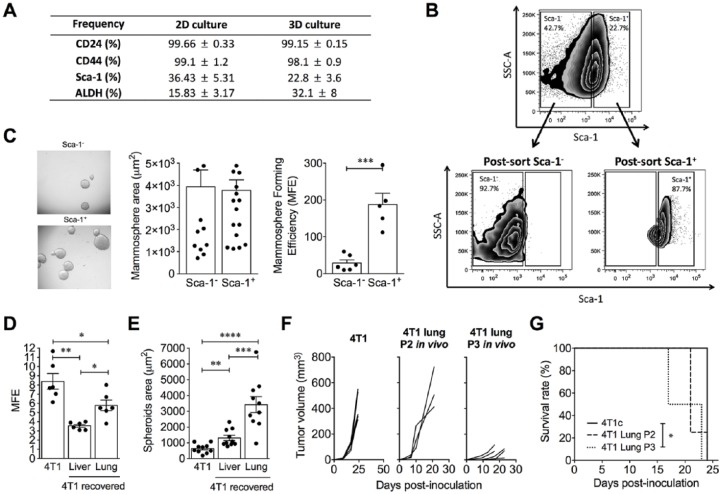
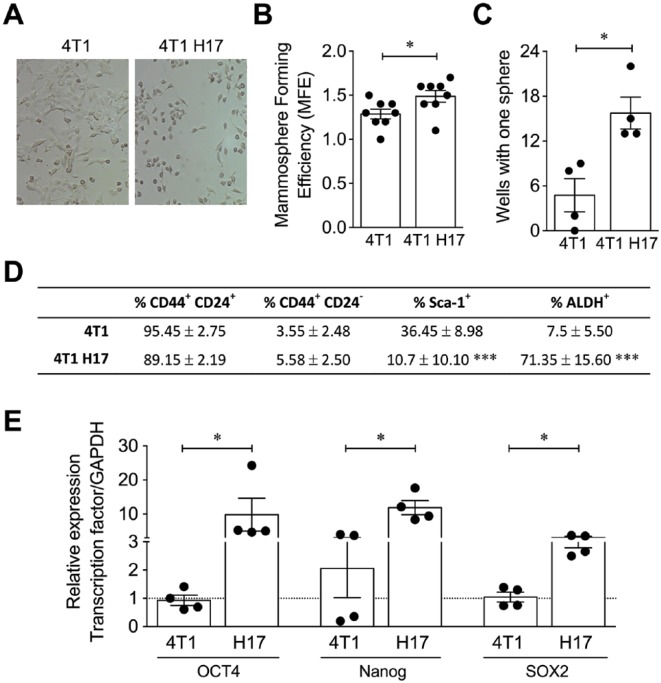
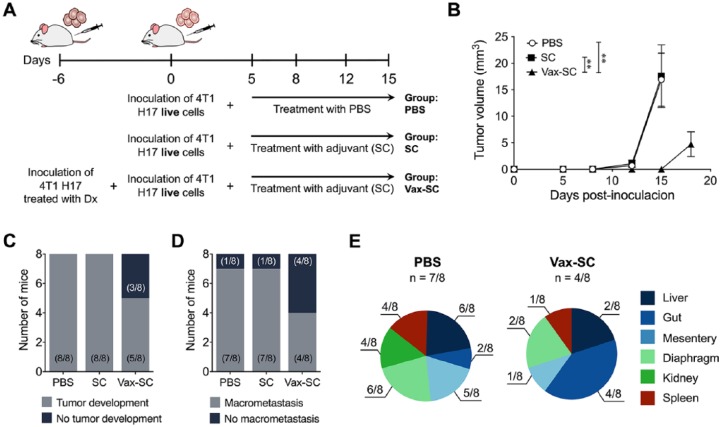
Materials and methods: A tumor population derived from the 4T1 breast cancer cell line that was stable in vitro and highly aggressive in vivo was obtained, characterized, and determined to exhibit cancer stem cell (CSC) phenotypes (CD44+, CD24+, ALDH+, Oct4+, Nanog+, Sox2+, and high self-renewal capacity). Orthotopic transplantation of these cells allowed us to evaluate their in vivo susceptibility to chemo and immune responses induced after vaccination.

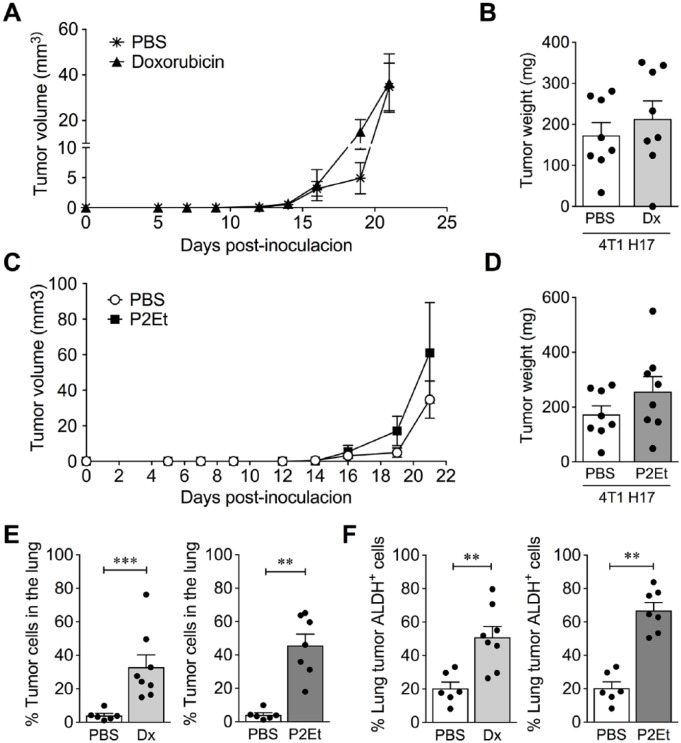
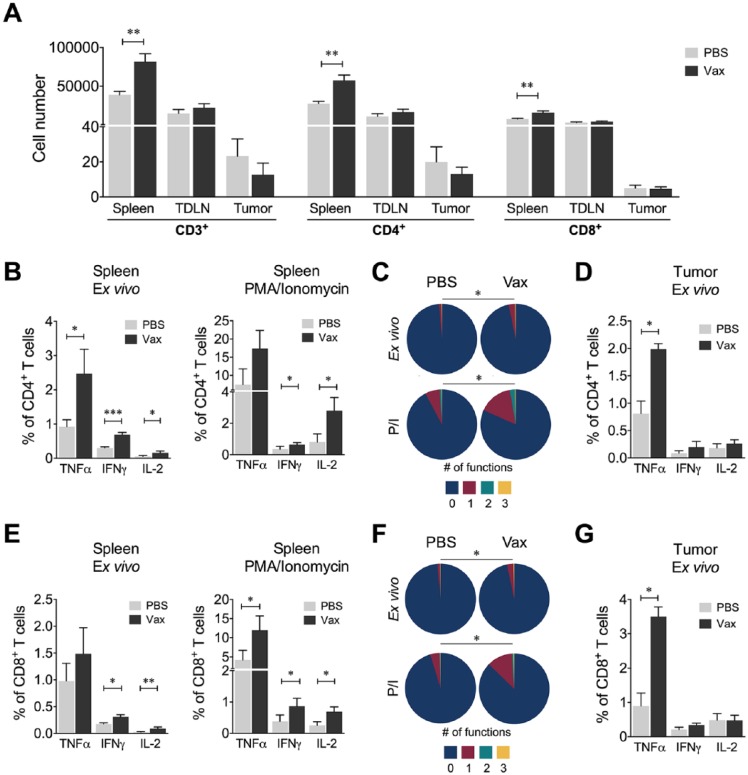
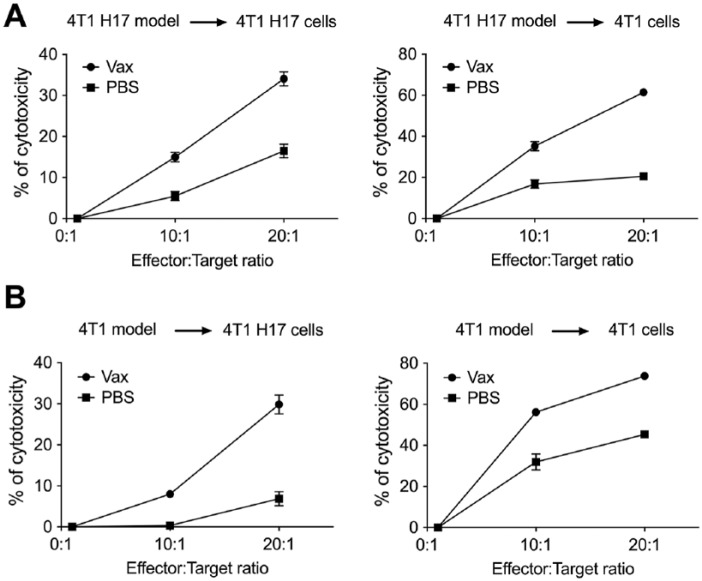
Results: The immune response induced after vaccination with tumor cells treated with doxorubicin decreased the formation of tumors and macrometastasis in this model, which allowed us to confirm the immune response relevance in the control of highly chemotherapy-resistant ALDH+ CSCs in an aggressive tumor model in immunocompetent animals.

Conclusions: The antitumor immune response was the main element capable of controlling tumor progression as well as metastasis in a highly chemotherapy-resistant aggressive breast cancer model.

Keywords: ALDH; breast cancer; cancer stem cells; drug resistance; efflux pumps; immune response.


Conflict of interest statement

Declaration of Conflicting Interests: The author(s) declared the following potential conflicts of interest with respect to the research, authorship, and/or publication of this article: SF, CU, and TAS are inventors of a granted patent related to P2Et. The rest of the authors declare no competing interests.

Figures

Figure 1.
Figure 1.
4T1 3D culture increases the percentage of ALDH+ cells, although Sca-1 is important for mammosphere formation. (A) Frequency of cells expressing cancer stem cell markers (CD24, CD44, Sca-1, ALDH) on 4T1 cells grown in 2D and 3D cultures. (B) Representative flow cytometry plots showing the pre- and postsorting of Sca-1+ and Sca-1 cells. (C) Representative image of mammosphere formation from Sca-1+ and Sca-1 4T1 cells. Bars show the mammosphere diameter (µm2) and mammosphere forming efficiency (MFE) of Sca-1+ and Sca-1 4T1 cells. (D) Mammosphere forming efficiency and (E) mammosphere diameter (µm2) of conventional 4T1 cells and metastatic 4T1 cells recovered from liver and lung. (F) Primary tumor growth in mice inoculated with conventional 4T1 and metastatic cells obtained from lung after serial passages in vivo. (G) Kaplan-Meier survival analysis in mice inoculated with conventional 4T1 and metastatic cells obtained from lung after serial passages in vivo. In all cases, data are presented as the mean ± SEM. The P values were calculated using the Mann-Whitney U test. *P < .05, **P < .01, ***P < .001.
Figure 2.
Figure 2.
4T1 H17 cells exhibited characteristics of cancer stem cells. (A) Representative image of conventional 4T1 and 4T1 H17 cells cultured in 2D. (B) Mammosphere forming efficiency of 4T1 and 4T1 H17 cells cultured for 7 days in ultralow attachment plates. (C) Sphere formation from single cells. 4T1 and 4T1 H17 cells were diluted to 1 cell per well in 96-well ultralow attachment plates, and sphere formation was tracked over time. After 7 days, the wells with only one sphere were counted. (D) Frequency of 4T1 and 4T1 H17 cells expressing cancer stem cell markers evaluated by flow cytometry. (E) Relative expression of the stem transcription factors Oct4, Nanog, and Sox2 by qRT-PCR in 4T1 and 4T1 H17 cells. In all cases, the data are presented as the mean ± SEM. The P values were calculated using the Mann-Whitney U test (B, C, E) and Student’s t test (D). *P < .05, ***P < .001.
Figure 3.
Figure 3.
4T1 H17 cells are more resistant to doxorubicin independent of ABC pump expression. (A) IC50 values of 4T1, 4T1 H17, and 4T1 sp cells after treatment with doxorubicin (Dx). Total RNA was extracted from 4T1, 4T1 H17, and 4T1 sp cells to determine the mRNA expression of the ABC pumps by conventional (B) and real-time PCR (C). (D) 4T1, 4T1 H17, and 4T1 sp cells were cultured with or without cyclosporine A, and TMRM was subsequently added. Then, the MFI was analyzed by flow cytometry; histograms: white, unstained; light gray, no cyclosporine A treatment; and dark gray, cyclosporine A treatment. (E) IC50 value in 4T1 and 4T1 H17 cells treated with Dx or Dx plus DEAB.
Figure 4.
Figure 4.
4T1 H17 cells are resistant to doxorubicin and P2Et treatment in vivo. 4T1 H17 cells were inoculated into mouse mammary glands, which were then treated with PBS (control), Dx, or P2Et for 21 days. The tumors were measured and compared among groups. (A and C) Tumor volume (mm3) of 4T1 H17 control cells (PBS) versus 4T1 H17 cells treated with Dx or P2Et. (B and D) Tumor weight of 4T1 H17 control cells versus 4T1 H17 cells treated with Dx or P2Et. (E) Frequency of metastatic tumor cells in the lungs of mice bearing 4T1 H17 tumors treated with Dx or P2Et versus PBS. (F) The recovered cells of the lungs were stained using an ALDEFLUOR kit. Percentage of ALDH+ cells in the lungs of mice bearing 4T1 H17 tumors treated with Dx or P2Et versus PBS. In all cases, data are presented as the mean ± SEM. The P values were calculated using the Mann-Whitney U test. **P < .01, ***P < .0001.
Figure 5.
Figure 5.
Mice vaccinated with 4T1 H17 cells treated with Dx showed a better outcome in the in vivo model. (A) Experimental treatment scheme. 4T1 H17 cells were treated for 48 hours with Dx and then inoculated into the mouse mammary gland; 6 days later, live cells were inoculated into the opposite mammary gland, and 5 days later, the mice were treated with 90 mg/kg of SC adjuvant twice a week. (B) Tumor volume (mm3) of the 4T1 H17 control (PBS) mice, 4T1 H17 mice treated with SC adjuvant (SC) or mice vaccinated with dead 4T1 H17 cells (Vax-SC) and then treated with SC adjuvant. (C) Pie charts showing the number of mice that developed tumors among the groups. (D) Pie charts showing the number of mice that developed macrometastasis among the groups. (E) Pie charts showing the different organs with macrometastasis and the number of mice that presented macrometastasis between groups. The P values were calculated using the Mann-Whitney U test. **P < .01.
Figure 6.
Figure 6.
Immune response of T cells from vaccinated mice. (A) Number of CD3+, CD4+, and CD8+ T cells evaluated in the spleens, tumor-draining lymph nodes (TDLNs), and tumors from vaccinated (Vax) or nonvaccinated (PBS) mice. The number of cells reported in a tumor was determined as the cell number per mg of tumor. (B) Frequency of CD4+ T cells from spleen producing TNFα, IFNγ, or IL-2 ex vivo or following stimulation with PMA/ionomycin (P/I). (C) Polyfunctional activity of CD4+ T cells from spleen, without stimulus or following stimulation with P/I, from vaccinated or nonvaccinated mice. The functional profiles are grouped and color-coded according to the number of functions, as shown in the pie charts. (D) Frequency of CD4+ T cells from tumors producing TNFα, IFNγ, or IL-2 ex vivo or following stimulation with PMA/ionomycin (P/I). (E) Frequency of CD8+ T cells from spleen producing TNFα, IFNγ, or IL-2 ex vivo or following stimulation with P/I. (F) Polyfunctional activity of CD8+ T cells from spleen, without stimulus or following stimulation with P/I, from vaccinated or nonvaccinated mice. The functional profiles are grouped and color-coded according to the number of functions, as shown in the pie charts. (G) Frequency of CD8+ T cells from tumors producing TNFα, IFNγ, or IL-2 ex vivo or following stimulation with PMA/ionomycin (P/I). In all cases, the data are presented as the mean ± SEM. The P values were calculated using the Mann-Whitney U test. The P values of the permutation test in the coexpression analysis (C and F) are shown in the pie charts. *P < .05, **P < .01, ***P < .001.
Figure 7.
Figure 7.
Cytotoxicity assay by CFSE and 7-AAD staining. CFSE-stained target cells were cocultured with spleen cells from vaccinated or nonvaccinated 4T1 or 4T1 H17 tumor-bearing mice at E:T ratios of 0:1, 10:1, and 20:1. (A) Cytotoxicity percentage of spleen cells from vaccinated or nonvaccinated 4T1 H17 tumor-bearing mice against 4T1 H17 or 4T1 conventional target cells. (B) Cytotoxicity percentage of spleen cells from vaccinated or nonvaccinated 4T1 tumor-bearing mice against 4T1 H17 or 4T1 conventional target cells. In all cases, the data are presented as the mean ± SEM.

References

    1. Bonofiglio D, Giordano C, De Amicis F, Lanzino M, Ando S. Natural products as promising antitumoral agents in breast cancer: mechanisms of action and molecular targets. Mini Rev Med Chem. 2016;16:596-604. - PubMed
    1. Urueña C, Gomez A, Sandoval T, et al. Multifunctional T lymphocytes generated after therapy with an antitumor gallotannin-rich normalized fraction are related to primary tumor size reduction in a breast cancer model. Integr Cancer Ther. 2015;14:468-483. - PubMed
    1. Urueña C, Mancipe J, Hernandez J, et al. Gallotannin-rich Caesalpinia spinosa fraction decreases the primary tumor and factors associated with poor prognosis in a murine breast cancer model. BMC Complement Altern Med. 2013;13:74. - PMC - PubMed
    1. Kakarala M, Brenner DE, Korkaya H, et al. Targeting breast stem cells with the cancer preventive compounds curcumin and piperine. Breast Cancer Res Treat. 2010;122:777-785. - PMC - PubMed
    1. Pandey PR, Okuda H, Watabe M, et al. Resveratrol suppresses growth of cancer stem-like cells by inhibiting fatty acid synthase. Breast Cancer Res Treat. 2011;130:387-398. - PMC - PubMed

Publication types

Substances