. 2019 Apr 16:10:796.
doi: 10.3389/fimmu.2019.00796. eCollection 2019.

Cellular Immune Function in Myalgic Encephalomyelitis/Chronic Fatigue Syndrome (ME/CFS)

Affiliations

Cellular Immune Function in Myalgic Encephalomyelitis/Chronic Fatigue Syndrome (ME/CFS)

Jacqueline M Cliff et al. Front Immunol. .

Abstract

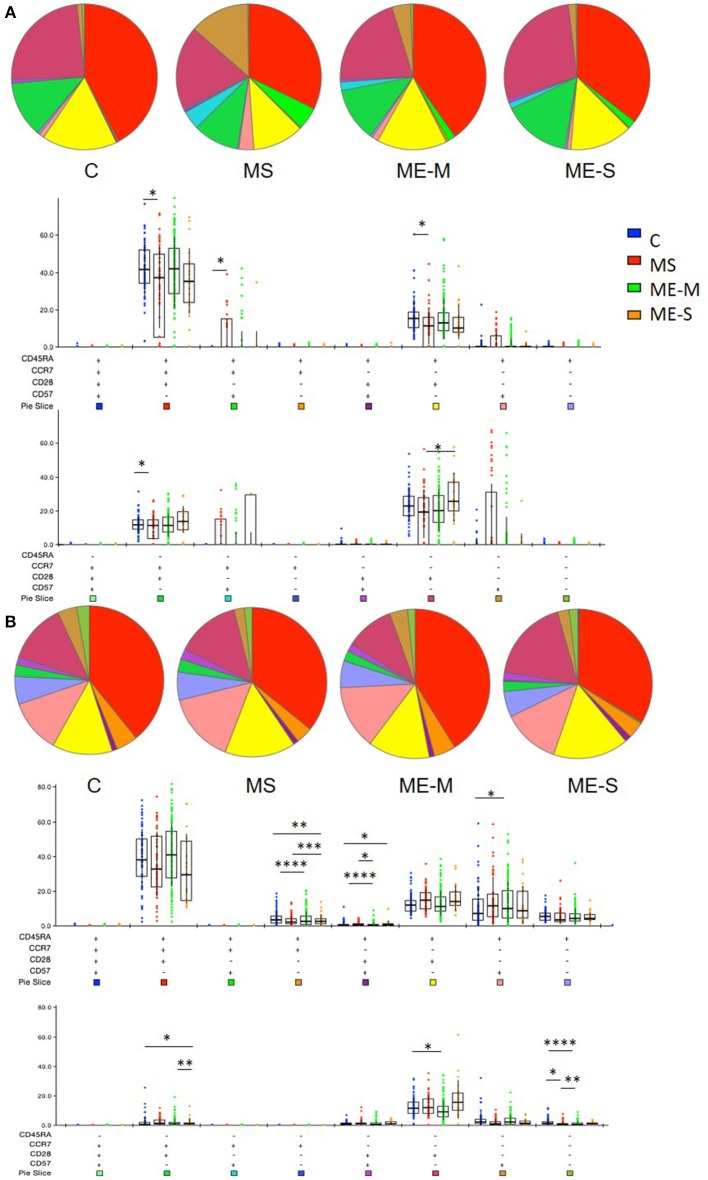
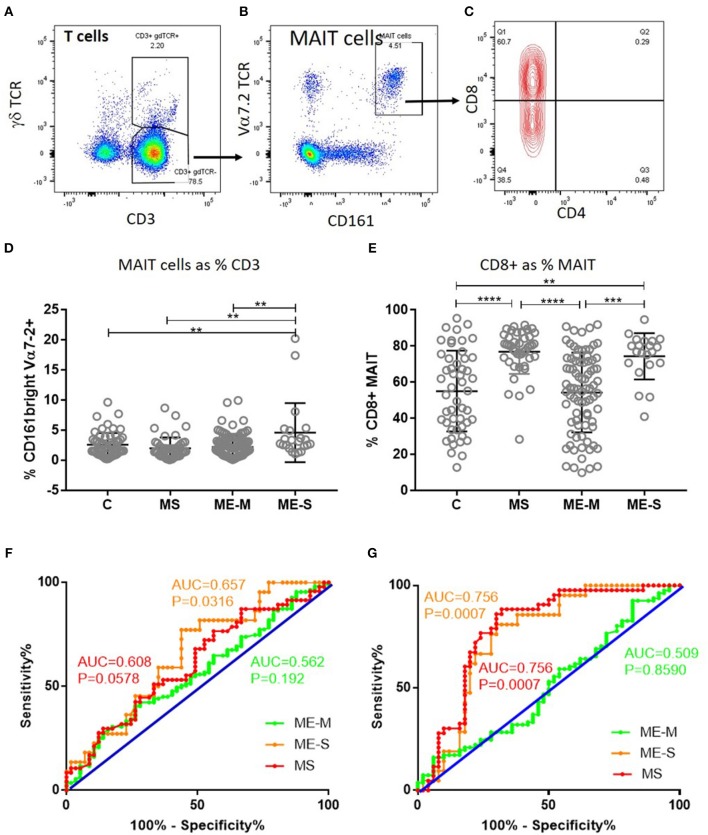
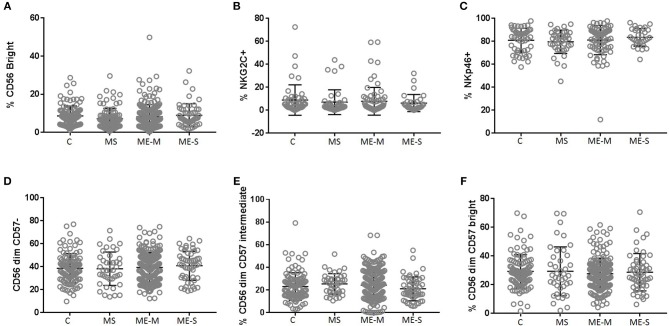
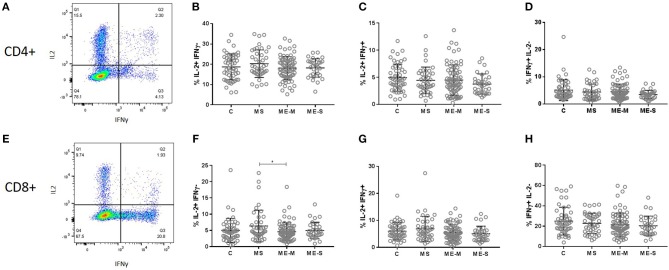
Myalgic encephalomyelitis/chronic fatigue syndrome (ME/CFS) is a debilitating condition with unknown aetiology, Myalgic encephalomyelitis unclear pathophysiology and with no diagnostic test or biomarker available. Many patients report their ME/CFS began after an acute infection, and subsequent increased frequency of infections, such as colds or influenza, is common. These factors imply an altered immunological status exists in ME/CFS, in at least a proportion of patients, yet previous studies of peripheral immunity have been discrepant and inconclusive. The UK ME/CFS Biobank, which has collected blood samples from nearly 300 clinically-confirmed ME/CFS patients, enables large-scale studies of immunological function in phenotypically well-characterised participants. In this study, herpes virus serological status and T cell, B cell, NK cell and monocyte populations were investigated in 251 ME/CFS patients, including 54 who were severely affected, and compared with those from 107 healthy participants and with 46 patients with Multiple Sclerosis. There were no differences in seroprevalence for six human herpes viruses between ME/CFS and healthy controls, although seroprevalence for the Epstein-Barr virus was higher in multiple sclerosis patients. Contrary to previous reports, no significant differences were observed in NK cell numbers, subtype proportions or in vitro responsiveness between ME/CFS patients and healthy control participants. In contrast, the T cell compartment was altered in ME/CFS, with increased proportions of effector memory CD8+ T cells and decreased proportions of terminally differentiated effector CD8+ T cells. Conversely, there was a significantly increased proportion of mucosal associated invariant T cells (MAIT) cells, especially in severely affected ME/CFS patients. These abnormalities demonstrate that an altered immunological state does exist in ME/CFS, particularly in severely affected people. This may simply reflect ongoing or recent infection, or may indicate future increased susceptibility to infection. Longitudinal studies of ME/CFS patients are needed to help to determine cause and effect and thus any potential benefits of immuno-modulatory treatments for ME/CFS.

Keywords: MAIT cells; T cell differentiation; chronic fatigue syndrome; herpes viruses; myalgic encephalomyelitis; natural killer cells.


Figures

Figure 1
Figure 1
Leucocyte gating strategy for phenotypic characterisation of PBMC. Thawed PBMC from Biobank participants were stained with labelled antibodies (Supplementary Table S2), expression data were collected by Flow cytometry and analysed using FlowJo. (A) Single cells were gated based on their forward scatter height and area, and (B) monocytes within the single cell gate were identified as CD14+. (C) Dendritic cells were identified within the CD3-CD14- cell population as myeloid (CD11c+) or plasmacytoid (CD123+) DCs. (D) Lymphocytes were identified based on their forward and side scatter area profiles, and B cells were identified as CD19+ (E), T cells as CD3+ (F), and NK cells as CD56+ (G). Within the NK cell gate, NK cells were characterised further based on NKG2C (H), NKp46 (I), and CD57 (J) co-expression.
Figure 2
Figure 2
Leucocyte populations in peripheral blood from people with ME/CFS, people with MS and healthy controls. PBMC were analysed by flow cytometry, as described in Figure 1. The proportions of PBMC which were (A) monocytes, (B) myeloid dendritic cells, (C) plasmacytoid dendritic cells, (D) B cells, (E) T cells or (F) NK cells were calculated and shown for individual study participants. The bars show the Mean ± SD. Data are from healthy controls (C, n = 107), multiple sclerosis (MS: n = 46), mild/moderate ME/CFS (ME-M: n = 197), and severely affected ME/CFS (ME-S: n = 54) for (A,D–F) and from C (n = 56), MS (n = 46), ME-M (n = 120), and ME-S (n = 21) for (B,C). Clinical groups were compared by Kruskal-Wallis test for non-parametric data: *P < 0.05, **P < 0.01, ****P < 0.0001.
Figure 3
Figure 3
T cell subset quantification in PBMC from people with ME/CFS, people with MS and healthy controls. Within the T cell gate (CD3+), the CD4+ and CD8 staining was characterised to calculate the proportion of (A) CD4+ T cells, (B) CD8+ T cells, (C) double positive CD4+CD8+ T cells, and (D) the ratio of CD4+:CD8+ T cells. (E) The proportion of T cells which expressed the γδ TCR within the CD3+ T cell population were determined. Data are from healthy controls (C: n = 107), multiple sclerosis (MS: n = 46), mild/moderate ME/CFS (ME-M: n = 197), and severely affected ME/CFS (ME-S: n = 54) for (A–D), and from C (n = 56), MS (n = 46), ME-M (n = 120), and ME-S (n = 21) for (E). Clinical groups were compared by Kruskal-Wallis test for non-parametric data: *P < 0.05, **P < 0.01, ***P < 0.001, ****P < 0.0001.
Figure 4
Figure 4
Delineation of T cell naïve and memory cells in ME/CFS and MS patients and controls. CD4+ (A–E) and CD8+ (F–J) T cells were analysed for CD45RA and CCR7 co-expression to quantify proportions which were naïve CD45RA+CCR7+ (B,G), effector memory RA (TEMRA) CD45RA+CCR7 (C,H), effector memory CD45RACCR7 (D,I) or central memory CD45RACCR7+ T cells. The bars show the Mean and SD. Data are from C (n = 56), MS (n = 46), ME-M (n = 120), and ME-S (n = 21). Clinical groups were compared by Kruskal-Wallis test for non-parametric data.
Figure 5
Figure 5
Proportions of differentiated T cell populations in people with ME/CFS, people with MS and healthy controls. CD4+ (A) and CD8+ (B) T cells were analysed for CCR7, CD45RA, CD28, and CD57 co-expression to quantify proportions of T cells expressing combinations of these markers using FlowJo and SPICE software. The pie charts show the median proportions of each cell type in each clinical group. In the bar and whisker plots, cell populations were compared between clinical groups by Kruskal-Wallis test with Dunn's correction for multiple comparisons for each cell differentiation subtype, with only significant (P < 0.05) results shown. The colour under each cell phenotype bar chart shows its representation in the pie charts. Data are from C (n = 56), MS (n = 46), ME-M (n = 120), and ME-S (n = 21). *P < 0.05, **P < 0.01, ***P < 0.001, ****P < 0.0001.
Figure 6
Figure 6
Mucosal Associated Invariant T cells in peripheral blood of people with ME/CFS, people with MS and healthy controls. By flow cytometry, within the CD3+γδTCR T cell population (A), MAIT cells were identified as Vα7.2+CD161++ in PBMC (B). MAIT cells were further characterised based on CD4+ or CD8+ expression (C). (D) The proportion of T cells which were MAIT cells in PBMC from mild-moderate ME/CFS (ME-M), severely affected ME/CFS (ME-S), multiple sclerosis (MS), and healthy controls (C) is shown. (E) The proportion of MAIT cells which were CD8+ is shown for each individual. (A–C) Data from one representative severely affected ME/CFS patient. (D,E) Data are from C (n = 56), MS (n = 46), ME-M (n = 120), and ME-S (n = 21). Clinical groups were compared by Kruskal-Wallis test for non-parametric data: **P < 0.01, ***P < 0.001, ****P < 0.0001. (F) ROC curve analysis of proportions of the CD3+γδTCR T cell population which were MAIT cells for the different patient groups relative to the Healthy Controls. (G) ROC curve analysis of proportions of MAIT cells which were CD8+ for the different patient groups relative to the Healthy Controls. AUC, Area Under the Curve.
Figure 7
Figure 7
Proportions of Natural Killer Cell subsets in PBMC from people with ME/CFS, people with MS and healthy controls. By flow cytometry, NK cells were defined as CD3CD56+ as shown in Figure 1. Subpopulations were defined as CD56bright (A), NKG2C+ (B), NKp46+(C), CD56dimCD57 (D), CD56dimCD57intermediate(E), or CD56dimCD57bright(F) for PBMC from mild/moderately affected ME/CFS (ME-M) or severely affected ME/CFS (ME-S), multiple sclerosis (MS) patients or healthy control individuals (C). Populations of each type of NK cell were compared across clinical groups by ANOVA, but no significant differences were observed (P < 0.05). The bars show the Mean ± SD. Data are from healthy controls (C, n = 107), multiple sclerosis (MS: n = 46), mild/moderate ME/CFS (ME-M: n = 197), and severely affected ME/CFS (ME-S: n = 54) for (A,D–F) and from C (n = 50), MS (n = 41), ME-M (n = 76), and ME-S (n = 32) for (B,C).
Figure 8
Figure 8
Production of cytokines by T cells in response to stimulation in vitro. PBMC from mild/moderately affected ME/CFS (ME-M: n = 76), severely affected ME/CFS (ME-S: n = 32) or multiple sclerosis (MS: n = 41) patients or healthy control (C: n = 50) individuals were cultured in vitro with PMA and ionomycin for 4 h. The production of IFNγ and IL-2 cytokines was assessed in CD4+ (A–D) and CD8+ (E–H) T cells, with the proportions of cells which produced only IL2 (B,F), both IL2 and IFNγ (C,G) or only IFNγ (D,H) calculated for each study participant. Within the dot plots, the lines show the means and the error bars show ± SD.
Figure 9
Figure 9
Natural Killer Cell function in vitro in people with ME/CFS, people with MS and healthy controls. PBMC were incubated in vitro various stimuli and NK cell function analysed by flow cytometry. (A) Flow cytometry gating strategy showing NK cell (CD3 CD56+) expression of CD25, IFNγ or CD107a (degranulation marker) following incubation with or without IL12/IL18 for 18 h, in one representative donor. (B) Expression of CD25, IFNγ, and CD107 in NK cells following IL12/IL18 stimulation of PBMC from mild/moderately affected ME/CFS (ME-M: n = 76), severely affected ME/CFS (ME-S: n = 32) or multiple sclerosis (MS: n = 41) patients or healthy control (C: n = 50) individuals. CD107a expression on NK cells following 18 h stimulation by (C) cross-linking anti-CD16 monoclonal antibodies, (D) MHC Class-I deficient K562 cells or (E) CpG. Within the dot plots, the lines show the means and the error bars show ± SD.

Similar articles

Cited by

References

    1. Fukuda K, Straus SE, Hickie I, Sharpe MC, Dobbins JG, Komaroff A. The chronic fatigue syndrome: a comprehensive approach to its definition and study. International chronic fatigue syndrome study group. Ann Intern Med. (1994) 121:953–9. 10.7326/0003-4819-121-12-199412150-00009 - DOI - PubMed
    1. Carruthers B, Jain AK, De Meirleir KL, Peterson DL, Klimas NG, Lerner AM, et al. Myalgic encephalomyelitis/chronic fatigue syndrome: clinical working case definition, diagnostic and treatment guidelines a consensus document. J Chronic Fat Syndr. (2003) 11:7–115. 10.1300/J092v11n01_02 - DOI
    1. Nacul LC, Lacerda EM, Campion P, Pheby D, Drachler Mde L, Leite JC, et al. . The functional status and well being of people with myalgic encephalomyelitis/chronic fatigue syndrome and their carers. BMC Public Health. (2011) 11:402. 10.1186/1471-2458-11-402 - DOI - PMC - PubMed
    1. Kingdon CC, Bowman EW, Curran H, Nacul L, Lacerda EM. Functional status and well-being in people with myalgic encephalomyelitis/chronic fatigue syndrome compared with people with multiple sclerosis and healthy controls. Pharmacoecon Open. (2018) 2:381–92. 10.1007/s41669-018-0071-6 - DOI - PMC - PubMed
    1. Lorusso L, Mikhaylova SV, Capelli E, Ferrari D, Ngonga GK, Ricevuti G. Immunological aspects of chronic fatigue syndrome. Autoimmun Rev. (2009) 8:287–91. 10.1016/j.autrev.2008.08.003 - DOI - PubMed

Publication types

Substances